- Posts: 635
- Thank you received: 0
Spring storm cycle, 4-10 ft snow Mar25-Apr7,2014!
- Amar Andalkar
-
 Topic Author
- User
-

Less
More
12 years 3 weeks ago - 12 years 3 weeks ago #221562
by Amar Andalkar
Spring storm cycle, 4-10 ft snow Mar25-Apr7,2014! was created by Amar Andalkar
A major spring storm cycle is underway, which is expected to bring another 4-10 ft of snow (perhaps more) over the last week of March and into early April to southwestern BC, Washington, Oregon, and northern California!
[size=small]See also earlier threads:
First major storm cycle of the 2013-14 season brings 4-8 ft of snow (January 7-14, 2014)
Another major storm cycle brings 2-5 ft of snow (January 28-February 1, 2014)
HUGE storm cycle brings 4-14 ft of snow (February 6-25, 2014)
New storm cycle brings 4-8 ft of snow (February 26-March 10, 2014) [/size]
[hr][size=small]Well, this one looks like it will be very interesting and lots of fun to write about! So here's another storm cycle thread:[/size]
After a highly atypical start to March 2014, with a very wet and fairly warm storm cycle including a pair of atmospheric river events more reminiscent of November than March, the middle part of the month from March 11-24 delivered very typical March weather: a few moderate storm systems each bringing up to 1-2 ft of snow to the Pacific Northwest, with clear sunny periods in between, and extended dry sunny weather throughout the entire 2 weeks in California. But weather models during the past several days have been indicating a major and sustained pattern change, and that change has now arrived!
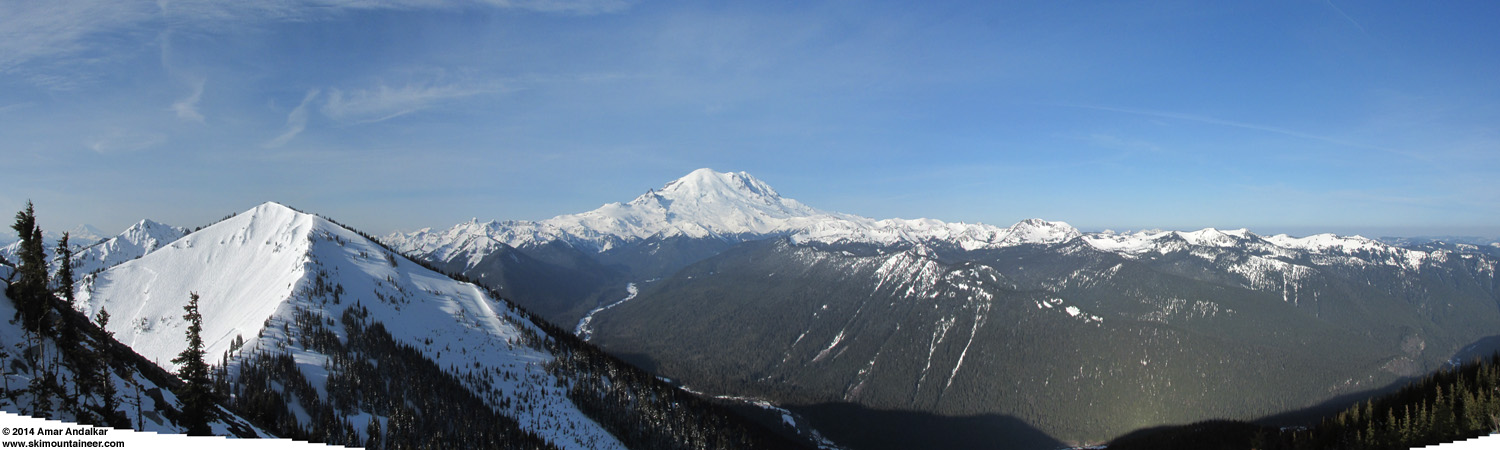
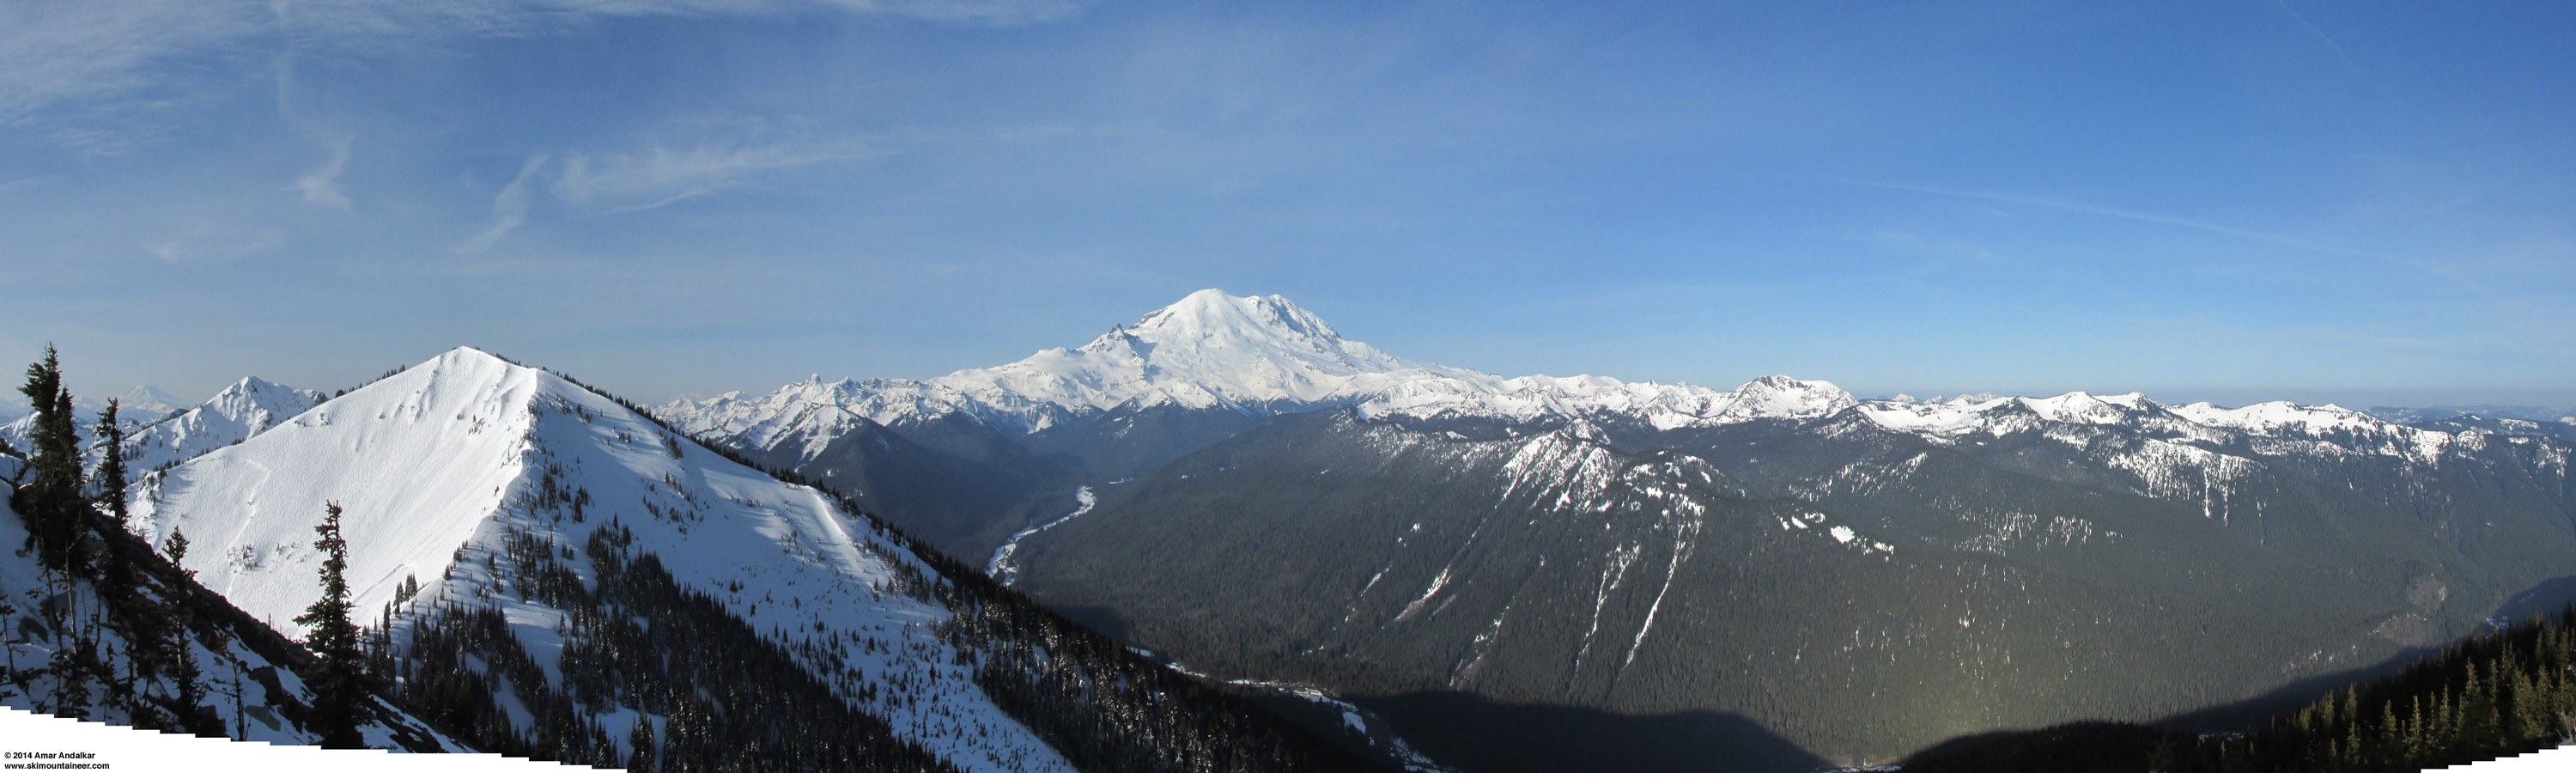
[size=small](click for triple-size version)[/size]
[size=small]The calm before the storms, March 24: Five-shot panorama of Mount Rainier from atop Crystal Mountain, but there's much to see besides just the Mountain here. Of particular note are the two large old avalanche crowns and hundreds of new ski tracks in Powder Bowl at left, having opened for hike-to access the previous afternoon for the first time since the massive Throne avalanche destroyed the High Campbell lift on March 10, and also the bright glow on the forested hillside at right, far below in the White River valley. This glow is heiligenschein , or more precisely in this case sylvanshine , a retroreflection from dew-covered coniferous trees which have a waxy cuticle on their needles, which produces this bright glow at the antisolar point.[/size]
The first in what is expected to be a lengthy series of storm systems reached the West Coast late on the evening of Monday, March 24, with snowfall at higher-elevation coastal mountain sites beginning by midnight on Tuesday, March 25. Models predict that additional storms will arrive every 1-2 days throughout the rest of this week and next week too, and in general, the upper-level flow will be primarily westerly most of the time, keeping snow levels moderately low for this time of year. An excellent pattern for producing heavy snowfall down to pass elevations (or slightly below) throughout the Pacific Northwest and most of northern California as far south as the central Sierra Nevada. Best of all, the heaviest precipitation and snowfall is expected to occur over the region that needs it the most: southern Oregon and northern California, where the snowpack as a percent of normal is lowest and the drought situation is most critical. But all of the West Coast mountains from southwestern BC to northern California should get hammered with snow over the next 1-2 weeks.
Before looking at what's on the way during this storm cycle, here's a look at the current snowpack status as of midnight on March 25, with data from SNOTEL and California Cooperative Snow Surveys :
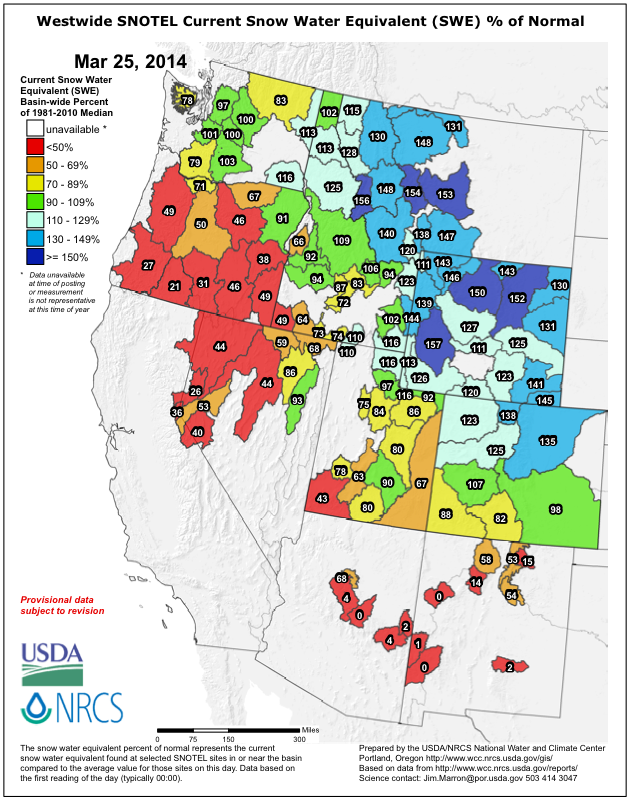
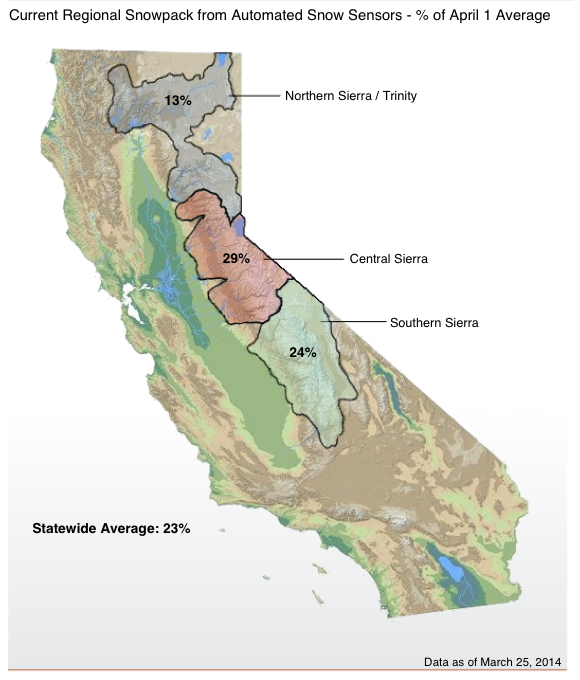
Near-normal snowpack in the Washington Cascades and not too bad in the Olympics and Mount Hood, but well below-normal for the rest of the northern Oregon Cascades and far below-normal in the southern Oregon Cascades, California Cascades, Trinity Alps, and Sierra Nevada. In all 3 regions of the California map, this graph shows that the snowpack has now dropped to record low values as of March 25, below the previous record lows of the 1976-77 drought season:
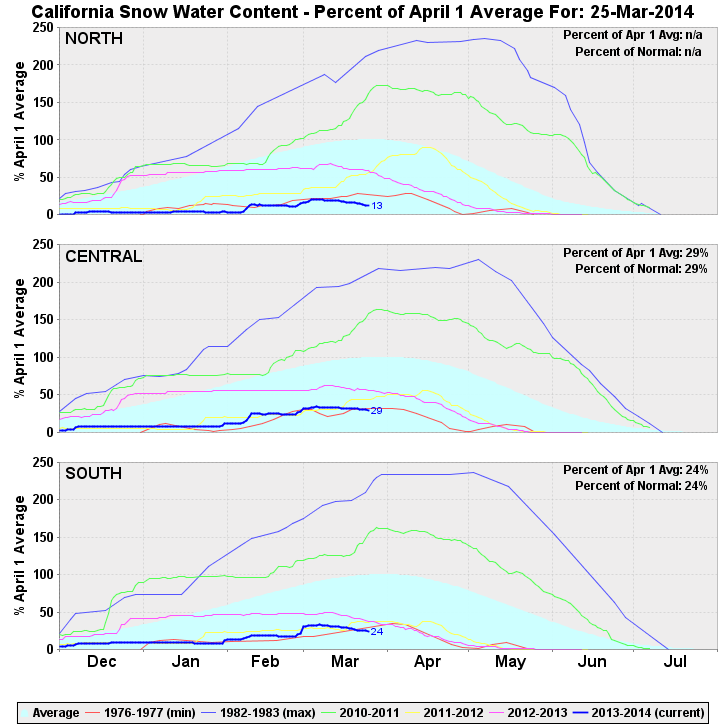
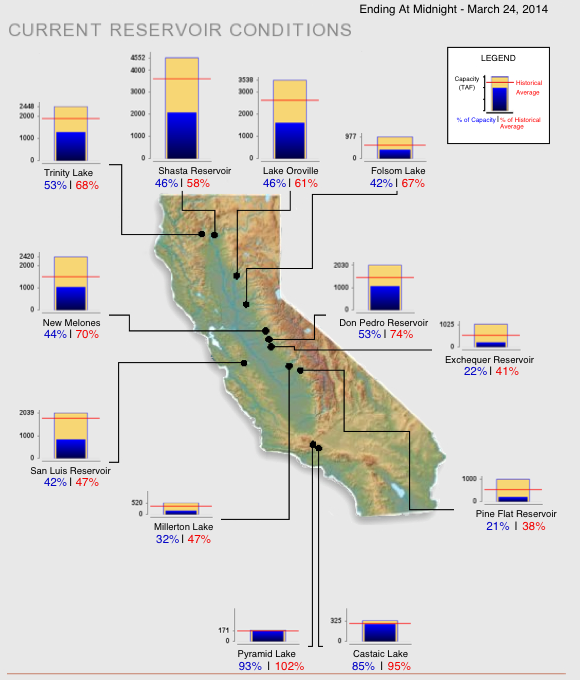
In the northern region, the snowpack is only 13% of normal and about half (!) of the previous record low for this date. Statistically, this is an almost inconceivably low and extraordinarily unlikely value for the snowpack so close to the normal April 1 seasonal maximum, especially averaged over such a large and normally well-watered region. The three largest reservoirs in California (Shasta Lake, Lake Oroville, and Trinity Lake) are located within that critically-low northern region. However, despite record-low precip and a snowpack less than half of the 1976-77 drought season, California reservoir levels remain above those of 1977, probably due to changes in conservation and management practices. Nevertheless the California water supply is not looking good at all:
But this should help the dire situation somewhat: the NWS's GFS model and their Quantitative Precipitation Forecasts are showing up to 6-12" of precip over the next week for the mountains of Washington, Oregon, and northern California, with 1-3" extending north into southwestern BC. Here is total precipitation in inches predicted over the next 7 days through the morning of Tuesday, April 1:
The high-resolution UW WRF-GFS model is showing total snowfall amounts up to 4-8 ft or more over the next week for the mountains of southwestern BC, Washington, Oregon, and northern California. Snowfall during the next 3 days from this morning through 5am Friday is predicted to be 2-5 ft over the Oregon Cascades, California Cascades, Trinity Alps, and northern Sierra Nevada, with 1-3 ft for southwestern BC, the Olympics, and Washington Cascades:
Higher resolution version of that, showing the Pacific Northwest and also zoomed in on Washington and Oregon:
Maximum amounts of 4-5 ft (marked by white inside yellow) are shown over the Three Sisters region in Oregon.
This loop shows how the model predictions for snowfall during the 3-day period through 5am Friday have evolved between 10 subsequent runs over the last 5 days, the D(model)/D(t). Very consistent in the overall picture throughout all those runs, with only minor variations in amounts -- the model clearly had a good handle on the start of this storm cycle even 5 days ago:
www.atmos.washington.edu/~ovens/wxloop.c...2+v2014032812///+-st
A strong system is predicted to arrive on Friday, including a modest atmospheric river aimed at southern Oregon and northern California, and additional storm systems are expected to arrive every 1-2 days after that through the weekend and into next week. Additional snowfall during the subsequent 3 days ending 5am next Monday is predicted to be comparable to the first 3 days (or greater in WA and BC) and the heaviest snowfall may extend over a larger area, with another 2-4 ft expected over southwestern BC, the entire Cascade Range, and the northern Sierra Nevada:
The D(model)/D(t) for that 3-day period has been fairly consistent thus far, although there have been only 4 model runs so far extending out to that period:
www.atmos.washington.edu/~ovens/wxloop.c...2+v2014033112///+-st
After a possible brief lull at the end of the weekend, another system next Monday-Tuesday will bring another shot of heavy snowfall, with 1-3 ft in the Sierra and about 1 ft extending north through Oregon during the 24-hour period ending at 5pm next Tuesday:
Details of that period will continue to change as it draws closer, as it is still 6-7 days out, near the limit of accurate numerical weather prediction. Especially so given that the evolution of the several storm systems prior to the weekend will have a significant effect on the development of the subsequent systems, and on upcoming model predictions.
What about the longer term? A definite end to this storm cycle is not yet in sight. The extended GFS model out to 384 hours (16 days) shows additional storm systems throughout the 8-16 day period, although it is best to ignore specific details and amounts that far out. This is the predicted 24-hour precip, click "Loop All" to see all the graphics (3 hour intervals up to 192 hours, 12 hour intervals beyond that):
GFS, North Pacific, 03/25/2014 12UTC, precip_p24
The Climate Prediction Center's broad-brush probabilistic 6-10 and 8-14 Day Outlooks also look promising, with a high likelihood for continued above-normal precipitation at near-to-below normal temperatures in the Pacific Northwest:
[size=small]See also earlier threads:
First major storm cycle of the 2013-14 season brings 4-8 ft of snow (January 7-14, 2014)
Another major storm cycle brings 2-5 ft of snow (January 28-February 1, 2014)
HUGE storm cycle brings 4-14 ft of snow (February 6-25, 2014)
New storm cycle brings 4-8 ft of snow (February 26-March 10, 2014) [/size]
[hr][size=small]Well, this one looks like it will be very interesting and lots of fun to write about! So here's another storm cycle thread:[/size]
After a highly atypical start to March 2014, with a very wet and fairly warm storm cycle including a pair of atmospheric river events more reminiscent of November than March, the middle part of the month from March 11-24 delivered very typical March weather: a few moderate storm systems each bringing up to 1-2 ft of snow to the Pacific Northwest, with clear sunny periods in between, and extended dry sunny weather throughout the entire 2 weeks in California. But weather models during the past several days have been indicating a major and sustained pattern change, and that change has now arrived!
[size=small](click for triple-size version)[/size]
[size=small]The calm before the storms, March 24: Five-shot panorama of Mount Rainier from atop Crystal Mountain, but there's much to see besides just the Mountain here. Of particular note are the two large old avalanche crowns and hundreds of new ski tracks in Powder Bowl at left, having opened for hike-to access the previous afternoon for the first time since the massive Throne avalanche destroyed the High Campbell lift on March 10, and also the bright glow on the forested hillside at right, far below in the White River valley. This glow is heiligenschein , or more precisely in this case sylvanshine , a retroreflection from dew-covered coniferous trees which have a waxy cuticle on their needles, which produces this bright glow at the antisolar point.[/size]
The first in what is expected to be a lengthy series of storm systems reached the West Coast late on the evening of Monday, March 24, with snowfall at higher-elevation coastal mountain sites beginning by midnight on Tuesday, March 25. Models predict that additional storms will arrive every 1-2 days throughout the rest of this week and next week too, and in general, the upper-level flow will be primarily westerly most of the time, keeping snow levels moderately low for this time of year. An excellent pattern for producing heavy snowfall down to pass elevations (or slightly below) throughout the Pacific Northwest and most of northern California as far south as the central Sierra Nevada. Best of all, the heaviest precipitation and snowfall is expected to occur over the region that needs it the most: southern Oregon and northern California, where the snowpack as a percent of normal is lowest and the drought situation is most critical. But all of the West Coast mountains from southwestern BC to northern California should get hammered with snow over the next 1-2 weeks.
Before looking at what's on the way during this storm cycle, here's a look at the current snowpack status as of midnight on March 25, with data from SNOTEL and California Cooperative Snow Surveys :
Near-normal snowpack in the Washington Cascades and not too bad in the Olympics and Mount Hood, but well below-normal for the rest of the northern Oregon Cascades and far below-normal in the southern Oregon Cascades, California Cascades, Trinity Alps, and Sierra Nevada. In all 3 regions of the California map, this graph shows that the snowpack has now dropped to record low values as of March 25, below the previous record lows of the 1976-77 drought season:
In the northern region, the snowpack is only 13% of normal and about half (!) of the previous record low for this date. Statistically, this is an almost inconceivably low and extraordinarily unlikely value for the snowpack so close to the normal April 1 seasonal maximum, especially averaged over such a large and normally well-watered region. The three largest reservoirs in California (Shasta Lake, Lake Oroville, and Trinity Lake) are located within that critically-low northern region. However, despite record-low precip and a snowpack less than half of the 1976-77 drought season, California reservoir levels remain above those of 1977, probably due to changes in conservation and management practices. Nevertheless the California water supply is not looking good at all:
But this should help the dire situation somewhat: the NWS's GFS model and their Quantitative Precipitation Forecasts are showing up to 6-12" of precip over the next week for the mountains of Washington, Oregon, and northern California, with 1-3" extending north into southwestern BC. Here is total precipitation in inches predicted over the next 7 days through the morning of Tuesday, April 1:
The high-resolution UW WRF-GFS model is showing total snowfall amounts up to 4-8 ft or more over the next week for the mountains of southwestern BC, Washington, Oregon, and northern California. Snowfall during the next 3 days from this morning through 5am Friday is predicted to be 2-5 ft over the Oregon Cascades, California Cascades, Trinity Alps, and northern Sierra Nevada, with 1-3 ft for southwestern BC, the Olympics, and Washington Cascades:
Higher resolution version of that, showing the Pacific Northwest and also zoomed in on Washington and Oregon:
Maximum amounts of 4-5 ft (marked by white inside yellow) are shown over the Three Sisters region in Oregon.
This loop shows how the model predictions for snowfall during the 3-day period through 5am Friday have evolved between 10 subsequent runs over the last 5 days, the D(model)/D(t). Very consistent in the overall picture throughout all those runs, with only minor variations in amounts -- the model clearly had a good handle on the start of this storm cycle even 5 days ago:
www.atmos.washington.edu/~ovens/wxloop.c...2+v2014032812///+-st
A strong system is predicted to arrive on Friday, including a modest atmospheric river aimed at southern Oregon and northern California, and additional storm systems are expected to arrive every 1-2 days after that through the weekend and into next week. Additional snowfall during the subsequent 3 days ending 5am next Monday is predicted to be comparable to the first 3 days (or greater in WA and BC) and the heaviest snowfall may extend over a larger area, with another 2-4 ft expected over southwestern BC, the entire Cascade Range, and the northern Sierra Nevada:
The D(model)/D(t) for that 3-day period has been fairly consistent thus far, although there have been only 4 model runs so far extending out to that period:
www.atmos.washington.edu/~ovens/wxloop.c...2+v2014033112///+-st
After a possible brief lull at the end of the weekend, another system next Monday-Tuesday will bring another shot of heavy snowfall, with 1-3 ft in the Sierra and about 1 ft extending north through Oregon during the 24-hour period ending at 5pm next Tuesday:
Details of that period will continue to change as it draws closer, as it is still 6-7 days out, near the limit of accurate numerical weather prediction. Especially so given that the evolution of the several storm systems prior to the weekend will have a significant effect on the development of the subsequent systems, and on upcoming model predictions.
What about the longer term? A definite end to this storm cycle is not yet in sight. The extended GFS model out to 384 hours (16 days) shows additional storm systems throughout the 8-16 day period, although it is best to ignore specific details and amounts that far out. This is the predicted 24-hour precip, click "Loop All" to see all the graphics (3 hour intervals up to 192 hours, 12 hour intervals beyond that):
GFS, North Pacific, 03/25/2014 12UTC, precip_p24
The Climate Prediction Center's broad-brush probabilistic 6-10 and 8-14 Day Outlooks also look promising, with a high likelihood for continued above-normal precipitation at near-to-below normal temperatures in the Pacific Northwest:
Please Log in or Create an account to join the conversation.
- Charlie Hagedorn
-
- User
-
Less
More
- Posts: 913
- Thank you received: 1
12 years 3 weeks ago #221564
by Charlie Hagedorn
Replied by Charlie Hagedorn on topic Re: Spring storm cycle, 4-10 ft snow Mar25-Apr7,2014!
Mighty fine.
Please Log in or Create an account to join the conversation.
- runningclouds
-
- User
-
Less
More
- Posts: 141
- Thank you received: 0
12 years 3 weeks ago #221566
by runningclouds
Replied by runningclouds on topic Re: Spring storm cycle, 4-10 ft snow Mar25-Apr7,2014!
Much appreciated post! Thanks for digging all that data for us Amar.
What do you think of snow-forecast.com? Do you know which models they use?
What do you think of snow-forecast.com? Do you know which models they use?
Please Log in or Create an account to join the conversation.
- pipedream
-
- User
-
Less
More
- Posts: 629
- Thank you received: 0
12 years 3 weeks ago #221570
by pipedream
Replied by pipedream on topic Re: Spring storm cycle, 4-10 ft snow Mar25-Apr7,2014!
So the take-away from this is that I need to leave the fenders on my bike and keep my calendar open for spring powder opportunities. Gotcha.
Excellent analysis, Amar. Looking forward to the cycles!
Excellent analysis, Amar. Looking forward to the cycles!
Please Log in or Create an account to join the conversation.
- joeb
-
- User
-
Less
More
- Posts: 28
- Thank you received: 0
12 years 3 weeks ago #221572
by joeb
Replied by joeb on topic Re: Spring storm cycle, 4-10 ft snow Mar25-Apr7,2014!
That ought to sell some lift tickets!
Appreciate the post and really like that panorama shot.
Don't like the sound of "atmospheric river event" though, particularly if we get a big new snow load this week.
Appreciate the post and really like that panorama shot.
Don't like the sound of "atmospheric river event" though, particularly if we get a big new snow load this week.
Please Log in or Create an account to join the conversation.
- nemolonsdale
-
- User
-
Less
More
- Posts: 26
- Thank you received: 0
12 years 3 weeks ago #221576
by nemolonsdale
Replied by nemolonsdale on topic Re: Spring storm cycle, 4-10 ft snow Mar25-Apr7,2014!
Thanks for the insight.
Looking good for splitfest!
Looking good for splitfest!
Please Log in or Create an account to join the conversation.