- Posts: 635
- Thank you received: 0
Another major storm brings 2-5 ft snow Jan28-Feb1!
- Amar Andalkar
-
 Topic Author
- User
-

Less
More
12 years 2 months ago - 12 years 2 months ago #219973
by Amar Andalkar
Another major storm brings 2-5 ft snow Jan28-Feb1! was created by Amar Andalkar
[size=small](Note: Title edited to include dates.)[/size]
Another major storm cycle to bring 2-5 ft of snow this week, to the Pacific Northwest and to California?!
See also earlier thread: First major storm cycle of the 2013-14 season brings 4-8 ft of snow (January 7-14)
During the past few days, weather models have started predicting another major change in the weather pattern over the West Coast during the rest of this week. The anomalously strong and persistent ridge of high pressure which has lingered just off the West Coast for much of the last 4 months will break down at least for a while, allowing sustained westerly flow once again and the second major winter storm cycle of the 2013-14 season for the Northwest -- and the first for California, where the current snowpack situation is far more dire than the Northwest.
The NWS's GFS model and the high-resolution UW WRF-GFS model which is built on it are showing up to 3-6" of precipitation over the next 3 days, with snow levels dropping into the 2000-4000 ft range. Snowfall during the next 3 days through 4pm Friday is predicted to be 2-5 ft over the west slopes and volcanic peaks of the Washington and Oregon Cascades, plus portions of the high Sierra Nevada:
Higher resolution version of that, zoomed in on WA and OR:
Maximum amounts of 4-5 ft (marked by white inside yellow) are shown on Mounts Rainier and Adams, with 3-4 ft for Mounts Hood, Jefferson, and the Three Sisters in Oregon.
Details beyond the 3-4 day period are still murky and uncertain, best to wait a few more days and see how this system plays out. But there is no indication as of now of the ridge rebuilding strongly again immediately after this system.
Please Log in or Create an account to join the conversation.
- spresho
-
- User
-
Less
More
- Posts: 32
- Thank you received: 0
12 years 2 months ago - 12 years 2 months ago #219974
by spresho
Replied by spresho on topic Re: Another major storm brings 2-5 ft snow this week?
Being color blind sure is a drag.
Please Log in or Create an account to join the conversation.
- Charlie Hagedorn
-
- User
-
Less
More
- Posts: 913
- Thank you received: 1
12 years 2 months ago - 12 years 2 months ago #219975
by Charlie Hagedorn
Replied by Charlie Hagedorn on topic Re: Another major storm brings 2-5 ft snow this week?
For sure.
I'm not colorblind, but one of my advisors is, so I'm used to plotting in blue/yellow. The scales on these plots are fairly colorblind-friendly, but the topography's not, making it impossible to follow the gradient. In some of these plots, the Olympics are a different red/green than the Cascades.
Have you seen the browser Daltonizer tools? There's a Chrome extension (didn't try it), and some javascript bookmarklets that Daltonize TAY/these plots.
The latter one should work on most browsers, and has a big effect on the color spectrum displayed. Perhaps one of the tools might work for you? Do they work?
The simulators can be enlightening for the non-colorblind; they changed my understanding of colorblindness the first time I used them on my own plots. I find that a plot that's clear for my advisor is clearer for everyone else, too.
To get a sense of what spresho is talking about, try the "Protanope" simulator on the bookmarklet page against the TAY plots. It's an impressive effect in this case.
Please Log in or Create an account to join the conversation.
- avajane
-

- User
-
Less
More
- Posts: 641
- Thank you received: 1
12 years 2 months ago #219980
by avajane
Replied by avajane on topic Re: Another major storm brings 2-5 ft snow this week?
Don't worry Scott, he said only 3-6'' where you usually ski. ")
Please Log in or Create an account to join the conversation.
- Amar Andalkar
-
Topic Author
- User
-
Less
More
- Posts: 635
- Thank you received: 0
12 years 2 months ago - 12 years 2 months ago #219992
by Amar Andalkar
Replied by Amar Andalkar on topic Re: Another major storm brings 2-5 ft snow this week?
Update: 24 hours later, models are still predicting 2-5 ft of snow this week for the Pacific Northwest and California!
A day later, and 2 subsequent runs of the UW WRF-GFS model at 12-hour intervals continue to show similar predictions for large snowfall amounts. Consistency between subsequent model runs typically tends to indicate that the predictions are more likely to actually verify.
The first round of significant precipitation moved in on Tuesday evening as predicted. As of Wednesday morning, about 1-1.5" of precip has already fallen along the west slopes and crest of the Washington Cascades from about Stevens Pass southward, with less in the Olympics (< 1") and far less in the North Cascades (generally < 0.4"). Much more has fallen farther south, with 2-3" on Mount Saint Helens, Hood, and other parts of the northern Oregon Cascades.
Snow levels were about 6-7000 ft during this time, so about 1-2 ft of new snow has already fallen at elevations above that. A cold front moving southward Wednesday morning is rapidly lowering snow levels to 3-4000 ft, with snowfall already extending far below Snoqualmie Pass to under 1800 ft on the west approaches due to easterly pass flow.
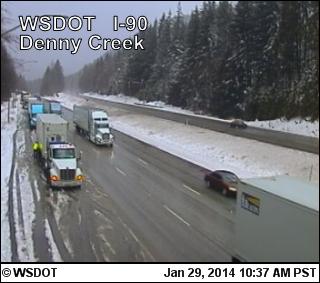
[size=small]A few inches of snow already fallen at MP 46.8, 1800 ft.[/size]
Snow levels will eventually drop to 2000 ft overnight into Thursday morning throughout the Washington and northern Oregon Cascades. Snowfall during the next 3 days through 4am Saturday is predicted to be an additional 2-4 ft over the west slopes and volcanic peaks of the Washington and Oregon Cascades, plus portions of the high Sierra Nevada:
One significant change compared to 24 hours ago is that the splitting flow is now shown to be missing northernmost California almost completely, leaving the California Cascades including Mount Shasta and Lassen Peak with only a few inches. This is not good at all, for although the snowpack situation in the Sierra is dire (10-20% of normal), it is even worse than that in the Trinity Alps and California Cascades (about 0-5% of normal). On Shasta and Lassen there is almost no snow at all, easily an all-time record low for this date over the period of record which extends back to 1930 on both mountains.
Higher resolution version of that, zoomed in on WA and OR:
Maximum amounts of 3-4 ft (marked by bright yellow) are shown on Mounts Rainier, Saint Helens, Hood, and Jefferson, plus the Blue Mountains along the eastern WA-OR border and the crest of the Sierra Nevada south of Tahoe near Yosemite.
This loop shows how the model predictions for snowfall during the 3-day period through 4am Saturday have evolved between 10 subsequent runs over the last 5 days, known in the jargon as D(model)/D(t). Lots of changes in the details especially a few days ago, but fairly consistent in the overall picture:
www.atmos.washington.edu/~ovens/wxloop.c...2+v2014020112///+-st
Details beyond the 3-4 day period still remain uncertain, but little additional snowfall is expected after Friday throughout the weekend. The ridge of high pressure is likely to rebuild northward during the weekend and early next week, but well offshore in the Pacific, leaving the Northwest under a mixed bag of partly cloudy weather while California and southern Oregon become mostly sunny once again.
A day later, and 2 subsequent runs of the UW WRF-GFS model at 12-hour intervals continue to show similar predictions for large snowfall amounts. Consistency between subsequent model runs typically tends to indicate that the predictions are more likely to actually verify.
The first round of significant precipitation moved in on Tuesday evening as predicted. As of Wednesday morning, about 1-1.5" of precip has already fallen along the west slopes and crest of the Washington Cascades from about Stevens Pass southward, with less in the Olympics (< 1") and far less in the North Cascades (generally < 0.4"). Much more has fallen farther south, with 2-3" on Mount Saint Helens, Hood, and other parts of the northern Oregon Cascades.
Snow levels were about 6-7000 ft during this time, so about 1-2 ft of new snow has already fallen at elevations above that. A cold front moving southward Wednesday morning is rapidly lowering snow levels to 3-4000 ft, with snowfall already extending far below Snoqualmie Pass to under 1800 ft on the west approaches due to easterly pass flow.
[size=small]A few inches of snow already fallen at MP 46.8, 1800 ft.[/size]
Snow levels will eventually drop to 2000 ft overnight into Thursday morning throughout the Washington and northern Oregon Cascades. Snowfall during the next 3 days through 4am Saturday is predicted to be an additional 2-4 ft over the west slopes and volcanic peaks of the Washington and Oregon Cascades, plus portions of the high Sierra Nevada:
One significant change compared to 24 hours ago is that the splitting flow is now shown to be missing northernmost California almost completely, leaving the California Cascades including Mount Shasta and Lassen Peak with only a few inches. This is not good at all, for although the snowpack situation in the Sierra is dire (10-20% of normal), it is even worse than that in the Trinity Alps and California Cascades (about 0-5% of normal). On Shasta and Lassen there is almost no snow at all, easily an all-time record low for this date over the period of record which extends back to 1930 on both mountains.
Higher resolution version of that, zoomed in on WA and OR:
Maximum amounts of 3-4 ft (marked by bright yellow) are shown on Mounts Rainier, Saint Helens, Hood, and Jefferson, plus the Blue Mountains along the eastern WA-OR border and the crest of the Sierra Nevada south of Tahoe near Yosemite.
This loop shows how the model predictions for snowfall during the 3-day period through 4am Saturday have evolved between 10 subsequent runs over the last 5 days, known in the jargon as D(model)/D(t). Lots of changes in the details especially a few days ago, but fairly consistent in the overall picture:
www.atmos.washington.edu/~ovens/wxloop.c...2+v2014020112///+-st
Details beyond the 3-4 day period still remain uncertain, but little additional snowfall is expected after Friday throughout the weekend. The ridge of high pressure is likely to rebuild northward during the weekend and early next week, but well offshore in the Pacific, leaving the Northwest under a mixed bag of partly cloudy weather while California and southern Oregon become mostly sunny once again.
Please Log in or Create an account to join the conversation.
- spresho
-
- User
-
Less
More
- Posts: 32
- Thank you received: 0
12 years 2 months ago #220039
by spresho
I am familiar with the info on that Daltonize site, but I have never heard of the bookmarklets. Thanks to you for pointing them out. I already have ruled out the tritanope, and am leaning toward the deuteranope. I will need to play with them a bit more to figure out between the deuter and the proto before I settle on one.
My sincerest apologies to Amar for hijacking his good news thread. Your analysis is greatly appreciated.
Replied by spresho on topic Re: Another major storm brings 2-5 ft snow this week?
For sure.
I'm not colorblind, but one of my advisors is, so I'm used to plotting in blue/yellow. The scales on these plots are fairly colorblind-friendly, but the topography's not, making it impossible to follow the gradient. In some of these plots, the Olympics are a different red/green than the Cascades.
Have you seen the browser Daltonizer tools? There's a Chrome extension (didn't try it), and some javascript bookmarklets that Daltonize TAY/these plots.
The latter one should work on most browsers, and has a big effect on the color spectrum displayed. Perhaps one of the tools might work for you? Do they work?
The simulators can be enlightening for the non-colorblind; they changed my understanding of colorblindness the first time I used them on my own plots. I find that a plot that's clear for my advisor is clearer for everyone else, too.
To get a sense of what spresho is talking about, try the "Protanope" simulator on the bookmarklet page against the TAY plots. It's an impressive effect in this case.
I am familiar with the info on that Daltonize site, but I have never heard of the bookmarklets. Thanks to you for pointing them out. I already have ruled out the tritanope, and am leaning toward the deuteranope. I will need to play with them a bit more to figure out between the deuter and the proto before I settle on one.
My sincerest apologies to Amar for hijacking his good news thread. Your analysis is greatly appreciated.
Please Log in or Create an account to join the conversation.