- Posts: 635
- Thank you received: 0
Lyman Lake SNOTEL hits 100" snowdepth!?! 05Jan2015
- Amar Andalkar
- [andalkar]
-
 Topic Author
- Offline
- Premium Member
-

Less
More
05 Jan 2015 16:46 - 19 Jan 2015 10:31 #223452
by Amar Andalkar
Lyman Lake SNOTEL hits 100" snowdepth!?! 05Jan2015 was created by Amar Andalkar
Well, it almost hit 100"! I was really hoping last night and this morning that it would make it, but even once it was clear that it would fall just short, I decided to go ahead and write this up. So here goes another snowdepth thread, see also last month's thread:
Lassen Peak CA reaches 100" snowdepth!! 17Dec2014
UPDATE 18Jan2015: Well, today Lyman Lake SNOTEL really did break 100" easily, and it once again has the greatest snowdepth of any SNOTEL site in the country. See more details and plots in Reply #13 below .
I'm still actively looking for positive snowpack news amid all the gloom and rain and negativity thus far this season, so here it is: Despite the slow start to the season, as of this morning the Pacific Northwest had the deepest snowpack at any measurement site in the country! (And even before that, ski conditions were good-to-great during last week's sunshine at many locations in the WA Cascades, with stable powder on northerly aspects and even proto-corn on steeper southerly aspects by New Year's Day!)
Following over 20" of new snowfall since Sunday morning, the Lyman Lake SNOTEL site at 5980 ft in the North Cascades near Holden reached 99" of snowdepth for several hours this morning. This is now the deepest snowpack at any measurement site in Washington and Oregon, and was also (almost certainly, unless I really missed something someplace) for a few hours the deepest of any measurement site in North America:
Lyman Lake (606)
Washington SNOTEL Site - 5980 ft
Snow Precip
Water Snow since Air
Date / Time Equiv Depth Oct 1 Temp
(PST) (in) (in) (in) (°F)
2015-01-04 00:00 22.3 80 37.1 24
2015-01-04 01:00 22.3 80 36.1 23
2015-01-04 02:00 22.3 80 36.2 23
2015-01-04 03:00 22.3 80 36.1 24
2015-01-04 04:00 22.3 80 36.2 24
2015-01-04 05:00 22.3 80 36.2 24
2015-01-04 06:00 22.3 80 36.2 24
2015-01-04 07:00 22.3 79 36.1 22
2015-01-04 08:00 22.3 80 36.2 23
2015-01-04 09:00 22.3 80 36.0 24
2015-01-04 10:00 22.4 80 36.1 24
2015-01-04 11:00 22.4 80 36.2 24
2015-01-04 12:00 22.4 80 36.2 24
2015-01-04 13:00 22.5 80 36.2 24
2015-01-04 14:00 22.6 81 36.1 23
2015-01-04 15:00 22.7 82 36.2 30
2015-01-04 16:00 22.8 81 36.3 32
2015-01-04 17:00 22.9 83 36.3 33
2015-01-04 18:00 23.1 84 36.4 33
2015-01-04 19:00 23.3 84 36.4 33
2015-01-04 20:00 23.5 86 37.4 33
2015-01-04 21:00 23.6 87 37.5 34
2015-01-04 22:00 23.8 90 37.6 34
2015-01-04 23:00 24.0 91 37.7 34
2015-01-05 00:00 24.2 92 37.7 34
2015-01-05 01:00 24.4 95 37.8 34
2015-01-05 02:00 24.6 94 37.9 34
2015-01-05 03:00 24.7 96 38.2 34
2015-01-05 04:00 24.8 94 38.3 34
2015-01-05 05:00 24.9 98 38.4 34
2015-01-05 06:00 24.9 96 38.5 34
2015-01-05 07:00 25.1 98 38.6 34
2015-01-05 08:00 25.2 97 38.7 34
2015-01-05 09:00 25.3 99 38.7 34
2015-01-05 10:00 25.5 99 39.0 35
2015-01-05 11:00 25.6 99 39.2 35
2015-01-05 12:00 25.6 98 39.4 35
2015-01-05 13:00 25.7 98 39.5 35
2015-01-05 14:00 25.7 98 39.6 36
2015-01-05 15:00 25.7 98 39.6 36
Its closest competitors in the Cascades are the California Cooperative Snow Surveys telemetry site on Lassen Peak at 8250 ft near Lake Helen which has settled to about 90" from its maximum of about 110" in late December, followed by the Brown Top (5830 ft) and Harts Pass (6490 ft) SNOTEL sites in the North Cascades, both of which have reached 86" today with about 20" of new snow since yesterday. Although Harts Pass had been leading all WA and OR sites in snowdepth as of mid-December, Lyman Lake passed it around Christmas and has never trailed since. In the Rockies, the Moss Peak SNOTEL (6780 ft) in Montana has reached 98" following about 18" new the past 2 days, while the Grand Targhee SNOTEL (9260 ft) in Wyoming has 86" now with also about 18" new the past 2 days. UPDATE since this post was written: Moss Peak SNOTEL reached 100" for a couple of hours late Monday afternoon. But the Noisy Basin SNOTEL (6040 ft) in Montana, which has a 3-hour data interval and which I had missed earlier, not only reached but surpassed that mark, with 100" at noon and 104" as of 6pm, so it appears to have the deepest snowpack of any SNOTEL site since noon today. About 3 ft of new snow has fallen at that site in the past 2 days, increasing the snowdepth from 75" to 104".
The Lyman Lake SNOTEL site is one of the original SNOTEL sites installed when the network was first launched during the summer and fall of 1978, one of 7 sites installed in Washington state that year (29 sites were installed in Oregon that year, and almost 200 sites throughout the western states). Here are reverse-chronological listings of all SNOTEL sites in Washington , Oregon , and also in all states , which provide a nice perspective on the development of the network. Interestingly, Washington's SNOTEL network has been expanded greatly over the past 2 decades, with over half of the 75 active sites installed since 1990 and over 1/3 of them since 2000. In contrast, almost all of Oregon's 81 sites were installed before 1981, with no further sites installed until 1997 and only a dozen new sites added since then.
Although the Lyman Lake SNOTEL site was installed in the late summer of 1978, only temperature, precip, and snow-water-equivalent were initially available (and there appears to have been a data outage for the entire first winter too). A snowdepth sensor wasn't installed until September 2005, part of a very-welcome but long-overdue program to add snowdepth sensors to all older SNOTEL sites, something which really should have been done 1-2 decades earlier. Although perhaps unimportant for water-supply forecasting (the original and still-main purpose of the entire SNOTEL network), the snowdepth is important for a wide range of other uses (recreation, avalanche forecasting, etc.), and it provides an important cross-check on the often-flaky SWE data, especially during and after major snowfall events.
The site is located in sloping open forest northwest of the (lowest) 5598 ft Lyman Lake, just off the Railroad Creek Trail below Cloudy Pass, barely 1/2 mile east of the Cascade Crest and about 6 miles west of Holden. Here's a satellite-topo overlay map centered on the site location and a summertime site picture from the NRCS website :
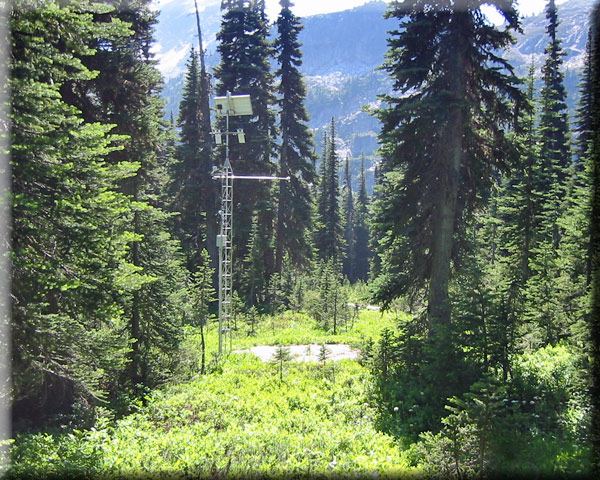
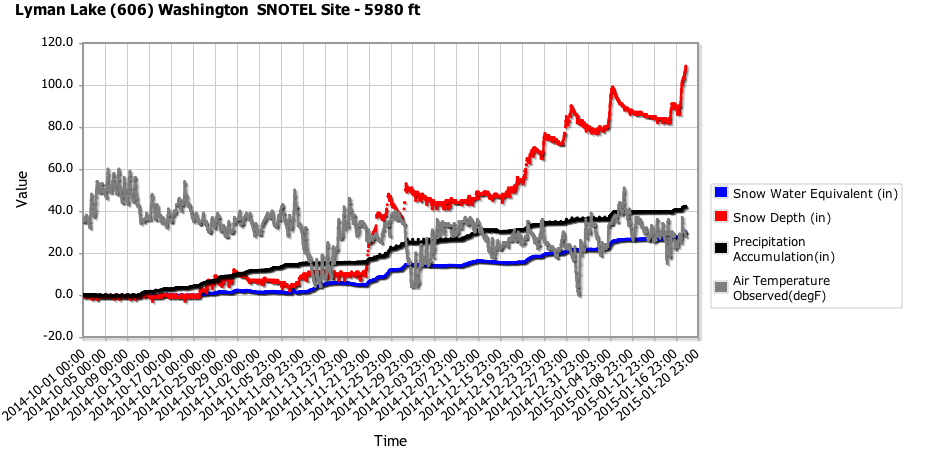
A monthly manual snow course site is also located nearby, with snow depth and snow water data extending back to 1928 , although generally only for the 1st of February, March, and April, with very spotty data collection in recent decades. The Lyman Lake site has fairly large snowdepths, with an average March 1 and April 1 snowdepth of about 140" and record depths of over 220" in late March of 1972 and 1976, although these averages are still about 20% less than the highest-snowdepth sites in the Cascades such as Mount Baker Ski Area, Mount Rainier Paradise, and Lassen Peak Lake Helen. Average annual precipitation is almost 80", with average maximum snow water of about 62" by late-April, so that on-average the overwhelming majority of precip from November through April falls as snow at this site. The plot of SWE and precip for Lyman Lake SNOTEL site makes this clear:
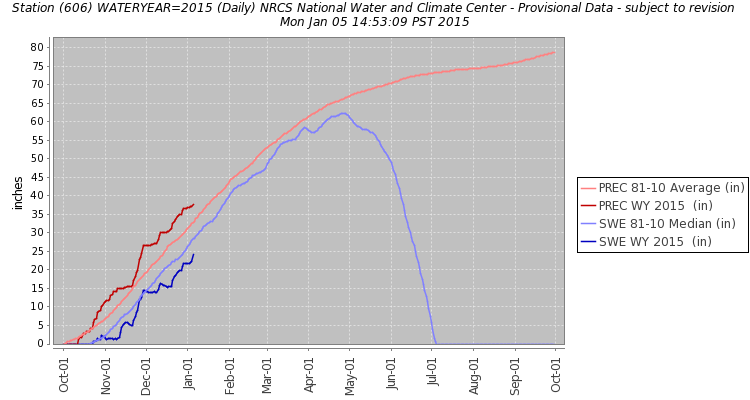
Currently the water-year precip is about 115% of normal, while SWE is about 90% of normal. As far as I can determine from extrapolation, today's snowdepth of 99" is roughly 100% of normal for this date, although there is simply not enough early-January snowdepth data to make that comparison with better than about 10% accuracy.
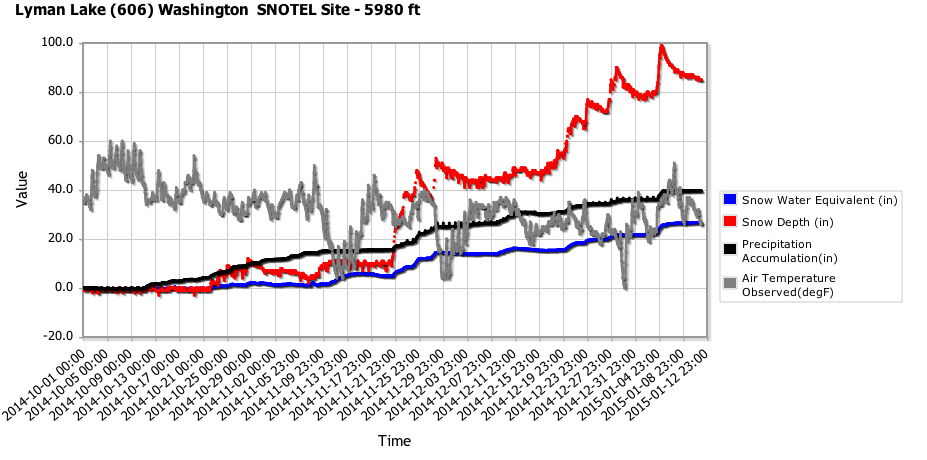
Here is a plot of snowdepth, snow water, precip, and temperature since the start of the water year on October 1, made using the NRCS Report Generator (this plot was added 1 week after the initial post, so it nicely shows the snowpack settling after hitting 99"):
Sites at higher elevations in the eastern North Cascades continue to have the best snowpack in the Pacific Northwest both in absolute terms and as a percent of normal, with several other sites also being fairly close to normal snowpack. How's the overall Northwest snowpack doing? Certainly much better than it was as of mid-December. The current January 1 CLISNO report from NWAC ( current and older reports are archived here ) shows snowdepths still below-normal, but vastly improved from the the bleak situation of December 15 which had record or near-record lows at several sites. Current values are not even close to record lows at any site:
CLIMATOLOGICAL SNOWDEPTH INFORMATION
NORTHWEST AVALANCHE CENTER SEATTLE WASHINGTON
DAY 1 MONTH 1 YEAR 2015
DATA IN INCHES, -99 DENOTES MISSING DATA
CURRENT CLIMATE PER CENT LAST THRU 2014 THRU 2014
DEPTH AVERAGE OF NORMAL YEAR MAX/YEAR MIN/YEAR
HURRICANE 22 58 38 13 97/2013 11/1981
MT BAKER 43 89 48 51 190/1949 1/1928
STEVENS 33 62 53 32 117/1956 10/1981
SNOQUALMIE 22 53 42 14 136/1949 0/1981
STAMPEDE -99 57 -99 10 132/1949 0/1981
MISSION 21 31 68 12 56/1997 6/1976
CRYSTAL 23 43 53 11 72/2007 5/1981
PARADISE 63 91 69 54 163/1969 20/1977
WHITE PASS 15 36 42 2 84/1997 2/2014
TIMBERLINE 49 80 61 29 173/1985 8/1977
MEADOWS 41 71 58 24 145/1985 6/1981
CLIMATOLOGICAL SNOWDEPTH INFORMATION
NORTHWEST AVALANCHE CENTER SEATTLE WASHINGTON
DAY 15 MONTH 12 YEAR 2014
DATA IN INCHES, -99 DENOTES MISSING DATA
CURRENT CLIMATE PER CENT LAST THRU 2013 THRU 2013
DEPTH AVERAGE OF NORMAL YEAR MAX/YEAR MIN/YEAR
HURRICANE 4 48 8 10 83/2006 10/2013
MT BAKER 6 68 9 43 168/1948 16/1976
STEVENS 11 44 25 26 80/1973 5/1976
SNOQUALMIE 6 36 17 9 116/1948 0/1976
STAMPEDE -99 42 -99 10 119/1948 9/1976
MISSION 2 23 9 14 49/2006 4/1975
CRYSTAL 2 34 6 9 72/1996 9/2013
PARADISE 22 68 32 42 170/1948 4/1976
WHITE PASS 0 28 0 4 73/1996 2/1989
TIMBERLINE 11 63 17 27 145/1984 0/1976
MEADOWS 2 54 4 24 118/1984 8/1989
THIS TABLE PRODUCED ON THE 1ST AND 15TH BETWEEN 15 NOVEMBER AND 1 MAY.
AVERAGES, MAXIMUMS AND MINIMUMS EARLY AND LATE IN THE SEASON MAY BE
INACCURATE DUE TO LIMITED DATA.
IF THERE IS TIE FOR THE MAXIMUM OR MINIMUM SNOW DEPTH THEN THE LATEST
YEAR IS INDICATED.
RECORDS BEGIN: HURRICANE 1979, MT BAKER 1926, STEVENS 1939,
SNOQUALMIE 1929, STAMPEDE 1943, MISSION RIDGE 1970,
CRYSTAL 1967, PARADISE 1926, WHITE PASS 1976,
TIMBERLINE 1973, MT HOOD MEADOWS 1974.
NOTE: NRCS DATA USED AT STAMPEDE STARTING 2006-2007 SEASON.
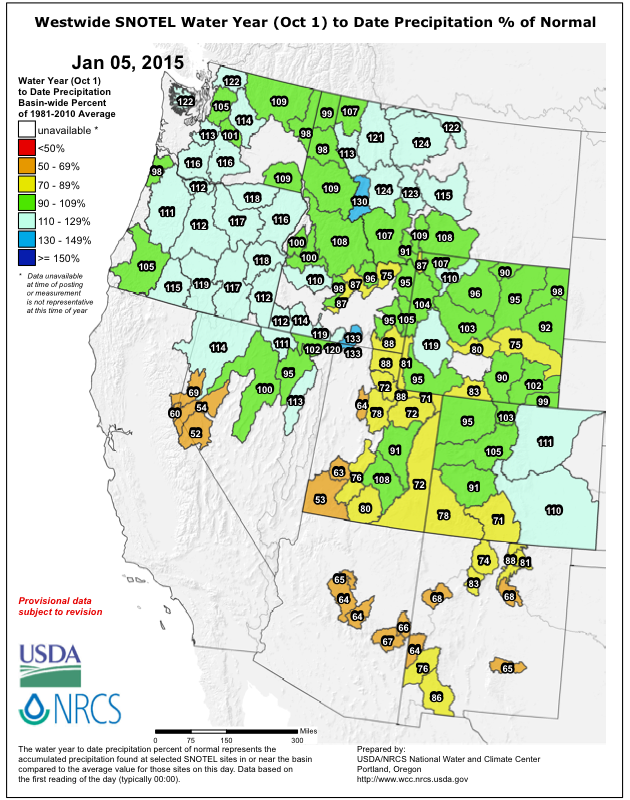
Here is a view of snowpack conditions from the SNOTEL network throughout the west, except most of California which has a separate state-run network. Current snowpack (snow water equivalent) as a percent of normal is much improved from mid-December but still below-normal in the Northwest:
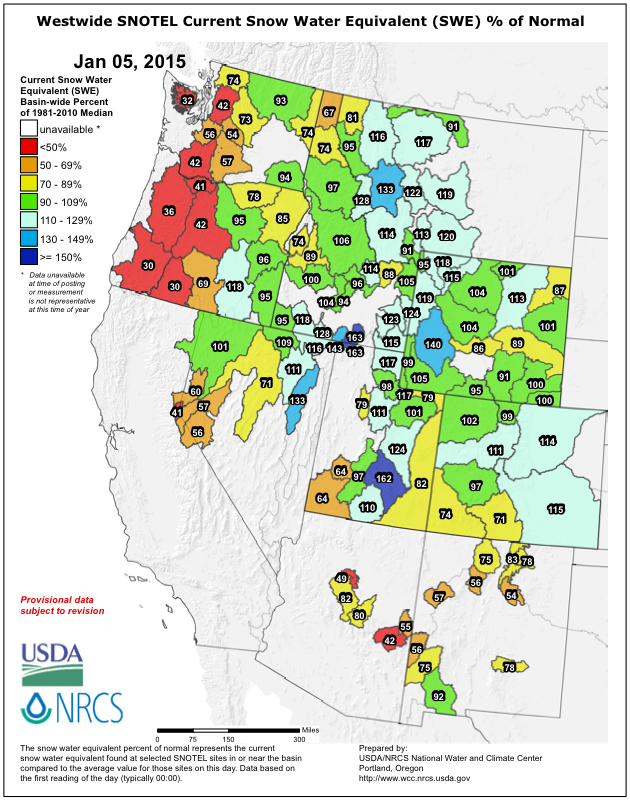
Water year to date precipitation (since Oct 1) as a percent of normal, which in sharp contrast to SWE remains above normal throughout the Northwest, just as it was in December:
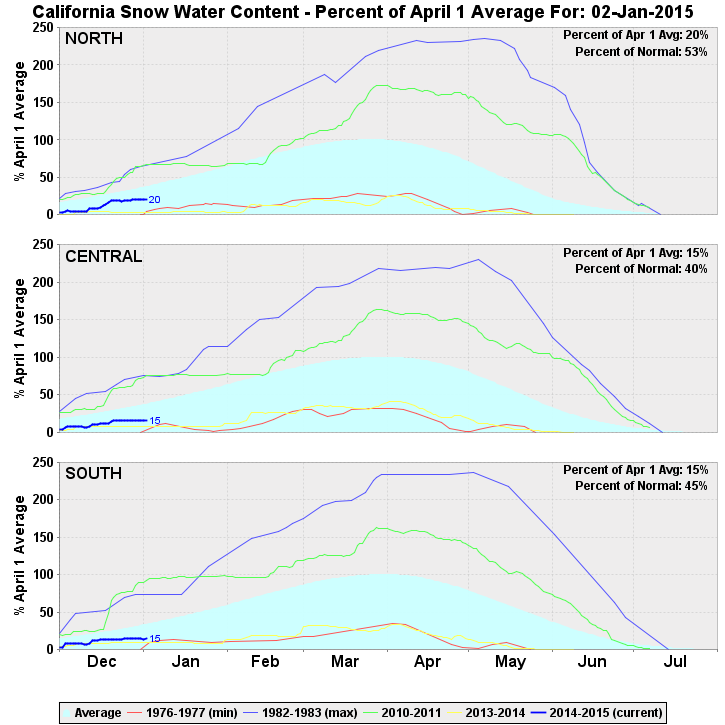
Meanwhile in California, the fairly-promising early season has faded out recently, with very little additional snowfall in the past 2 weeks (except for a relatively major storm in the SoCal mountains just before New Year's, but there are no snow telemetry sites in the SoCal mountains). In the California Cascades, snowdepths at the higher-elevation sites on Shasta and Lassen still remain near-normal, although now heading slightly-below, and nowhere near 150% of normal like a few weeks ago. At lower elevation sites in the California Cascades and almost all sites in the Sierra Nevada, the snowpack is now well below-normal, ranging from 50% of normal for this date in the north to 40-45% farther south. Definitely not what they were hoping for after 3 years of intense drought, although still much better than last year's nightmare (the yellow line in these plots):
Unfortunately, there's nothing very promising predicted for the first half of January by the NWS 6-10 and 8-14 Day Outlooks , with temperatures expected to be well above-normal and precip below-normal, so the snowpack will continue to remain well below-normal in Washington, Oregon, and California for at least a while longer. At least for California, precip is expected to be above-normal over the next 3 months, so there is strong hope for continued improvement in drought conditions (and mountain snowpack) down there.
Lassen Peak CA reaches 100" snowdepth!! 17Dec2014
UPDATE 18Jan2015: Well, today Lyman Lake SNOTEL really did break 100" easily, and it once again has the greatest snowdepth of any SNOTEL site in the country. See more details and plots in Reply #13 below .
I'm still actively looking for positive snowpack news amid all the gloom and rain and negativity thus far this season, so here it is: Despite the slow start to the season, as of this morning the Pacific Northwest had the deepest snowpack at any measurement site in the country! (And even before that, ski conditions were good-to-great during last week's sunshine at many locations in the WA Cascades, with stable powder on northerly aspects and even proto-corn on steeper southerly aspects by New Year's Day!)
Following over 20" of new snowfall since Sunday morning, the Lyman Lake SNOTEL site at 5980 ft in the North Cascades near Holden reached 99" of snowdepth for several hours this morning. This is now the deepest snowpack at any measurement site in Washington and Oregon, and was also (almost certainly, unless I really missed something someplace) for a few hours the deepest of any measurement site in North America:
Lyman Lake (606)
Washington SNOTEL Site - 5980 ft
Snow Precip
Water Snow since Air
Date / Time Equiv Depth Oct 1 Temp
(PST) (in) (in) (in) (°F)
2015-01-04 00:00 22.3 80 37.1 24
2015-01-04 01:00 22.3 80 36.1 23
2015-01-04 02:00 22.3 80 36.2 23
2015-01-04 03:00 22.3 80 36.1 24
2015-01-04 04:00 22.3 80 36.2 24
2015-01-04 05:00 22.3 80 36.2 24
2015-01-04 06:00 22.3 80 36.2 24
2015-01-04 07:00 22.3 79 36.1 22
2015-01-04 08:00 22.3 80 36.2 23
2015-01-04 09:00 22.3 80 36.0 24
2015-01-04 10:00 22.4 80 36.1 24
2015-01-04 11:00 22.4 80 36.2 24
2015-01-04 12:00 22.4 80 36.2 24
2015-01-04 13:00 22.5 80 36.2 24
2015-01-04 14:00 22.6 81 36.1 23
2015-01-04 15:00 22.7 82 36.2 30
2015-01-04 16:00 22.8 81 36.3 32
2015-01-04 17:00 22.9 83 36.3 33
2015-01-04 18:00 23.1 84 36.4 33
2015-01-04 19:00 23.3 84 36.4 33
2015-01-04 20:00 23.5 86 37.4 33
2015-01-04 21:00 23.6 87 37.5 34
2015-01-04 22:00 23.8 90 37.6 34
2015-01-04 23:00 24.0 91 37.7 34
2015-01-05 00:00 24.2 92 37.7 34
2015-01-05 01:00 24.4 95 37.8 34
2015-01-05 02:00 24.6 94 37.9 34
2015-01-05 03:00 24.7 96 38.2 34
2015-01-05 04:00 24.8 94 38.3 34
2015-01-05 05:00 24.9 98 38.4 34
2015-01-05 06:00 24.9 96 38.5 34
2015-01-05 07:00 25.1 98 38.6 34
2015-01-05 08:00 25.2 97 38.7 34
2015-01-05 09:00 25.3 99 38.7 34
2015-01-05 10:00 25.5 99 39.0 35
2015-01-05 11:00 25.6 99 39.2 35
2015-01-05 12:00 25.6 98 39.4 35
2015-01-05 13:00 25.7 98 39.5 35
2015-01-05 14:00 25.7 98 39.6 36
2015-01-05 15:00 25.7 98 39.6 36
Its closest competitors in the Cascades are the California Cooperative Snow Surveys telemetry site on Lassen Peak at 8250 ft near Lake Helen which has settled to about 90" from its maximum of about 110" in late December, followed by the Brown Top (5830 ft) and Harts Pass (6490 ft) SNOTEL sites in the North Cascades, both of which have reached 86" today with about 20" of new snow since yesterday. Although Harts Pass had been leading all WA and OR sites in snowdepth as of mid-December, Lyman Lake passed it around Christmas and has never trailed since. In the Rockies, the Moss Peak SNOTEL (6780 ft) in Montana has reached 98" following about 18" new the past 2 days, while the Grand Targhee SNOTEL (9260 ft) in Wyoming has 86" now with also about 18" new the past 2 days. UPDATE since this post was written: Moss Peak SNOTEL reached 100" for a couple of hours late Monday afternoon. But the Noisy Basin SNOTEL (6040 ft) in Montana, which has a 3-hour data interval and which I had missed earlier, not only reached but surpassed that mark, with 100" at noon and 104" as of 6pm, so it appears to have the deepest snowpack of any SNOTEL site since noon today. About 3 ft of new snow has fallen at that site in the past 2 days, increasing the snowdepth from 75" to 104".
The Lyman Lake SNOTEL site is one of the original SNOTEL sites installed when the network was first launched during the summer and fall of 1978, one of 7 sites installed in Washington state that year (29 sites were installed in Oregon that year, and almost 200 sites throughout the western states). Here are reverse-chronological listings of all SNOTEL sites in Washington , Oregon , and also in all states , which provide a nice perspective on the development of the network. Interestingly, Washington's SNOTEL network has been expanded greatly over the past 2 decades, with over half of the 75 active sites installed since 1990 and over 1/3 of them since 2000. In contrast, almost all of Oregon's 81 sites were installed before 1981, with no further sites installed until 1997 and only a dozen new sites added since then.
Although the Lyman Lake SNOTEL site was installed in the late summer of 1978, only temperature, precip, and snow-water-equivalent were initially available (and there appears to have been a data outage for the entire first winter too). A snowdepth sensor wasn't installed until September 2005, part of a very-welcome but long-overdue program to add snowdepth sensors to all older SNOTEL sites, something which really should have been done 1-2 decades earlier. Although perhaps unimportant for water-supply forecasting (the original and still-main purpose of the entire SNOTEL network), the snowdepth is important for a wide range of other uses (recreation, avalanche forecasting, etc.), and it provides an important cross-check on the often-flaky SWE data, especially during and after major snowfall events.
The site is located in sloping open forest northwest of the (lowest) 5598 ft Lyman Lake, just off the Railroad Creek Trail below Cloudy Pass, barely 1/2 mile east of the Cascade Crest and about 6 miles west of Holden. Here's a satellite-topo overlay map centered on the site location and a summertime site picture from the NRCS website :
A monthly manual snow course site is also located nearby, with snow depth and snow water data extending back to 1928 , although generally only for the 1st of February, March, and April, with very spotty data collection in recent decades. The Lyman Lake site has fairly large snowdepths, with an average March 1 and April 1 snowdepth of about 140" and record depths of over 220" in late March of 1972 and 1976, although these averages are still about 20% less than the highest-snowdepth sites in the Cascades such as Mount Baker Ski Area, Mount Rainier Paradise, and Lassen Peak Lake Helen. Average annual precipitation is almost 80", with average maximum snow water of about 62" by late-April, so that on-average the overwhelming majority of precip from November through April falls as snow at this site. The plot of SWE and precip for Lyman Lake SNOTEL site makes this clear:
Currently the water-year precip is about 115% of normal, while SWE is about 90% of normal. As far as I can determine from extrapolation, today's snowdepth of 99" is roughly 100% of normal for this date, although there is simply not enough early-January snowdepth data to make that comparison with better than about 10% accuracy.
Here is a plot of snowdepth, snow water, precip, and temperature since the start of the water year on October 1, made using the NRCS Report Generator (this plot was added 1 week after the initial post, so it nicely shows the snowpack settling after hitting 99"):
Sites at higher elevations in the eastern North Cascades continue to have the best snowpack in the Pacific Northwest both in absolute terms and as a percent of normal, with several other sites also being fairly close to normal snowpack. How's the overall Northwest snowpack doing? Certainly much better than it was as of mid-December. The current January 1 CLISNO report from NWAC ( current and older reports are archived here ) shows snowdepths still below-normal, but vastly improved from the the bleak situation of December 15 which had record or near-record lows at several sites. Current values are not even close to record lows at any site:
CLIMATOLOGICAL SNOWDEPTH INFORMATION
NORTHWEST AVALANCHE CENTER SEATTLE WASHINGTON
DAY 1 MONTH 1 YEAR 2015
DATA IN INCHES, -99 DENOTES MISSING DATA
CURRENT CLIMATE PER CENT LAST THRU 2014 THRU 2014
DEPTH AVERAGE OF NORMAL YEAR MAX/YEAR MIN/YEAR
HURRICANE 22 58 38 13 97/2013 11/1981
MT BAKER 43 89 48 51 190/1949 1/1928
STEVENS 33 62 53 32 117/1956 10/1981
SNOQUALMIE 22 53 42 14 136/1949 0/1981
STAMPEDE -99 57 -99 10 132/1949 0/1981
MISSION 21 31 68 12 56/1997 6/1976
CRYSTAL 23 43 53 11 72/2007 5/1981
PARADISE 63 91 69 54 163/1969 20/1977
WHITE PASS 15 36 42 2 84/1997 2/2014
TIMBERLINE 49 80 61 29 173/1985 8/1977
MEADOWS 41 71 58 24 145/1985 6/1981
CLIMATOLOGICAL SNOWDEPTH INFORMATION
NORTHWEST AVALANCHE CENTER SEATTLE WASHINGTON
DAY 15 MONTH 12 YEAR 2014
DATA IN INCHES, -99 DENOTES MISSING DATA
CURRENT CLIMATE PER CENT LAST THRU 2013 THRU 2013
DEPTH AVERAGE OF NORMAL YEAR MAX/YEAR MIN/YEAR
HURRICANE 4 48 8 10 83/2006 10/2013
MT BAKER 6 68 9 43 168/1948 16/1976
STEVENS 11 44 25 26 80/1973 5/1976
SNOQUALMIE 6 36 17 9 116/1948 0/1976
STAMPEDE -99 42 -99 10 119/1948 9/1976
MISSION 2 23 9 14 49/2006 4/1975
CRYSTAL 2 34 6 9 72/1996 9/2013
PARADISE 22 68 32 42 170/1948 4/1976
WHITE PASS 0 28 0 4 73/1996 2/1989
TIMBERLINE 11 63 17 27 145/1984 0/1976
MEADOWS 2 54 4 24 118/1984 8/1989
THIS TABLE PRODUCED ON THE 1ST AND 15TH BETWEEN 15 NOVEMBER AND 1 MAY.
AVERAGES, MAXIMUMS AND MINIMUMS EARLY AND LATE IN THE SEASON MAY BE
INACCURATE DUE TO LIMITED DATA.
IF THERE IS TIE FOR THE MAXIMUM OR MINIMUM SNOW DEPTH THEN THE LATEST
YEAR IS INDICATED.
RECORDS BEGIN: HURRICANE 1979, MT BAKER 1926, STEVENS 1939,
SNOQUALMIE 1929, STAMPEDE 1943, MISSION RIDGE 1970,
CRYSTAL 1967, PARADISE 1926, WHITE PASS 1976,
TIMBERLINE 1973, MT HOOD MEADOWS 1974.
NOTE: NRCS DATA USED AT STAMPEDE STARTING 2006-2007 SEASON.
Here is a view of snowpack conditions from the SNOTEL network throughout the west, except most of California which has a separate state-run network. Current snowpack (snow water equivalent) as a percent of normal is much improved from mid-December but still below-normal in the Northwest:
Water year to date precipitation (since Oct 1) as a percent of normal, which in sharp contrast to SWE remains above normal throughout the Northwest, just as it was in December:
Meanwhile in California, the fairly-promising early season has faded out recently, with very little additional snowfall in the past 2 weeks (except for a relatively major storm in the SoCal mountains just before New Year's, but there are no snow telemetry sites in the SoCal mountains). In the California Cascades, snowdepths at the higher-elevation sites on Shasta and Lassen still remain near-normal, although now heading slightly-below, and nowhere near 150% of normal like a few weeks ago. At lower elevation sites in the California Cascades and almost all sites in the Sierra Nevada, the snowpack is now well below-normal, ranging from 50% of normal for this date in the north to 40-45% farther south. Definitely not what they were hoping for after 3 years of intense drought, although still much better than last year's nightmare (the yellow line in these plots):
Unfortunately, there's nothing very promising predicted for the first half of January by the NWS 6-10 and 8-14 Day Outlooks , with temperatures expected to be well above-normal and precip below-normal, so the snowpack will continue to remain well below-normal in Washington, Oregon, and California for at least a while longer. At least for California, precip is expected to be above-normal over the next 3 months, so there is strong hope for continued improvement in drought conditions (and mountain snowpack) down there.
Please Log in or Create an account to join the conversation.
- Floater
- [Floater]
-
- Offline
- New Member
-

Less
More
- Posts: 23
- Thank you received: 0
07 Jan 2015 08:08 #223466
by Floater
Replied by Floater on topic Re: Lyman Lake SNOTEL hits 100" snowdepth!?! 05Jan2015
We can cut this data a lot of ways, but in all honesty it shows another poor year following a prior poor year. The seasons are getting shorter and the temperatures are on average slightly warmer. On average this situation is not going to get better. We will still have our good years but they will be fewer and farther in between. This January I suspect will be bleak followed maybe by some mild improvement in February and March if we are lucky. The problem is the lower elevation snowpack it will not improve. There has been an amazing change in the lower elevation snowpack compared to two three decades ago. Now it can not even be called a snowpack. Snoqualmie is the first of the major passes to see this big drop in average snowpack. You can dress up the pig, but it is still a pig. You can try and talk around it, but climate change is upon us and it is accelerating.
Please Log in or Create an account to join the conversation.
- androolus
- [androolus]
-
- Offline
- Junior Member
-

Less
More
- Posts: 102
- Thank you received: 0
07 Jan 2015 10:15 #223467
by androolus
Replied by androolus on topic Re: Lyman Lake SNOTEL hits 100" snowdepth!?! 05Jan2015
Does 20 inches of new in 4 hours with a temp of 34 degrees imply heavy wet snow or snow falling off trees?
Please Log in or Create an account to join the conversation.
- Kyle Miller
- [Kyle Miller]
-
- Offline
- Junior Member
-
Less
More
- Posts: 242
- Thank you received: 0
07 Jan 2015 11:56 #223469
by Kyle Miller
Replied by Kyle Miller on topic Re: Lyman Lake SNOTEL hits 100" snowdepth!?! 05Jan2015
The biggest convergent zone in Washington ")
The 2004-2005 season was when I really started getting into the backcountry.
The 2004-2005 season was when I really started getting into the backcountry.
Please Log in or Create an account to join the conversation.
- Charlie Hagedorn
- [trumpetsailor]
-
- Offline
- Elite Member
-

Less
More
- Posts: 913
- Thank you received: 1
07 Jan 2015 12:12 #223470
by Charlie Hagedorn
The water-equivalent data (basically the weight of the snowpack) rise so smoothly, I doubt that it's tree bombs. I didn't notice the 34F measurements on the first look; good catch!
Replied by Charlie Hagedorn on topic Re: Lyman Lake SNOTEL hits 100" snowdepth!?! 05Jan2015
Does 20 inches of new in 4 hours with a temp of 34 degrees imply heavy wet snow or snow falling off trees?
The water-equivalent data (basically the weight of the snowpack) rise so smoothly, I doubt that it's tree bombs. I didn't notice the 34F measurements on the first look; good catch!
Please Log in or Create an account to join the conversation.
- AndyMartin
- [AndyMartin]
-
- Offline
- Junior Member
-
Less
More
- Posts: 51
- Thank you received: 0
08 Jan 2015 19:57 #223500
by AndyMartin
Replied by AndyMartin on topic Re: Lyman Lake SNOTEL hits 100" snowdepth!?! 05Jan2015
Regrettably, I think Floater has it exactly right.
Please Log in or Create an account to join the conversation.
- MattT
- [MattT]
-
- Offline
- Junior Member
-
Less
More
- Posts: 62
- Thank you received: 0
09 Jan 2015 10:14 #223503
by MattT
Anecdotally I totally agree, but as a scientist I'd want to see data to back up my perception. Is my sense of things just skewed by the short time period (climatically) that my perception is based on?
Are their data sets from representative lower elevation snow stations to prove Floater correct? Amar?
Replied by MattT on topic Re: Lyman Lake SNOTEL hits 100" snowdepth!?! 05Jan2015
Regrettably, I think Floater has it exactly right.
Anecdotally I totally agree, but as a scientist I'd want to see data to back up my perception. Is my sense of things just skewed by the short time period (climatically) that my perception is based on?
Are their data sets from representative lower elevation snow stations to prove Floater correct? Amar?
Please Log in or Create an account to join the conversation.
- AndyMartin
- [AndyMartin]
-
- Offline
- Junior Member
-
Less
More
- Posts: 51
- Thank you received: 0
09 Jan 2015 18:51 #223514
by AndyMartin
Replied by AndyMartin on topic Re: Lyman Lake SNOTEL hits 100" snowdepth!?! 05Jan2015
I agree that data is needed to back up the impression of declining lower elevation snowpack. I think if there was a network of lower elevation sensors in the Cascades the results would be shocking. Still, that is just an observation after 25 years of Cascades skiing.
Please Log in or Create an account to join the conversation.
- ski_photomatt
- [ski_photomatt]
-
- Offline
- Junior Member
-
Less
More
- Posts: 141
- Thank you received: 0
10 Jan 2015 12:26 #223521
by ski_photomatt
Replied by ski_photomatt on topic Re: Lyman Lake SNOTEL hits 100" snowdepth!?! 05Jan2015
Re: data and snowpack, yes it exists and there has been a fair amount of research published by folks at the UW and other places that shows snowpacks have generally declined over time. Try searching for "Washington snowpack climate change" or similar on Google Scholar. I remember reading some nice papers by Phil Mote a few years ago, and there have likely been others published since (honestly I stopped reading them since they were so depressing, especially the modeling studies with predictions for my son's generation).
Please Log in or Create an account to join the conversation.
- Lowell_Skoog
- [Lowell_Skoog]
-
- Offline
- Platinum Member
-

Less
More
- Posts: 1460
- Thank you received: 16
11 Jan 2015 21:19 - 11 Jan 2015 22:01 #223531
by Lowell_Skoog
I don't dispute that Washington snowpack has declined, but you may be aware that there's been a fair amount of debate about the magnitude, and the debate has involved some quite knowledgeable local weather and climate people. The following article from a few years ago is interesting:
seattletimes.com/html/localnews/2003618979_warming15m.html
You can read more arguments on either side by googling "myth of vanishing cascade snowpack".
Replied by Lowell_Skoog on topic Re: Lyman Lake SNOTEL hits 100" snowdepth!?! 05Jan2015
Re: data and snowpack, yes it exists and there has been a fair amount of research published by folks at the UW and other places that shows snowpacks have generally declined over time. Try searching for "Washington snowpack climate change" or similar on Google Scholar. I remember reading some nice papers by Phil Mote a few years ago, and there have likely been others published since (honestly I stopped reading them since they were so depressing, especially the modeling studies with predictions for my son's generation).
I don't dispute that Washington snowpack has declined, but you may be aware that there's been a fair amount of debate about the magnitude, and the debate has involved some quite knowledgeable local weather and climate people. The following article from a few years ago is interesting:
seattletimes.com/html/localnews/2003618979_warming15m.html
You can read more arguments on either side by googling "myth of vanishing cascade snowpack".
Please Log in or Create an account to join the conversation.
- Amar Andalkar
- [andalkar]
-
Topic Author
- Offline
- Premium Member
-
Less
More
- Posts: 635
- Thank you received: 0
12 Jan 2015 15:42 - 12 Jan 2015 17:57 #223455
by Amar Andalkar
Well I thought a lot about this over the past week, and finally spent the last day doing a lot of data analysis to try to find the answer. The answers are indeed "shocking" to all who hold the viewpoints stated above, as these views are simply demonstrated to be totally incorrect by hard data.
And sorry Gordy (Floater), I consider you a friend, so please don't take any of this as a personal attack on you or your views on this subject. I'm just trying to find the correct answers.
The analysis is far too long to post here, so I made a new thread:
Has the low-elevation snowpack in the Washington Cascades been declining over the past 2-3 decades??
Replied by Amar Andalkar on topic Re: Lyman Lake SNOTEL hits 100" snowdepth!?! 05Jan2015
We can cut this data a lot of ways, but in all honesty it shows another poor year following a prior poor year. The seasons are getting shorter and the temperatures are on average slightly warmer. On average this situation is not going to get better. We will still have our good years but they will be fewer and farther in between. This January I suspect will be bleak followed maybe by some mild improvement in February and March if we are lucky. The problem is the lower elevation snowpack it will not improve. There has been an amazing change in the lower elevation snowpack compared to two three decades ago. Now it can not even be called a snowpack. Snoqualmie is the first of the major passes to see this big drop in average snowpack. You can dress up the pig, but it is still a pig. You can try and talk around it, but climate change is upon us and it is accelerating.
Regrettably, I think Floater has it exactly right.
Anecdotally I totally agree, but as a scientist I'd want to see data to back up my perception. Is my sense of things just skewed by the short time period (climatically) that my perception is based on?
Are their data sets from representative lower elevation snow stations to prove Floater correct? Amar?
I agree that data is needed to back up the impression of declining lower elevation snowpack. I think if there was a network of lower elevation sensors in the Cascades the results would be shocking. Still, that is just an observation after 25 years of Cascades skiing.
Re: data and snowpack, yes it exists and there has been a fair amount of research published by folks at the UW and other places that shows snowpacks have generally declined over time. Try searching for "Washington snowpack climate change" or similar on Google Scholar. I remember reading some nice papers by Phil Mote a few years ago, and there have likely been others published since (honestly I stopped reading them since they were so depressing, especially the modeling studies with predictions for my son's generation).
Well I thought a lot about this over the past week, and finally spent the last day doing a lot of data analysis to try to find the answer. The answers are indeed "shocking" to all who hold the viewpoints stated above, as these views are simply demonstrated to be totally incorrect by hard data.
And sorry Gordy (Floater), I consider you a friend, so please don't take any of this as a personal attack on you or your views on this subject. I'm just trying to find the correct answers.
The analysis is far too long to post here, so I made a new thread:
Has the low-elevation snowpack in the Washington Cascades been declining over the past 2-3 decades??
Please Log in or Create an account to join the conversation.
- john green
- [john green]
-
- Offline
- New Member
-
Less
More
- Posts: 46
- Thank you received: 0
12 Jan 2015 17:23 #223542
by john green
Replied by john green on topic Re: Lyman Lake SNOTEL hits 100" snowdepth!?! 05Jan2015
Amar, don't you realize that denying the existence of the Easter Bunny is a sure way to get your next grant request denied? The people who gave "peace" prizes to terrorists and retired VPs are practiced in strongarm tactics.
Please Log in or Create an account to join the conversation.
- ski_photomatt
- [ski_photomatt]
-
- Offline
- Junior Member
-
Less
More
- Posts: 141
- Thank you received: 0
13 Jan 2015 06:54 #223547
by ski_photomatt
Thanks for the link Lowell, I hadn't seen it. If there's one thing I've learned about science it's that unanimous opinions are extremely rare, and the best we can hope for is consensus.
Replied by ski_photomatt on topic Re: Lyman Lake SNOTEL hits 100" snowdepth!?! 05Jan2015
I don't dispute that Washington snowpack has declined, but you may be aware that there's been a fair amount of debate about the magnitude, and the debate has involved some quite knowledgeable local weather and climate people. The following article from a few years ago is interesting:
seattletimes.com/html/localnews/2003618979_warming15m.html
You can read more arguments on either side by googling "myth of vanishing cascade snowpack".
Thanks for the link Lowell, I hadn't seen it. If there's one thing I've learned about science it's that unanimous opinions are extremely rare, and the best we can hope for is consensus.
Please Log in or Create an account to join the conversation.
- Amar Andalkar
- [andalkar]
-
Topic Author
- Offline
- Premium Member
-
Less
More
- Posts: 635
- Thank you received: 0
18 Jan 2015 11:47 - 19 Jan 2015 08:03 #223598
by Amar Andalkar
Replied by Amar Andalkar on topic Re: Lyman Lake SNOTEL hits 100" snowdepth!?! 05Jan2015
UPDATE 18Jan2015: Well, today Lyman Lake SNOTEL really did break 100" easily, and it once again has the greatest snowdepth of any SNOTEL site in the country, and probably the greatest snowdepth of any measurement site in North America too!
Another very wet, very warm storm system (the oft-repeated pattern of the early part of the 2014-15 season in the Pacific Northwest) on Saturday-Sunday January 17-18 brought 2-5" of precip to most sites near and west of the crest throughout the Washington and northern Oregon Cascades. This was mostly in the form of torrential rain with rainfall rates exceeding 0.5" per hour (!) on Mount Hood and snow levels rising to 7000-8000 ft, with all rain and no snowfall through Sunday morning at sites such as Mount Hood Timberline (5900 ft) and Meadows (5400 ft), Mount Rainier Paradise (5400 ft), and Mount Baker Ski Area (4200 ft).
But as usual so far this season, high-elevation sites in the North Cascades especially east of the Cascade Crest were insulated from most of the warming aloft by the deep pool of colder air which typically fills Eastern Washington during winter, and instead of pouring rain, the precip remained mostly snow. The Lyman Lake SNOTEL site located just a half-mile east of the crest near Holden received about 20" of new snowfall, bringing its snowdepth up to 106" as of midday Sunday (Monday morning update 19Jan2015: now 112", with about 30" of total new snow in the past 48 hours, including the effects of settlement):
Lyman Lake (606)
Washington SNOTEL Site - 5980 ft
Snow Precip
Water Snow since Air
Date / Time Equiv Depth Oct 1 Temp
(PST) (in) (in) (in) (°F)
2015-01-17 00:00 27.5 89 40.5 23
2015-01-17 01:00 27.5 89 40.5 23
2015-01-17 02:00 27.5 90 40.5 24
2015-01-17 03:00 27.5 88 40.5 25
2015-01-17 04:00 27.5 89 40.5 24
2015-01-17 05:00 27.5 86 40.5 25
2015-01-17 06:00 27.5 87 40.5 24
2015-01-17 07:00 27.5 88 40.5 24
2015-01-17 08:00 27.5 88 40.5 23
2015-01-17 09:00 27.6 88 40.5 25
2015-01-17 10:00 27.6 87 40.5 26
2015-01-17 11:00 27.6 89 40.5 25
2015-01-17 12:00 27.6 90 40.4 26
2015-01-17 13:00 27.6 90 40.4 28
2015-01-17 14:00 27.7 90 40.4 29
2015-01-17 15:00 27.7 90 40.4 29
2015-01-17 16:00 27.7 86 40.5 28
2015-01-17 17:00 27.8 90 40.5 27
2015-01-17 18:00 27.9 90 40.5 28
2015-01-17 19:00 28.0 91 40.6 27
2015-01-17 20:00 28.1 92 40.6 28
2015-01-17 21:00 28.2 94 40.6 25
2015-01-17 22:00 28.4 97 40.6 25
2015-01-17 23:00 28.5 98 40.6 26
2015-01-18 00:00 28.7 100 40.6 27
2015-01-18 01:00 28.8 101 40.6 27
2015-01-18 02:00 28.9 102 41.2 37 <<< note temp & precip
2015-01-18 03:00 29.0 102 41.7 35 <<< note temp & precip
2015-01-18 04:00 29.1 100 41.7 31
2015-01-18 05:00 29.1 102 41.7 31
2015-01-18 06:00 29.2 103 41.8 31
2015-01-18 07:00 29.3 103 41.9 31
2015-01-18 08:00 29.4 103 41.8 31
2015-01-18 09:00 29.5 104 41.9 31
2015-01-18 10:00 29.6 103 42.0 30
2015-01-18 11:00 29.6 104 42.0 30
2015-01-18 12:00 29.8 105 42.1 30
2015-01-18 13:00 29.9 106 42.2 30
2015-01-18 15:00 30.0 107 42.2 30
2015-01-18 16:00 30.0 107 42.2 29
2015-01-18 17:00 30.1 108 42.2 28
2015-01-18 18:00 30.2 109 42.2 28
2015-01-18 19:00 30.3 109 42.2 28
2015-01-18 20:00 30.3 109 42.2 28
2015-01-18 21:00 30.3 109 42.3 28
2015-01-18 22:00 30.4 109 42.3 28
2015-01-18 23:00 30.5 110 42.2 28
2015-01-19 00:00 30.6 110 42.3 28
2015-01-19 01:00 30.6 42.3 28
2015-01-19 02:00 30.6 109 42.3 28
2015-01-19 03:00 30.6 111 42.3 28
2015-01-19 04:00 30.6 109 42.3 28
2015-01-19 05:00 30.6 110 42.3 28
2015-01-19 06:00 30.6 110 42.3 27
2015-01-19 07:00 30.8 112 42.3 27
The temperature did briefly spike well above freezing at 2-3am, but then quickly dropped back below freezing, and the brief rain was not enough to compact the new snow too much. Interestingly, the precip totals shot up suddenly during the 2 warm hours, due to the melting of a plug of new snow stuck in the top of the unheated precip gauge -- a typical issue on SNOTEL sites, which have a storage-type precip gauge consisting of a tall cylinder partially filled with antifreeze, with a pressure sensor at the bottom recording the depth of the water-antifreeze mixture, and a calibration equation to calculate the displayed precip total. This is very different than the heated tipping-bucket precip gauge used at NWAC sites, which records 0.01" every time its little cup fills with melted precip and tips back and forth. Note also that the increase in SWE is still greater than the recorded precip even after the frozen plug melted, a combination of undercatch by the precip gauge during windy snowfall (the Alter wind screen atop the gauge helps in this regard, but is not nearly 100% effective) and possibly some unmelted snow still stuck near the top of the gauge.
Even though it's located right on the Cascade Crest, Stevens Pass lucked out this time with strong easterly pass flow protecting it the same way, with 16" of new snow by 2am Sunday. Then the winds reversed to southwesterly by 3am, the temperature spiked by 6 °F, and the snow changed to rain:
Northwest Avalanche Center
Stevens Pass Ski Area Brooks Chair (4850')
Washington Department of Transportation Schmidt Haus (3950')
Stevens Pass, Washington
MM/DD Hour Temp Temp RH RH Wind Wind Wind Hour Total 24 Hr Total Press
PST F F % % Avg Max Dir Prec Prec Snow Snow mb
4850' 3950' 4850' 3950' 4850' 4850' 4850' 3950' 3950' 3950' 3950' 3950'
1 17 1000 25 28 100 90 9 15 62 0 0 0 35 1015
1 17 1100 25 28 100 91 9 16 50 .02 .02 0 35 1014
1 17 1200 25 28 100 94 7 15 46 .1 .12 2 36 1013
1 17 1300 25 27 100 94 8 17 38 .09 .21 2 37 1012
1 17 1400 25 28 100 95 8 15 39 .1 .31 3 37 1011
1 17 1500 26 28 100 95 9 19 39 .09 .4 4 37 1011
1 17 1600 25 27 100 95 7 15 46 .11 .51 4 39 1011
1 17 1700 25 28 100 95 7 14 49 .08 .59 5 40 1011
1 17 1800 25 27 100 94 9 17 46 .11 .7 6 41 1010
1 17 1900 25 27 100 95 8 17 46 .11 .81 7 42 1010
1 17 2000 25 27 100 95 8 17 51 .19 1 9 43 1009
1 17 2100 25 27 100 96 10 19 41 .15 1.15 11 44 1008
1 17 2200 25 27 100 95 10 18 46 .19 1.34 12 46 1007
1 17 2300 25 27 100 94 9 18 53 .16 1.5 14 48 1007
1 18 0 24 27 100 94 9 18 55 .17 1.67 16 49 1006
1 18 100 26 28 100 94 8 21 47 .04 1.71 16 49 1005
1 18 200 32 29 100 96 3 15 22 .11 1.82 16 49 1005
1 18 300 33 35 99 91 11 38 241 .04 1.86 15 49 1006 <<< wind shift
1 18 400 33 34 96 93 9 26 243 .03 1.89 15 49 1007
1 18 500 32 34 93 93 11 29 242 .04 1.93 15 49 1006
1 18 600 32 35 100 93 10 36 252 .04 1.97 0 49 1006
1 18 700 32 35 100 92 13 46 247 .1 2.07 0 49 1007
1 18 800 31 34 100 93 12 27 236 .11 2.18 0 49 1009
1 18 900 31 34 100 94 11 32 230 .07 2.25 0 49 1011
Even low-elevation sites east of the crest stayed all-snow through early Sunday morning, with 9" new at the Mazama NWAC site (2170 ft), 12" new at Holden Village (3220 ft) 6 miles east of Lyman Lake, about 16" new at the Trinity SNOTEL site (2930 ft) 9 miles SSE of Lyman Lake, 15" new at the Berne NWAC site (2700 ft) east of Stevens Pass, 11" new at the Lake Wenatchee NWAC site (1930 ft), and about 15" new at the Fish Lake SNOTEL site (3430 ft) along Cle Elum River Road.
Back to Lyman Lake: Here is a plot of snowdepth, snow water, precip, and temperature since the start of the water year on October 1, made using the NRCS Report Generator , which shows it hitting 99" on January 5 and finally breaking 100" today:
Just for fun, I decided to make the same plot for each of the past 6 years at Lyman Lake, from October 1 to January 18:
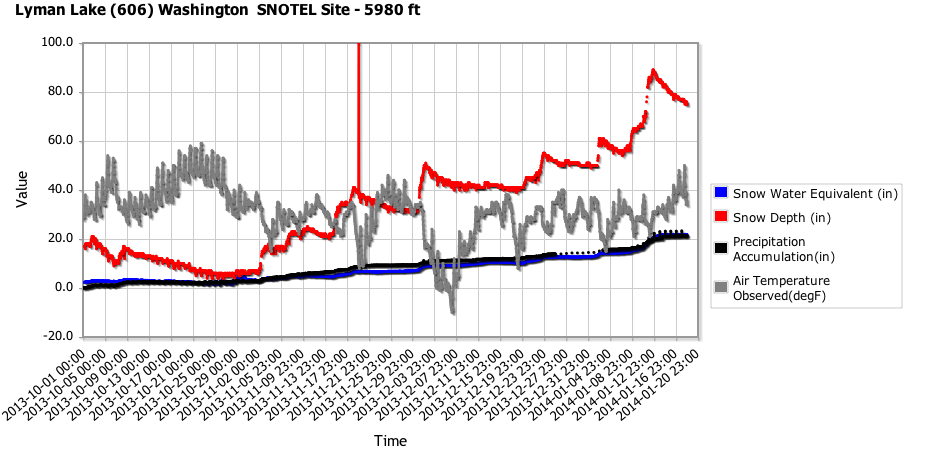
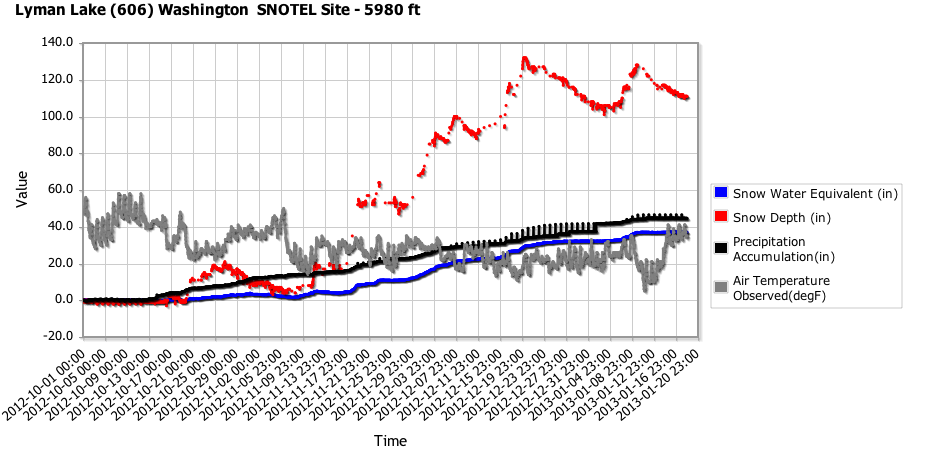
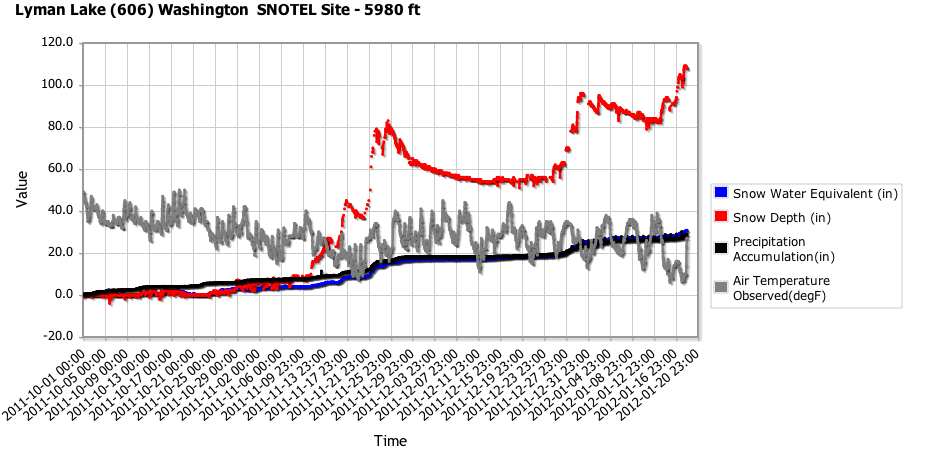
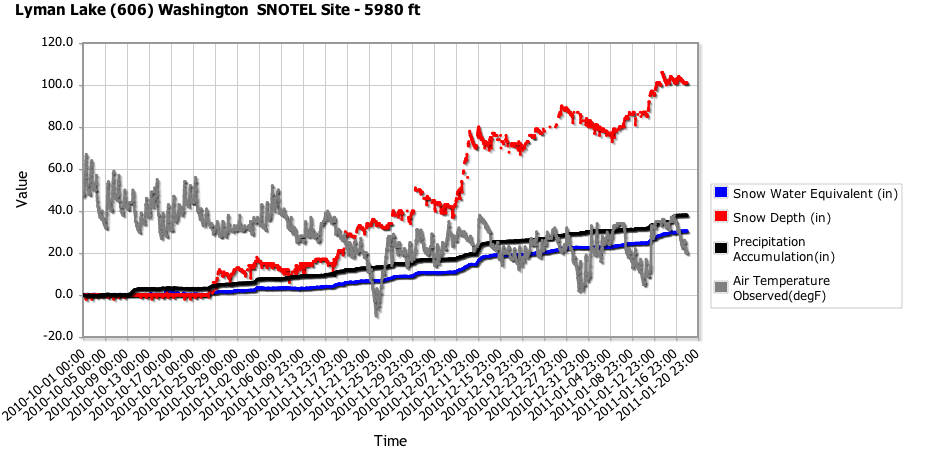
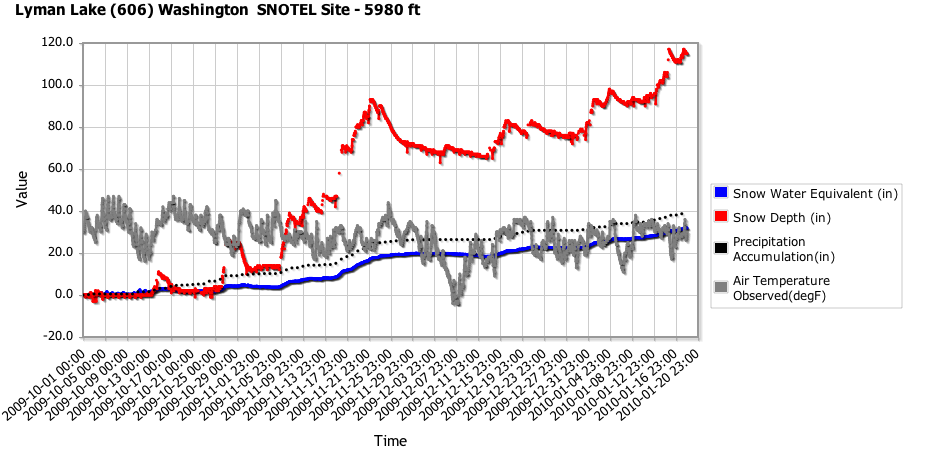
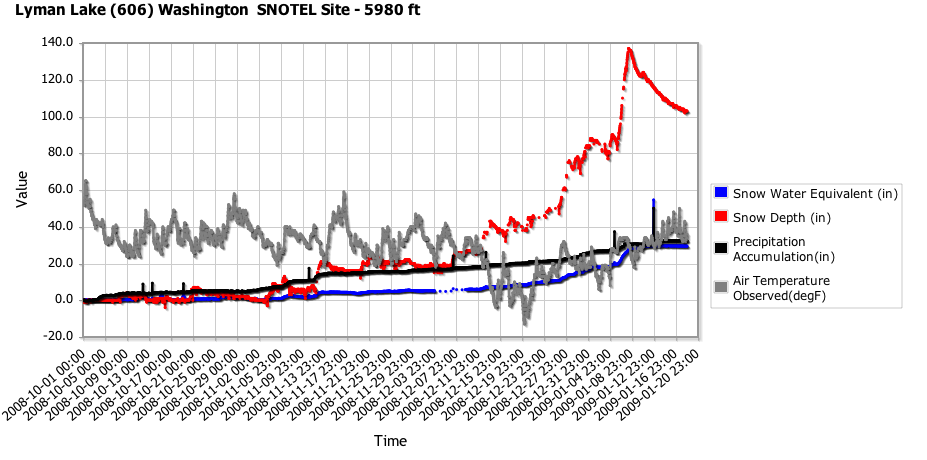
Interestingly, looking at these plots, I noticed that the snowdepth on January 18 has been almost identical within a few % of 110" for 6 of the past 7 years, with only 2014 falling well short of the others (the maximum value at any hour on January 18 is listed here):
18Jan2015: 110"
18Jan2014: 77"
18Jan2013: 112"
18Jan2012: 109"
18Jan2011: 102"
18Jan2010: 117"
18Jan2009: 104"
Ironically, the second lowest of these values is in 2011, a huge La Nina year which was far above-normal overall at almost all snow measurement sites on the entire West Coast, and ranks as one of the all-time great summer snowpacks in Pacific Northwest history, matched only by 1974 in that regard. Anyway, the point of the graphical comparison was to demonstrate that at least in some small portions of the Cascades like Lyman Lake, this year is not below-normal for snowpack at all and is in fact fairly typical.
Compared to other measurement sites in the US, Lyman Lake SNOTEL is now the clear leader in snowdepth at106" 112", with no other sites closer than 12" to it, as far as I can find at this time. Its closest competitors in the Cascades are the
Brown Top SNOTEL
(5830 ft) in the North Cascades which stayed mostly snow despite temps well above freezing and got about 14" new bringing it up to 89" on Sunday morning, along with
Harts Pass SNOTEL
(6490 ft) which was all snow with temps well below freezing, and about 10" new bringing it up to 82" on Sunday morning. The
California Cooperative Snow Surveys telemetry site on Lassen Peak
at 8250 ft near Lake Helen has settled to about 86" from its maximum of about 110" in late December (almost no new snow since December 21), which still remains the greatest snowdepth yet recorded this season at any site. Lyman Lake should easily pass that over the next day based on current forecasts (see below). Update 19Jan2015: Lyman Lake has passed Lassen's earlier mark with 112" as of Monday morning.
In the Rockies, the Moss Peak (6780 ft), North Fork Jocko (6330 ft), and Noisy Basin (6040 ft) SNOTEL sites in Montana all reached about 93-94" on Sunday morning after about 6-10" new overnight, while the Grand Targhee SNOTEL (9260 ft) in Wyoming had 86" on Saturday and is probably about 94" as of Sunday morning based on overnight precip and SWE increases (snowdepth temporarily out).
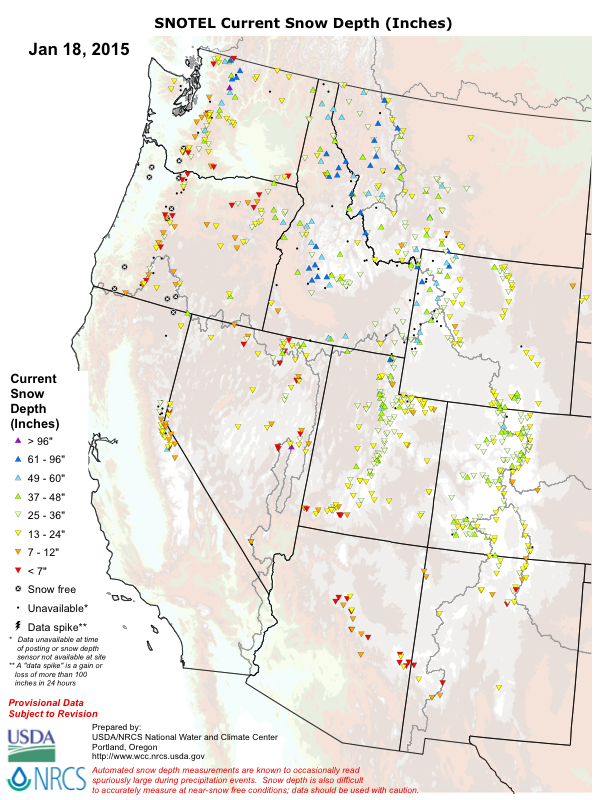
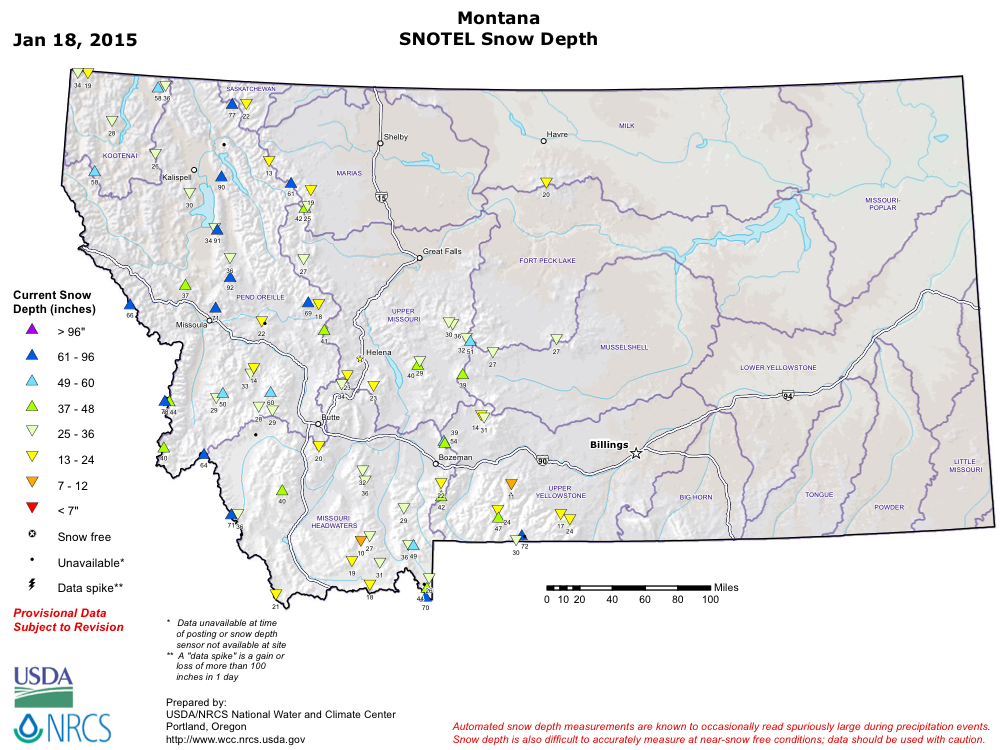
Here is an overview of current snowdepth from the SNOTEL network throughout the western US (except Alaska which is having a very poor snow year too, and most of California which has a separate state-run network):
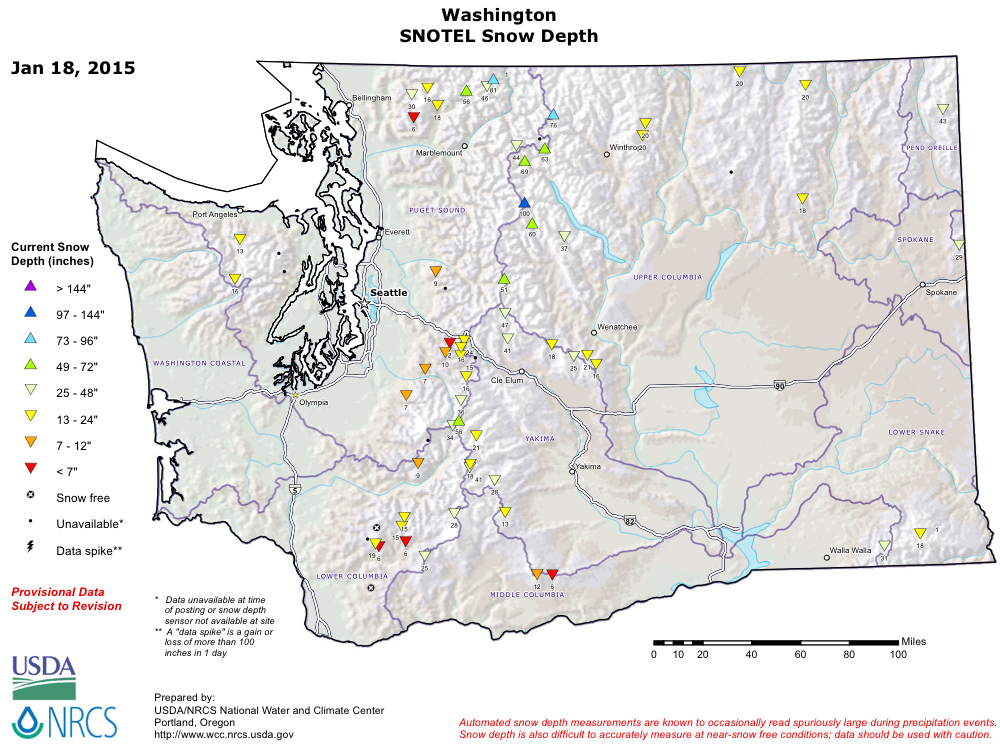
And also zoomed in on Washington and Montana to easily see the highest snowdepth sites, with values listed as of midnight January 18:
Regarding snowpack, very little has changed throughout the western US in the 2 weeks since this thread was started, although now that the cold front is passing and heavy rain is changing to snowfall, the snowpack should get a decent boost especially in Washington by late Monday. The high-resolution UW WRF-GFS model is predicting new snowfall amounts of up to 1-3 ft over the next 48 hours through 4am Tuesday for the Washington Cascades, with lesser amounts of up to 4-8" extending into the northern Oregon Cascades:
Another very wet, very warm storm system (the oft-repeated pattern of the early part of the 2014-15 season in the Pacific Northwest) on Saturday-Sunday January 17-18 brought 2-5" of precip to most sites near and west of the crest throughout the Washington and northern Oregon Cascades. This was mostly in the form of torrential rain with rainfall rates exceeding 0.5" per hour (!) on Mount Hood and snow levels rising to 7000-8000 ft, with all rain and no snowfall through Sunday morning at sites such as Mount Hood Timberline (5900 ft) and Meadows (5400 ft), Mount Rainier Paradise (5400 ft), and Mount Baker Ski Area (4200 ft).
But as usual so far this season, high-elevation sites in the North Cascades especially east of the Cascade Crest were insulated from most of the warming aloft by the deep pool of colder air which typically fills Eastern Washington during winter, and instead of pouring rain, the precip remained mostly snow. The Lyman Lake SNOTEL site located just a half-mile east of the crest near Holden received about 20" of new snowfall, bringing its snowdepth up to 106" as of midday Sunday (Monday morning update 19Jan2015: now 112", with about 30" of total new snow in the past 48 hours, including the effects of settlement):
Lyman Lake (606)
Washington SNOTEL Site - 5980 ft
Snow Precip
Water Snow since Air
Date / Time Equiv Depth Oct 1 Temp
(PST) (in) (in) (in) (°F)
2015-01-17 00:00 27.5 89 40.5 23
2015-01-17 01:00 27.5 89 40.5 23
2015-01-17 02:00 27.5 90 40.5 24
2015-01-17 03:00 27.5 88 40.5 25
2015-01-17 04:00 27.5 89 40.5 24
2015-01-17 05:00 27.5 86 40.5 25
2015-01-17 06:00 27.5 87 40.5 24
2015-01-17 07:00 27.5 88 40.5 24
2015-01-17 08:00 27.5 88 40.5 23
2015-01-17 09:00 27.6 88 40.5 25
2015-01-17 10:00 27.6 87 40.5 26
2015-01-17 11:00 27.6 89 40.5 25
2015-01-17 12:00 27.6 90 40.4 26
2015-01-17 13:00 27.6 90 40.4 28
2015-01-17 14:00 27.7 90 40.4 29
2015-01-17 15:00 27.7 90 40.4 29
2015-01-17 16:00 27.7 86 40.5 28
2015-01-17 17:00 27.8 90 40.5 27
2015-01-17 18:00 27.9 90 40.5 28
2015-01-17 19:00 28.0 91 40.6 27
2015-01-17 20:00 28.1 92 40.6 28
2015-01-17 21:00 28.2 94 40.6 25
2015-01-17 22:00 28.4 97 40.6 25
2015-01-17 23:00 28.5 98 40.6 26
2015-01-18 00:00 28.7 100 40.6 27
2015-01-18 01:00 28.8 101 40.6 27
2015-01-18 02:00 28.9 102 41.2 37 <<< note temp & precip
2015-01-18 03:00 29.0 102 41.7 35 <<< note temp & precip
2015-01-18 04:00 29.1 100 41.7 31
2015-01-18 05:00 29.1 102 41.7 31
2015-01-18 06:00 29.2 103 41.8 31
2015-01-18 07:00 29.3 103 41.9 31
2015-01-18 08:00 29.4 103 41.8 31
2015-01-18 09:00 29.5 104 41.9 31
2015-01-18 10:00 29.6 103 42.0 30
2015-01-18 11:00 29.6 104 42.0 30
2015-01-18 12:00 29.8 105 42.1 30
2015-01-18 13:00 29.9 106 42.2 30
2015-01-18 15:00 30.0 107 42.2 30
2015-01-18 16:00 30.0 107 42.2 29
2015-01-18 17:00 30.1 108 42.2 28
2015-01-18 18:00 30.2 109 42.2 28
2015-01-18 19:00 30.3 109 42.2 28
2015-01-18 20:00 30.3 109 42.2 28
2015-01-18 21:00 30.3 109 42.3 28
2015-01-18 22:00 30.4 109 42.3 28
2015-01-18 23:00 30.5 110 42.2 28
2015-01-19 00:00 30.6 110 42.3 28
2015-01-19 01:00 30.6 42.3 28
2015-01-19 02:00 30.6 109 42.3 28
2015-01-19 03:00 30.6 111 42.3 28
2015-01-19 04:00 30.6 109 42.3 28
2015-01-19 05:00 30.6 110 42.3 28
2015-01-19 06:00 30.6 110 42.3 27
2015-01-19 07:00 30.8 112 42.3 27
The temperature did briefly spike well above freezing at 2-3am, but then quickly dropped back below freezing, and the brief rain was not enough to compact the new snow too much. Interestingly, the precip totals shot up suddenly during the 2 warm hours, due to the melting of a plug of new snow stuck in the top of the unheated precip gauge -- a typical issue on SNOTEL sites, which have a storage-type precip gauge consisting of a tall cylinder partially filled with antifreeze, with a pressure sensor at the bottom recording the depth of the water-antifreeze mixture, and a calibration equation to calculate the displayed precip total. This is very different than the heated tipping-bucket precip gauge used at NWAC sites, which records 0.01" every time its little cup fills with melted precip and tips back and forth. Note also that the increase in SWE is still greater than the recorded precip even after the frozen plug melted, a combination of undercatch by the precip gauge during windy snowfall (the Alter wind screen atop the gauge helps in this regard, but is not nearly 100% effective) and possibly some unmelted snow still stuck near the top of the gauge.
Even though it's located right on the Cascade Crest, Stevens Pass lucked out this time with strong easterly pass flow protecting it the same way, with 16" of new snow by 2am Sunday. Then the winds reversed to southwesterly by 3am, the temperature spiked by 6 °F, and the snow changed to rain:
Northwest Avalanche Center
Stevens Pass Ski Area Brooks Chair (4850')
Washington Department of Transportation Schmidt Haus (3950')
Stevens Pass, Washington
MM/DD Hour Temp Temp RH RH Wind Wind Wind Hour Total 24 Hr Total Press
PST F F % % Avg Max Dir Prec Prec Snow Snow mb
4850' 3950' 4850' 3950' 4850' 4850' 4850' 3950' 3950' 3950' 3950' 3950'
1 17 1000 25 28 100 90 9 15 62 0 0 0 35 1015
1 17 1100 25 28 100 91 9 16 50 .02 .02 0 35 1014
1 17 1200 25 28 100 94 7 15 46 .1 .12 2 36 1013
1 17 1300 25 27 100 94 8 17 38 .09 .21 2 37 1012
1 17 1400 25 28 100 95 8 15 39 .1 .31 3 37 1011
1 17 1500 26 28 100 95 9 19 39 .09 .4 4 37 1011
1 17 1600 25 27 100 95 7 15 46 .11 .51 4 39 1011
1 17 1700 25 28 100 95 7 14 49 .08 .59 5 40 1011
1 17 1800 25 27 100 94 9 17 46 .11 .7 6 41 1010
1 17 1900 25 27 100 95 8 17 46 .11 .81 7 42 1010
1 17 2000 25 27 100 95 8 17 51 .19 1 9 43 1009
1 17 2100 25 27 100 96 10 19 41 .15 1.15 11 44 1008
1 17 2200 25 27 100 95 10 18 46 .19 1.34 12 46 1007
1 17 2300 25 27 100 94 9 18 53 .16 1.5 14 48 1007
1 18 0 24 27 100 94 9 18 55 .17 1.67 16 49 1006
1 18 100 26 28 100 94 8 21 47 .04 1.71 16 49 1005
1 18 200 32 29 100 96 3 15 22 .11 1.82 16 49 1005
1 18 300 33 35 99 91 11 38 241 .04 1.86 15 49 1006 <<< wind shift
1 18 400 33 34 96 93 9 26 243 .03 1.89 15 49 1007
1 18 500 32 34 93 93 11 29 242 .04 1.93 15 49 1006
1 18 600 32 35 100 93 10 36 252 .04 1.97 0 49 1006
1 18 700 32 35 100 92 13 46 247 .1 2.07 0 49 1007
1 18 800 31 34 100 93 12 27 236 .11 2.18 0 49 1009
1 18 900 31 34 100 94 11 32 230 .07 2.25 0 49 1011
Even low-elevation sites east of the crest stayed all-snow through early Sunday morning, with 9" new at the Mazama NWAC site (2170 ft), 12" new at Holden Village (3220 ft) 6 miles east of Lyman Lake, about 16" new at the Trinity SNOTEL site (2930 ft) 9 miles SSE of Lyman Lake, 15" new at the Berne NWAC site (2700 ft) east of Stevens Pass, 11" new at the Lake Wenatchee NWAC site (1930 ft), and about 15" new at the Fish Lake SNOTEL site (3430 ft) along Cle Elum River Road.
Back to Lyman Lake: Here is a plot of snowdepth, snow water, precip, and temperature since the start of the water year on October 1, made using the NRCS Report Generator , which shows it hitting 99" on January 5 and finally breaking 100" today:
Just for fun, I decided to make the same plot for each of the past 6 years at Lyman Lake, from October 1 to January 18:
Interestingly, looking at these plots, I noticed that the snowdepth on January 18 has been almost identical within a few % of 110" for 6 of the past 7 years, with only 2014 falling well short of the others (the maximum value at any hour on January 18 is listed here):
18Jan2015: 110"
18Jan2014: 77"
18Jan2013: 112"
18Jan2012: 109"
18Jan2011: 102"
18Jan2010: 117"
18Jan2009: 104"
Ironically, the second lowest of these values is in 2011, a huge La Nina year which was far above-normal overall at almost all snow measurement sites on the entire West Coast, and ranks as one of the all-time great summer snowpacks in Pacific Northwest history, matched only by 1974 in that regard. Anyway, the point of the graphical comparison was to demonstrate that at least in some small portions of the Cascades like Lyman Lake, this year is not below-normal for snowpack at all and is in fact fairly typical.
Compared to other measurement sites in the US, Lyman Lake SNOTEL is now the clear leader in snowdepth at
In the Rockies, the Moss Peak (6780 ft), North Fork Jocko (6330 ft), and Noisy Basin (6040 ft) SNOTEL sites in Montana all reached about 93-94" on Sunday morning after about 6-10" new overnight, while the Grand Targhee SNOTEL (9260 ft) in Wyoming had 86" on Saturday and is probably about 94" as of Sunday morning based on overnight precip and SWE increases (snowdepth temporarily out).
Here is an overview of current snowdepth from the SNOTEL network throughout the western US (except Alaska which is having a very poor snow year too, and most of California which has a separate state-run network):
And also zoomed in on Washington and Montana to easily see the highest snowdepth sites, with values listed as of midnight January 18:
Regarding snowpack, very little has changed throughout the western US in the 2 weeks since this thread was started, although now that the cold front is passing and heavy rain is changing to snowfall, the snowpack should get a decent boost especially in Washington by late Monday. The high-resolution UW WRF-GFS model is predicting new snowfall amounts of up to 1-3 ft over the next 48 hours through 4am Tuesday for the Washington Cascades, with lesser amounts of up to 4-8" extending into the northern Oregon Cascades:
Please Log in or Create an account to join the conversation.
- Floater
- [Floater]
-
- Offline
- New Member
-
Less
More
- Posts: 23
- Thank you received: 0
18 Jan 2015 16:35 #223602
by Floater
Replied by Floater on topic Re: Lyman Lake SNOTEL hits 100" snowdepth!?! 05Jan2015
You ever stayed here in the Winter? This might be the ticket for this season. Sadly I am not Lutheran.
www.holdenvillage.org/village-life/
www.holdenvillage.org/village-life/
Please Log in or Create an account to join the conversation.