- Posts: 635
- Thank you received: 0
Has low-elevation Cascade snowpack been declining?
- Amar Andalkar
- [andalkar]
-
 Topic Author
- Offline
- Premium Member
-

Less
More
12 Jan 2015 17:21 - 22 Jan 2015 09:17 #223539
by Amar Andalkar
Has low-elevation Cascade snowpack been declining? was created by Amar Andalkar
See the previous discussion which led to this post:
Lyman Lake SNOTEL hits 100" snowdepth!?! 05Jan2015
Has the low-elevation snowpack in the Washington Cascades been declining over the past 2-3 decades??
(What about the Oregon Cascades? Please see Reply #19 below for that analysis.)
Many long-time Northwest skiers have been making the following claims, especially early last year and once again this year, in the face of far below-normal early-season snowpacks:
* The low-elevation Cascade snowpack is declining, and declining a lot in recent years.
* They can remember a time about 2-3 decades ago with much more substantial low-elevation Cascade snowpack almost every year.
* That such persistent low-elevation snowpacks have almost vanished in recent years, except for maybe an occasional exceptional year.
Most of the backcountry skiers that I know and ski with would almost certainly agree with these claims, and some of them are the ones making such claims. But are these claims true? Are the collective memories of these skiers, recalling halcyon days of abundant low-elevation snowfall now long-gone, actually real? Has the low-elevation Cascade snowpack really vanished, never (or rarely) to be seen again in the face of global warming?
No one likes to have their memory or recollection of events brought into question. But as is well known, human memory is one of the most fallible and least reliable sources of evidence or testimony for any particular topic or investigation. It is subject to enormous bias (especially selection bias, indeed selective memory) and numerous potential sources of outright error (such as forgetting crucial details, dates, locations, etc.), mostly perhaps unintentional errors and unbeknownst to the person doing the recollection. So we need to find some hard data to either support or refute these memory-based claims.
Based on the wide range of ages of these experienced skiers making such claims (ages I would guess roughly from 40 to 60+), the period in question that we need to consider extends back only about 2-3 decades, at most 4 decades. Time periods farther back than the mid-1970s are not relevant to these claims, since the claims are not saying that the snowpack was better 50 or 60 years ago, they are really referring to much shorter periods like 2-3 decades, maybe 4. Even so, we will analyze back at least 5-6 decades or longer in order to get a more complete picture of the data and how the snowpack has changed over time.
Since this topic is absolutely about climate change and its effects (and thus sure to be controversial), I should add a disclaimer and disclosure section:
In the interest of full disclosure, I'm a scientist but not in atmospheric or climate science, a PhD physicist and a former member of the research faculty in the UW physics department for nearly 6 years. Whatever I know about snow climatology has been self taught and self learned, as atmospheric science (especially as it relates to snow) has been an intellectual hobby of mine for nearly 2 decades. Let me also state my personal views on climate change up front: I find the data and evidence in support of "global warming" (i.e. anthropogenic climate-change since the start of the Industrial Revolution) to be overwhelming and convincing -- there is no reasonable doubt that the planet is warming, there is no reasonable doubt that most glaciers worldwide are shrinking, there is no reasonable doubt that global CO2 levels are rising, and there is very little doubt that human activities are among the primary contributors to these easily observable and measurable changes.
So I'm certainly not one of those wingnut climate-change deniers, in fact politically I'm at the far left end of the spectrum and oftentimes a one-issue environmental voter. But I also have no financial or academic connection to climate science or research in that area, and thus have no hidden agenda of trying to link everything (especially negative or unpleasant things like vanishing snowpack) to climate change in order to get grant money or publish papers. If climate change is not the cause of something, I am free to say so and will say so. I do my snow climatology research purely out of my own intellectual curiosity and a strong desire to learn the real answers.
So back on topic: the globe is warming, for sure -- but does that mean that the low-elevation Cascade snowpack must be declining over the past 2-3 decades as the globe continues to warm? I spent most of Sunday and Monday doing a detailed study of all available and relevant low-elevation snowpack data from the Washington Cascades, and the results may be shocking to some. Contrary to what you may expect, the answer is . . . No! Not at all!
Frankly, I was expecting that result, but the data is really quite STUNNING, far more positive than I would have guessed: over the last 9 years, most years are actually above-normal at most low-elevation sites in the Washington Cascades! In sharp contrast, most years during the 2-decade period from 1977-1996 were below normal, often well below-normal, with only a few slightly above-normal years. In other words, the very heart of the supposedly-great old-time period of deep low-elevation snowpacks 2-3 decades ago was in fact the worst period for low-elevation snowpack (and any-elevation snowpack) in the Washington Cascades over the last 70 years! The data clearly shows this, and there is little doubt. No fancy statistics needed either, just look at the data presented below!
I'll try to explain and show the following things so that this will hopefully be very clear and make sense:
* What causes year-to-year variability in snowfall and snowpack?
* What does "low-elevation" mean in this context?
* What "low-elevation" data actually exists that is relevant to this question?
* What does that low-elevation data show about snowpack over the past 20, 30, 40 years?
First some background on Cascades snow climatology, which is essential for understanding what is going on:
Annual snowfall (the cumulative total of new snow received in a year) and snowpack (the sitting depth of snow on a specified date such as January 1 or April 1) is highly variable from year-to-year at any location in the Cascades, and also in all other mountain regions of the world, and in all lowland regions of the world which receive snowfall too. Unlike temperature (which can only vary slightly from year-to-year) and precipitation (which can vary more significantly but still within moderate limits except in desert regions), both snowfall and snowpack tend to vary wildly from year-to-year, with the variations often being greater than the average values, and largely random in nature. The year-to-year variability is greatest at lower elevations and lower latitudes and wherever annual snowfall is low, while tending to be much less in areas of very large annual snowfall, at higher elevations near treeline, or at higher latitudes such as sub-Arctic areas (in the Northern Hemisphere) or in Antarctica (in the Southern Hemisphere) even though those areas don't actually get very much snowfall relatively-speaking.
For example, in almost every city in the US or Canada which gets snowfall (outside sub-Arctic regions), the snowfall totals vary wildly from year to year, and a deep seasonal snowpack rarely develops, resulting in even greater year-to-year variability in the snowdepth on any given date than in the very-volatile snowfall numbers. Similarly at "low elevations" in mountain regions throughout the western US (low being relative and specific to each mountain region), there is extreme year-to-year variability, with stable snowpacks and some degree of predictability only above certain threshold elevations.
At elevations below about 1500-2000 ft in the Washington Cascades, there is simply too much year-to-year variability in snowfall and snowpack to make any sense of the data. It is dominated by random variation and is not correlated or correlatable to anything, and is thus not useful for this purpose or most others. In addition, due to this extreme variability, snowfall and snowdepth data is not generally collected in these very low elevation areas, except in towns or other areas with established populations.
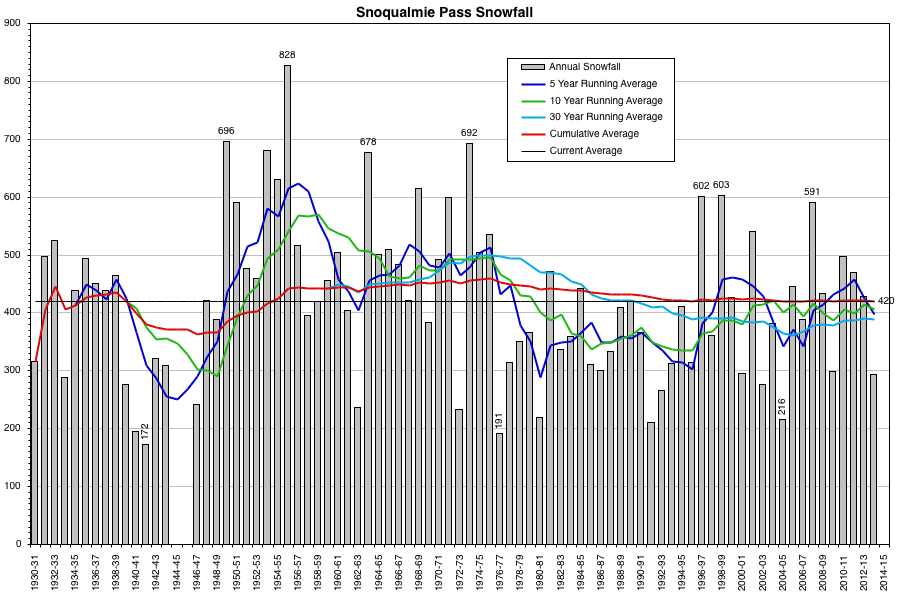
So that sets a lower limit on what we can analyze, which actually corresponds nicely to what skiers think of as "low-elevation" here, the lower limit of skiable terrain. Therefore we'll consider data from about 1500-3500 ft as low-elevation. Our low-elevation range thus includes Snoqualmie Pass (3000 ft) as it really must, while excluding all other Cascade Crest passes. In general, 3500-5500 ft would be considered mid-elevation for snowfall data in the Washington Cascades, while 5500-7000 ft are the highest elevations at which such data is available. The corresponding elevation bands in the Oregon Cascades are about 1000 ft higher, and 2000 ft higher in the California Cascades, although this analysis will be limited to the Washington Cascades only at this point (due to time constraints).
In the Cascades, year-to-year snowfall and snowpack variability increases substantially as one moves south along the nearly 800-mile length of the range from southwestern BC to northern California, and increases even more as one continues further south along the nearly 400-mile extension of the Sierra Nevada. These annual variations are fairly well-correlated to 2 major ocean-atmosphere cycles which affect sea-surface temperatures in the Pacific Ocean: the El Nino Southern Oscillation (ENSO), which has a timescale of a few years, and the Pacific Decadal Oscillation (PDO), with a timescale of a few decades. The ENSO cycle is very well studied and is definitely not periodic, nor is it predictable years in advance, and the PDO appears to share those 2 characteristics, although it is much less well studied. Its roughly 10-times longer timescale makes determining periodicity or predictability all but impossible given that barely a couple of PDO cycles have been observed over the past century of scientific data.
Snowfall and snowpack in the Cascades has a very strong positive correlation to the cool phase of ENSO (La Nina), a correlation which extends throughout the entire range from north to south and at all elevations, and even extends (more weakly positive) into the Sierra Nevada. In contrast, the warm phase of ENSO (El Nino) has much more complicated correlations, being very strongly positive for snowfall and snowpack (and precip) in the Sierra Nevada and California Cascades, but weakly negative for snowfall and snowpack in the Washington and Oregon Cascades (more strongly negative at low elevations), and again somewhat positive in southwestern BC especially at higher elevations. See my Cascade ENSO Snowfall webpage, which was created a decade ago and was the first comprehensive analysis of ENSO effects in the Cascades at elevations relevant for skiing and ski mountaineering, for more details about these correlations.
As for the PDO, I know of no similar study, but the correlations appear to be fairly obvious in this case, especially for the Cascades and southern BC: the cool phase of the PDO corresponds to 1-3 decade-long periods of generally well above-normal snowfall and snowpack (although some individual years may still end up well below-normal), while the warm phase brings 1-3 decade-long periods of generally below-normal snowfall and snowpack (although some individual years may still end up above-normal). Here is a plot of the monthly PDO index from 1900-2013 from the UW JISAO :
So the 1-3 decade-long periods of blue match up with 1-3 decade-long periods of above-normal snowfall, and vice-versa for the red (it's best to ignore the shorter variations and glitches in this monthly data, try to see the bigger smoothed picture). The 1930s and early 1940s were a terrible time period for Cascade snowfall, easily the worst in the historical record. That was followed by a long golden age of just under 3 decades, from the late 1940s through 1976, marked by numerous years of extremely high and record-setting snowfall, including at very low elevations in the 1950s. Then everything flipped in 1977 with one of the worst snow years ever on the entire West Coast, ushering in a 2-decade period of the dark ages, with mediocre to below normal snowfall most years and no huge snowfall years at all. The mid-90s saw the tide turn once again, cemented by the huge record-setting years of 1997 and 1999, followed by numerous other above-average years in the 2000s, including huge years in 2008 and 2011.
This multi-decadal PDO pattern is absolutely crucial to understanding any of this! Why? Let's say you're gonna do a big study of Northwest snowpack, and decide to run your data set from 1950-1997 as in the Mote papers which claimed to show huge declines in Northwest mountain snowpack (to find the papers, Google search for Mote snowpack). Thus your data starts in the midst of an extended period of above-normal snowfall years in the 1950s, and ends just after a long run of below-normal snowfall years in the 1980s and early 1990s, and then you fit a line to it -- obviously the line is going to slope downward, and make it look (erroneously!) as if the snowpack is decreasing precipitously over that period. The obvious flaw in their methodology is so mind-boggling and appalling, there's just nothing nice that can be said about their study. Badly done "science", and also pushing a pro climate-change agenda -- even though I happen to agree with the agenda, there's no way for any objective evaluation to agree with their flawed results. And worst of all, they had an easy fix: they could have only included data from sites which extended back to 1930 or earlier, leaving out the sites which only go back to 1950, which would have reduced their data set by a large amount -- but also made their false downward trend lines flatten out completely and moved their study closer to the realm of legitimate science, versus faulty conclusions drawn from a selectively cut data set.
What low-elevation snow data exists? And what does the data show?
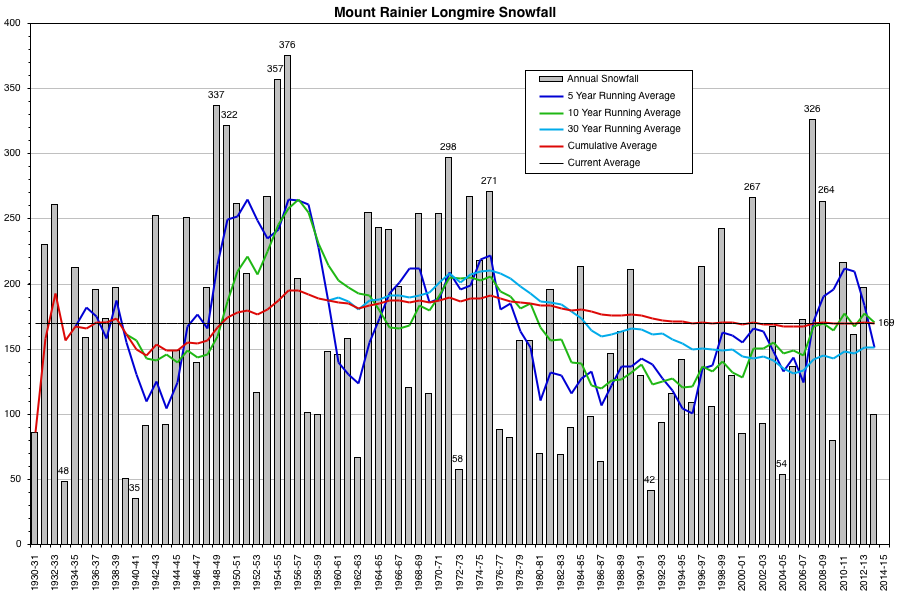
Useful snowfall or snowpack data in the Cascades extends back for about one century, with data from Mount Rainier back to 1909 at Longmire (2760 ft) and to 1916 at Paradise (5430 ft). Paradise is absolutely the keystone site in any analysis of Cascade snowfall and snowpack, being one of the only 2 mid-high elevation sites in the entire Cascade Range with snowfall and snowdepth data extending back for over 90 years (Crater Lake Park HQ at 6470 ft in southern Oregon is the other) while also holding the honor of having the greatest average annual snowfall of any measurement site in the world (over 650") and the maximum snowfall ever recorded in a one-year period (over 1200" from February 1971 to 1972). For almost any question that I think of regarding snowfall and snowpack trends, the first site that I look at the data for is Paradise, followed by Crater Lake. It's really unfortunate how few such sites have good snowfall and snowdepth data over such a vast mountain range as the Cascades, as crucially important sites which really should have such data like Mount Baker Ski Area and Mount Hood Timberline, sadly do not have it or only have it for short periods.
But it's pretty much an easily-proven fact (and ought to be well-known by now) that Cascade snowpack at most mid-high elevation sites has actually not been decreasingly significantly (or even at all) over the past few decades -- disregarding highly misleading and erroneous papers like those mentioned above. So we won't worry about the mid-high elevation sites in this at all. What about data at low elevations, that's the real question here.
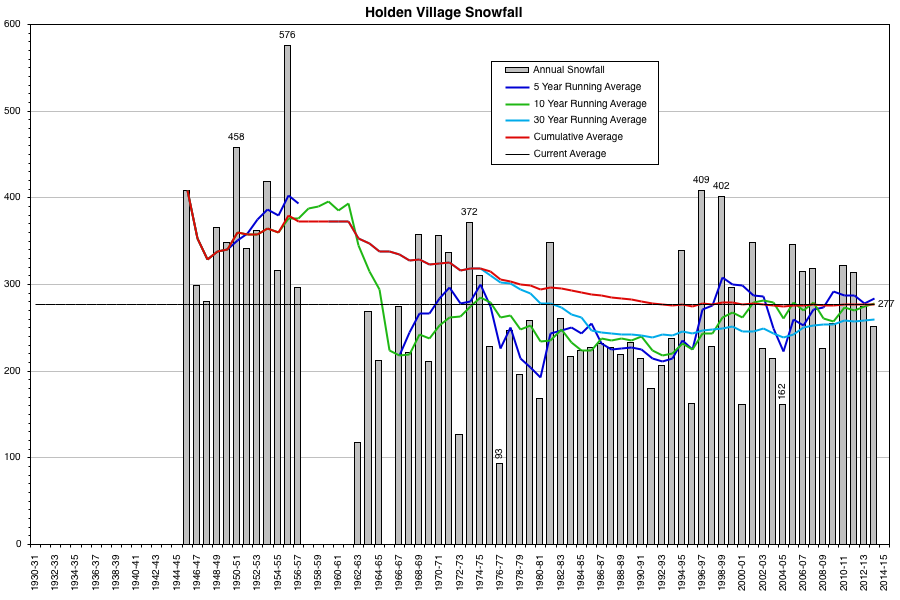
Even at low elevations of 1500-3500 ft as we are considering, and even looking for data that only extends back at least 50 years, there are less than a handful of sites in the Washington Cascades with reasonably complete snowfall and snowdepth data over that period: Longmire (2760 ft), Snoqualmie Pass (3000 ft), and Holden Village (3220 ft). Longmire and Snoqualmie have data back to 1909 and 1910, but the snowfall data is very incomplete with many missing months prior to 1930 at Snoqualmie. At Holden Village, the data prior to 1962 comes from a site listed as "Holden" with the same coordinates but elevation 200 ft higher, so the snowfall may not have been recorded at the same exact location. Here are plots of the snowfall data at these three sites with several running averages superimposed (data from WRCC , NCDC , and WSDOT Snoqualmie Historical Snowfall Records ):
For an interesting comparison with Longmire, here is the data from Paradise over the same time period (this plot added on 22Jan2015):
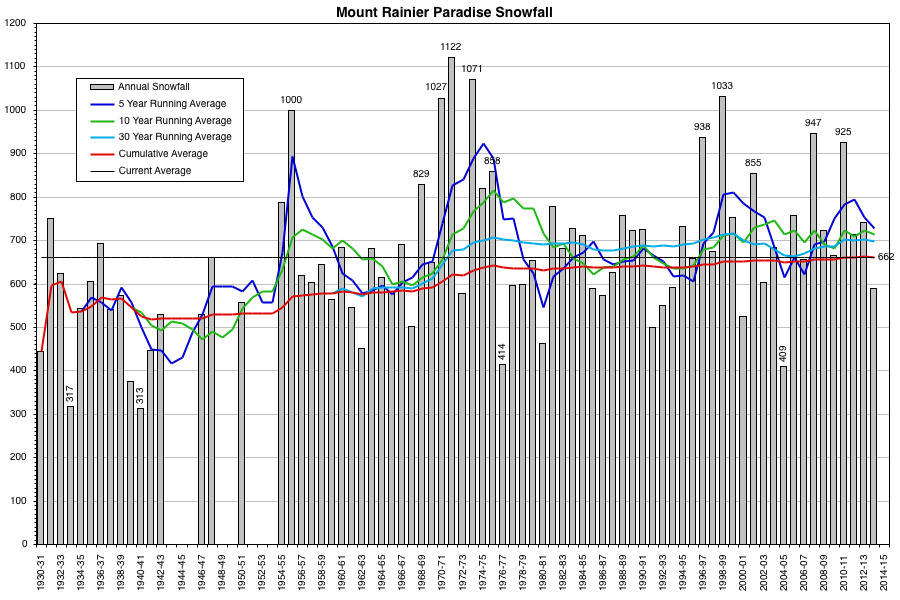
Although these 3 low-elevation sites are located at fairly similar elevations, they obviously receive vastly differing amounts of snowfall and precip. Holden Village is located in the North Cascades about 7 miles east of the Cascade Crest, with an average annual precip of only 40" to produce its 270+" average annual snowfall. Snoqualmie Pass is located at the lowest point on the Cascade Crest in Washington (outside the Columbia Gorge), with an average annual precip of 100" to produce its 420" average annual snowfall. Longmire is located on the southwest side of Mount Rainier about 7 miles from the summit, with an average annual precip of 80" to produce its 170" average annual snowfall. And for comparison, Paradise is on the south side of Mount Rainier about 5 miles from the summit, with an average annual precip of 110" to produce its 660+" average annual snowfall.
Despite these major climatological differences between the 3 low-elevation sites, they all have one thing in common: they do not show a significant reduction in snowfall in recent years! They all do show a sharp reduction in snowfall during the dark ages from 1977-1996, with much greater snowfalls prior to that.
Please see Reply #16 below for snowfall data at two more low-elevation sites analyzed 3 days after the initial study, Mazama (2170 ft) and Stehekin Company Creek powerhouse (1270 ft).
Continued in next post, exceeded 20,000 character limit . . .
Has the low-elevation snowpack in the Washington Cascades been declining over the past 2-3 decades??
(What about the Oregon Cascades? Please see Reply #19 below for that analysis.)
Many long-time Northwest skiers have been making the following claims, especially early last year and once again this year, in the face of far below-normal early-season snowpacks:
* The low-elevation Cascade snowpack is declining, and declining a lot in recent years.
* They can remember a time about 2-3 decades ago with much more substantial low-elevation Cascade snowpack almost every year.
* That such persistent low-elevation snowpacks have almost vanished in recent years, except for maybe an occasional exceptional year.
Most of the backcountry skiers that I know and ski with would almost certainly agree with these claims, and some of them are the ones making such claims. But are these claims true? Are the collective memories of these skiers, recalling halcyon days of abundant low-elevation snowfall now long-gone, actually real? Has the low-elevation Cascade snowpack really vanished, never (or rarely) to be seen again in the face of global warming?
No one likes to have their memory or recollection of events brought into question. But as is well known, human memory is one of the most fallible and least reliable sources of evidence or testimony for any particular topic or investigation. It is subject to enormous bias (especially selection bias, indeed selective memory) and numerous potential sources of outright error (such as forgetting crucial details, dates, locations, etc.), mostly perhaps unintentional errors and unbeknownst to the person doing the recollection. So we need to find some hard data to either support or refute these memory-based claims.
Based on the wide range of ages of these experienced skiers making such claims (ages I would guess roughly from 40 to 60+), the period in question that we need to consider extends back only about 2-3 decades, at most 4 decades. Time periods farther back than the mid-1970s are not relevant to these claims, since the claims are not saying that the snowpack was better 50 or 60 years ago, they are really referring to much shorter periods like 2-3 decades, maybe 4. Even so, we will analyze back at least 5-6 decades or longer in order to get a more complete picture of the data and how the snowpack has changed over time.
Since this topic is absolutely about climate change and its effects (and thus sure to be controversial), I should add a disclaimer and disclosure section:
In the interest of full disclosure, I'm a scientist but not in atmospheric or climate science, a PhD physicist and a former member of the research faculty in the UW physics department for nearly 6 years. Whatever I know about snow climatology has been self taught and self learned, as atmospheric science (especially as it relates to snow) has been an intellectual hobby of mine for nearly 2 decades. Let me also state my personal views on climate change up front: I find the data and evidence in support of "global warming" (i.e. anthropogenic climate-change since the start of the Industrial Revolution) to be overwhelming and convincing -- there is no reasonable doubt that the planet is warming, there is no reasonable doubt that most glaciers worldwide are shrinking, there is no reasonable doubt that global CO2 levels are rising, and there is very little doubt that human activities are among the primary contributors to these easily observable and measurable changes.
So I'm certainly not one of those wingnut climate-change deniers, in fact politically I'm at the far left end of the spectrum and oftentimes a one-issue environmental voter. But I also have no financial or academic connection to climate science or research in that area, and thus have no hidden agenda of trying to link everything (especially negative or unpleasant things like vanishing snowpack) to climate change in order to get grant money or publish papers. If climate change is not the cause of something, I am free to say so and will say so. I do my snow climatology research purely out of my own intellectual curiosity and a strong desire to learn the real answers.
So back on topic: the globe is warming, for sure -- but does that mean that the low-elevation Cascade snowpack must be declining over the past 2-3 decades as the globe continues to warm? I spent most of Sunday and Monday doing a detailed study of all available and relevant low-elevation snowpack data from the Washington Cascades, and the results may be shocking to some. Contrary to what you may expect, the answer is . . . No! Not at all!
Frankly, I was expecting that result, but the data is really quite STUNNING, far more positive than I would have guessed: over the last 9 years, most years are actually above-normal at most low-elevation sites in the Washington Cascades! In sharp contrast, most years during the 2-decade period from 1977-1996 were below normal, often well below-normal, with only a few slightly above-normal years. In other words, the very heart of the supposedly-great old-time period of deep low-elevation snowpacks 2-3 decades ago was in fact the worst period for low-elevation snowpack (and any-elevation snowpack) in the Washington Cascades over the last 70 years! The data clearly shows this, and there is little doubt. No fancy statistics needed either, just look at the data presented below!
I'll try to explain and show the following things so that this will hopefully be very clear and make sense:
* What causes year-to-year variability in snowfall and snowpack?
* What does "low-elevation" mean in this context?
* What "low-elevation" data actually exists that is relevant to this question?
* What does that low-elevation data show about snowpack over the past 20, 30, 40 years?
First some background on Cascades snow climatology, which is essential for understanding what is going on:
Annual snowfall (the cumulative total of new snow received in a year) and snowpack (the sitting depth of snow on a specified date such as January 1 or April 1) is highly variable from year-to-year at any location in the Cascades, and also in all other mountain regions of the world, and in all lowland regions of the world which receive snowfall too. Unlike temperature (which can only vary slightly from year-to-year) and precipitation (which can vary more significantly but still within moderate limits except in desert regions), both snowfall and snowpack tend to vary wildly from year-to-year, with the variations often being greater than the average values, and largely random in nature. The year-to-year variability is greatest at lower elevations and lower latitudes and wherever annual snowfall is low, while tending to be much less in areas of very large annual snowfall, at higher elevations near treeline, or at higher latitudes such as sub-Arctic areas (in the Northern Hemisphere) or in Antarctica (in the Southern Hemisphere) even though those areas don't actually get very much snowfall relatively-speaking.
For example, in almost every city in the US or Canada which gets snowfall (outside sub-Arctic regions), the snowfall totals vary wildly from year to year, and a deep seasonal snowpack rarely develops, resulting in even greater year-to-year variability in the snowdepth on any given date than in the very-volatile snowfall numbers. Similarly at "low elevations" in mountain regions throughout the western US (low being relative and specific to each mountain region), there is extreme year-to-year variability, with stable snowpacks and some degree of predictability only above certain threshold elevations.
At elevations below about 1500-2000 ft in the Washington Cascades, there is simply too much year-to-year variability in snowfall and snowpack to make any sense of the data. It is dominated by random variation and is not correlated or correlatable to anything, and is thus not useful for this purpose or most others. In addition, due to this extreme variability, snowfall and snowdepth data is not generally collected in these very low elevation areas, except in towns or other areas with established populations.
So that sets a lower limit on what we can analyze, which actually corresponds nicely to what skiers think of as "low-elevation" here, the lower limit of skiable terrain. Therefore we'll consider data from about 1500-3500 ft as low-elevation. Our low-elevation range thus includes Snoqualmie Pass (3000 ft) as it really must, while excluding all other Cascade Crest passes. In general, 3500-5500 ft would be considered mid-elevation for snowfall data in the Washington Cascades, while 5500-7000 ft are the highest elevations at which such data is available. The corresponding elevation bands in the Oregon Cascades are about 1000 ft higher, and 2000 ft higher in the California Cascades, although this analysis will be limited to the Washington Cascades only at this point (due to time constraints).
In the Cascades, year-to-year snowfall and snowpack variability increases substantially as one moves south along the nearly 800-mile length of the range from southwestern BC to northern California, and increases even more as one continues further south along the nearly 400-mile extension of the Sierra Nevada. These annual variations are fairly well-correlated to 2 major ocean-atmosphere cycles which affect sea-surface temperatures in the Pacific Ocean: the El Nino Southern Oscillation (ENSO), which has a timescale of a few years, and the Pacific Decadal Oscillation (PDO), with a timescale of a few decades. The ENSO cycle is very well studied and is definitely not periodic, nor is it predictable years in advance, and the PDO appears to share those 2 characteristics, although it is much less well studied. Its roughly 10-times longer timescale makes determining periodicity or predictability all but impossible given that barely a couple of PDO cycles have been observed over the past century of scientific data.
Snowfall and snowpack in the Cascades has a very strong positive correlation to the cool phase of ENSO (La Nina), a correlation which extends throughout the entire range from north to south and at all elevations, and even extends (more weakly positive) into the Sierra Nevada. In contrast, the warm phase of ENSO (El Nino) has much more complicated correlations, being very strongly positive for snowfall and snowpack (and precip) in the Sierra Nevada and California Cascades, but weakly negative for snowfall and snowpack in the Washington and Oregon Cascades (more strongly negative at low elevations), and again somewhat positive in southwestern BC especially at higher elevations. See my Cascade ENSO Snowfall webpage, which was created a decade ago and was the first comprehensive analysis of ENSO effects in the Cascades at elevations relevant for skiing and ski mountaineering, for more details about these correlations.
As for the PDO, I know of no similar study, but the correlations appear to be fairly obvious in this case, especially for the Cascades and southern BC: the cool phase of the PDO corresponds to 1-3 decade-long periods of generally well above-normal snowfall and snowpack (although some individual years may still end up well below-normal), while the warm phase brings 1-3 decade-long periods of generally below-normal snowfall and snowpack (although some individual years may still end up above-normal). Here is a plot of the monthly PDO index from 1900-2013 from the UW JISAO :
So the 1-3 decade-long periods of blue match up with 1-3 decade-long periods of above-normal snowfall, and vice-versa for the red (it's best to ignore the shorter variations and glitches in this monthly data, try to see the bigger smoothed picture). The 1930s and early 1940s were a terrible time period for Cascade snowfall, easily the worst in the historical record. That was followed by a long golden age of just under 3 decades, from the late 1940s through 1976, marked by numerous years of extremely high and record-setting snowfall, including at very low elevations in the 1950s. Then everything flipped in 1977 with one of the worst snow years ever on the entire West Coast, ushering in a 2-decade period of the dark ages, with mediocre to below normal snowfall most years and no huge snowfall years at all. The mid-90s saw the tide turn once again, cemented by the huge record-setting years of 1997 and 1999, followed by numerous other above-average years in the 2000s, including huge years in 2008 and 2011.
This multi-decadal PDO pattern is absolutely crucial to understanding any of this! Why? Let's say you're gonna do a big study of Northwest snowpack, and decide to run your data set from 1950-1997 as in the Mote papers which claimed to show huge declines in Northwest mountain snowpack (to find the papers, Google search for Mote snowpack). Thus your data starts in the midst of an extended period of above-normal snowfall years in the 1950s, and ends just after a long run of below-normal snowfall years in the 1980s and early 1990s, and then you fit a line to it -- obviously the line is going to slope downward, and make it look (erroneously!) as if the snowpack is decreasing precipitously over that period. The obvious flaw in their methodology is so mind-boggling and appalling, there's just nothing nice that can be said about their study. Badly done "science", and also pushing a pro climate-change agenda -- even though I happen to agree with the agenda, there's no way for any objective evaluation to agree with their flawed results. And worst of all, they had an easy fix: they could have only included data from sites which extended back to 1930 or earlier, leaving out the sites which only go back to 1950, which would have reduced their data set by a large amount -- but also made their false downward trend lines flatten out completely and moved their study closer to the realm of legitimate science, versus faulty conclusions drawn from a selectively cut data set.
What low-elevation snow data exists? And what does the data show?
Useful snowfall or snowpack data in the Cascades extends back for about one century, with data from Mount Rainier back to 1909 at Longmire (2760 ft) and to 1916 at Paradise (5430 ft). Paradise is absolutely the keystone site in any analysis of Cascade snowfall and snowpack, being one of the only 2 mid-high elevation sites in the entire Cascade Range with snowfall and snowdepth data extending back for over 90 years (Crater Lake Park HQ at 6470 ft in southern Oregon is the other) while also holding the honor of having the greatest average annual snowfall of any measurement site in the world (over 650") and the maximum snowfall ever recorded in a one-year period (over 1200" from February 1971 to 1972). For almost any question that I think of regarding snowfall and snowpack trends, the first site that I look at the data for is Paradise, followed by Crater Lake. It's really unfortunate how few such sites have good snowfall and snowdepth data over such a vast mountain range as the Cascades, as crucially important sites which really should have such data like Mount Baker Ski Area and Mount Hood Timberline, sadly do not have it or only have it for short periods.
But it's pretty much an easily-proven fact (and ought to be well-known by now) that Cascade snowpack at most mid-high elevation sites has actually not been decreasingly significantly (or even at all) over the past few decades -- disregarding highly misleading and erroneous papers like those mentioned above. So we won't worry about the mid-high elevation sites in this at all. What about data at low elevations, that's the real question here.
Even at low elevations of 1500-3500 ft as we are considering, and even looking for data that only extends back at least 50 years, there are less than a handful of sites in the Washington Cascades with reasonably complete snowfall and snowdepth data over that period: Longmire (2760 ft), Snoqualmie Pass (3000 ft), and Holden Village (3220 ft). Longmire and Snoqualmie have data back to 1909 and 1910, but the snowfall data is very incomplete with many missing months prior to 1930 at Snoqualmie. At Holden Village, the data prior to 1962 comes from a site listed as "Holden" with the same coordinates but elevation 200 ft higher, so the snowfall may not have been recorded at the same exact location. Here are plots of the snowfall data at these three sites with several running averages superimposed (data from WRCC , NCDC , and WSDOT Snoqualmie Historical Snowfall Records ):
For an interesting comparison with Longmire, here is the data from Paradise over the same time period (this plot added on 22Jan2015):
Although these 3 low-elevation sites are located at fairly similar elevations, they obviously receive vastly differing amounts of snowfall and precip. Holden Village is located in the North Cascades about 7 miles east of the Cascade Crest, with an average annual precip of only 40" to produce its 270+" average annual snowfall. Snoqualmie Pass is located at the lowest point on the Cascade Crest in Washington (outside the Columbia Gorge), with an average annual precip of 100" to produce its 420" average annual snowfall. Longmire is located on the southwest side of Mount Rainier about 7 miles from the summit, with an average annual precip of 80" to produce its 170" average annual snowfall. And for comparison, Paradise is on the south side of Mount Rainier about 5 miles from the summit, with an average annual precip of 110" to produce its 660+" average annual snowfall.
Despite these major climatological differences between the 3 low-elevation sites, they all have one thing in common: they do not show a significant reduction in snowfall in recent years! They all do show a sharp reduction in snowfall during the dark ages from 1977-1996, with much greater snowfalls prior to that.
Please see Reply #16 below for snowfall data at two more low-elevation sites analyzed 3 days after the initial study, Mazama (2170 ft) and Stehekin Company Creek powerhouse (1270 ft).
Continued in next post, exceeded 20,000 character limit . . .
Please Log in or Create an account to join the conversation.
- Amar Andalkar
- [andalkar]
-
Topic Author
- Offline
- Premium Member
-
Less
More
- Posts: 635
- Thank you received: 0
12 Jan 2015 17:22 - 22 Jan 2015 09:18 #223540
by Amar Andalkar
Replied by Amar Andalkar on topic Re: Has low-elevation Cascade snowpack been declining?
Continued from previous post . . .
Snowfall data is hard to collect, since it requires a person to measure the new snowfall at least once a day (or clear the snow off of a 24-hour snow telemetry board), and so it is simply unavailable for any remote areas without year-round human occupation. In addition, even the best-quality mountain snowfall data is full of numerous errors, with an error rate typically in the ballpark of 1% of all daily observations based on my review of daily snowfall data from many many sites (most such errors are easily detected by finding inconsistencies between the snowfall for a given day and the change in snowdepth). Anyway, there's no way to fix that, the data is what it is from each site, and it must be understood to have significant random noise (perhaps 5-10%) in all monthly or annual snowfall totals.
Low-elevation snowpack data:
In contrast to collecting accurate annual snowfall data, getting accurate snowdepth and snowpack (snow-water) data is very easy. Manual snow courses have been in use in western states since 1910 (generally measured once a month, sometime near the first of the month, 3-6 months per year), with automated snow telemetry networks coming online in the 1970s and 1980s (primarily NRCS SNOTEL with now over 800 sites, but also state networks like California Cooperative Snow Surveys and avalanche centers such as NWAC). Unfortunately for our purposes here, there is a major problem: the period of record from SNOTEL and NWAC sites is too short to be of use, and in addition very few of these sites are located within our low-elevation band. The manual snow courses often have periods of record extending back 50 or 80 years, and also have larger numbers of them located in our low-elevation band, but are beset by an even more maddening problem: measuring manual snow courses takes costly human labor, so with the increasing numbers of SNOTEL sites since the 1980s, a large fraction of manual snow courses were discontinued, often after a few-year overlap period with a nearby newly installed SNOTEL site just long enough to develop a correlation sufficient for water-supply forecasting purposes. Unfortunately, such correlations are useless for our purposes (comparing snowpack at individual sites over a long period of record to see if it's declining) and in any case are unknown to the general public outside the water-supply forecasting offices.
There's no way to fix this issue either. But luckily, a few (very few!) snow courses in Washington have continued to be measured regularly throughout a lengthy period of record including recent years. And thankfully the new interactive map from the NRCS now makes it easy to view all active snow courses in Washington or any other state, a process which even a few months ago would have been prohibitively difficult. Note that the locations of some snow courses are totally wrong on the map, but most of them appear to be correct or close.
Out of 234 total snow courses in Washington listed in the NRCS database, only 84 are still active and being measured , only 49 of those have a period of record of over 40 years, and only 21 of those are at roughly 3500 ft or below in the Cascades:
site_name start enddate latitude longitude elev county
Beaver Pass (21A01) 1944-March active 48.88 -121.26 3621 Whatcom
Marten Lake (21A09) 1959-February active 48.76 -121.72 3600 Whatcom
Granite Creek (20A06) 1971-February active 48.60 -120.81 3500 Skagit
Alpine Meadow (21B48) 1969-March active 47.78 -121.70 3500 Snohomish
Freezeout Cr. Tr. (20A01) 1944-March active 48.95 -120.93 3500 Whatcom
Bumping Lake New (21C36) 1961-January active 46.88 -121.28 3400 Yakima
Schreibers Meadow (21A10) 1959-February active 48.70 -121.82 3400 Whatcom
Mt. Gardner (21B21) 1959-March active 47.36 -121.57 3300 King
Fish Lake (21B04) 1943-January active 47.53 -121.09 3300 Kittitas
Ahtanum R.S. (21C11) 1941-January active 46.52 -121.02 3100 Yakima
Grass Mtn. No. 2 (21B27) 1961-January active 47.22 -121.76 2900 King
New Lake Hozomeen (21A30) 1971-February active 48.94 -121.03 2800 Whatcom
Tunnel Avenue (21B08) 1941-February active 47.32 -121.34 2433 Kittitas
Thunder Basin (20A07) 1948-January active 48.52 -120.99 2400 Skagit
City Cabin (21B03) 1948-March active 47.32 -121.52 2390 King
S.f. Thunder Creek (21A14) 1959-February active 48.58 -121.62 2200 Skagit
Beaver Creek Trail (21A04) 1944-March active 48.82 -121.19 2200 Whatcom
Dommerie Flats (21B14) 1939-March active 47.22 -121.05 2200 Kittitas
Rocky Creek (21A12) 1959-February active 48.68 -121.78 2100 Whatcom
Meadow Cabins (20A08) 1945-March active 48.58 -121.03 1900 Skagit
Chiwaukum G.S. (20B16) 1961-January active 47.69 -120.74 1810 Chelan
So let's look at the snowdepth and SWE as a % of normal (1981-2010 median) over the last 9 years 2006 to 2014 at these 21 sites (we all know that 2005 was far below normal, the worst snow year in 30-60 years, so let's cut it off there). Sites are arranged in geographic order from N and W to S and E along the Cascades, and those 9 seasons are very approximately categorized as above-near-below normal by glancing at the % of normal values:
East side of Mount Baker:
Marten Lake (21A09) 3600 ft (1959-2015)
Huge snowdepths almost comparable to Baker Ski Area, hardly feels like a low-elevation site!
All recent years 2014 & 2013 & 2012 & 2011 are above-normal, 2010 & 2009 near-normal, 2008 & 2007 & 2006 also above-normal
South side of Mount Baker:
Schreibers Meadow (21A10) 3400 ft (1959-2015)
2014 near-normal, 2013 & 2012 & 2011 above-normal, 2010 & 2009 near-normal, 2008 & 2007 & 2006 also above-normal
Rocky Creek (21A12) 2100 ft (1959-2015)
NOTE: 1971-2000 normals used since 1981-2010 are missing -- All recent years 2014 & 2013 & 2012 & 2011 are above-normal, 2010 below-normal, 2009 & 2008 & 2007 & 2006 also above-normal
East of Baker Lake & Lake Shannon:
S.f. Thunder Creek (21A14) 2200 ft (1959-2013)
NOTE: very spotty data in recent years, 1971-2000 normals used since 1981-2010 are missing
North Cascades NP: Big Beaver Creek
Beaver Pass (21A01) 3621 ft (1944-2015)
All recent years 2014 & 2013 & 2012 & 2011 are above-normal, 2010 & 2009 near-normal, 2008 & 2007 & 2006 also above-normal
Beaver Creek Trail (21A04) 2200 ft (1944-2015)
All recent years 2014 & 2013 & 2012 & 2011 are above-normal, 2010 below-normal, 2009 & 2008 & 2007 & 2006 also above-normal
North Cascades NP: East of Ross Lake
New Lake Hozomeen (21A30) 2800 ft (1971-2015)
2014 & 2012 & 2011 above-normal, 2013 & 2010 below-normal, 2009 & 2008 & 2007 & 2006 also above-normal
Freezeout Cr. Tr. (20A01) 3500 ft (1944-2015)
All recent years 2014 & 2013 & 2012 & 2011 are above-normal, 2010 below-normal, 2009 & 2008 & 2007 & 2006 also above-normal
North Cascades NP: Thunder Creek
Meadow Cabins (20A08) 1900 ft (1945-2015)
All recent years 2014 & 2013 & 2012 & 2011 are above-normal, 2010 below-normal, 2009 & 2008 & 2007 also above-normal, 2006 below-normal
Thunder Basin (20A07) 2400 ft (1948-2015)
2014 & 2012 & 2011 above-normal, 2013 near-normal, 2010 below-normal, 2009 near-normal, 2008 & 2007 above-normal, 2006 near-normal
North Cascades NP: SR 20
Granite Creek (20A06) 3500 ft (1971-2015)
All recent years 2014 & 2013 & 2012 & 2011 are above-normal, 2010 below-normal, 2009 & 2008 & 2007 & 2006 also above-normal
South of Gold Bar on US 2:
Alpine Meadow (21B48) 3500 ft (1969-2015)
All recent years 2014 & 2013 & 2012 & 2011 are above-normal, 2010 below-normal, 2009 & 2008 & 2007 & 2006 also above-normal
South of Lake Wenatchee on US 2:
Chiwaukum G.s. (20B16) 1810 ft (1961-2013)
2012 & 2011 above-normal, 2013 & 2010 below-normal, 2009 near-normal, 2008 & 2007 & 2006 also above-normal
Cle Elum River Road:
Fish Lake (21B04) 3300 ft (1943-2015)
2014 & 2012 & 2011 above-normal, 2013 & 2010 & 2007 near-normal, 2009 & 2008 & 2006 also above-normal
Cedar River south of I-90:
Mt. Gardner (21B21) 3300 ft (1959-2015)
2014 below-normal, 2013 & 2012 & 2011 above-normal, 2010 below-normal, 2009 & 2008 & 2007 & 2006 also above-normal
City Cabin (21B03) 2390 ft (1948-2015)
2014 & 2011 near-normal, 2013 & 2012 above-normal, 2010 below-normal, 2009 & 2008 & 2006 also above-normal, 2007 near-normal
East end of Keechelus Lake south of I-90:
Tunnel Avenue (21B08) 2433 ft (1941-2015)
2014 & 2013 near-normal, 2012 & 2011 above-normal, 2010 below-normal, 2009 & 2008 & 2007 & 2006 also above-normal
Near Cle Elum Lake north of I-90:
Dommerie Flats (21B14) 2200 ft (1939-2015)
2014 & 2013 above&below-normal, 2012 & 2011 above-normal, 2010 below-normal, 2009 & 2008 & 2007 & 2006 also above-normal
North of SR 410 east of Enumclaw:
Grass Mtn. No. 2 (21B27) 2900 ft (1961-2015)
Very spotty data since 2009, but 2009 & 2008 & 2007 & 2006 all above-normal
South of SR 410 east of Chinook Pass:
Bumping Lake New (21C36) 3400 ft (1961-2015)
2014 below-normal, 2013 & 2010 near-normal, 2012 & 2011 above-normal, 2009 & 2008 & 2007 & 2006 all above-normal
South of US 12 west of Yakima:
Ahtanum R.s. (21C11) 3100 ft (1941-2013)
2013 & 2012 & 2009 below-normal, 2011 above-normal, 2010 & 2008 & 2007 near-normal, 2006 above-normal
So basically, the story is roughly the same at almost all of these sites: the years from 2006-2014 have in general been above-normal for snowpack most years, with very few below-normal years, generally only 1 or 2 years at most sites. Although I didn't bother categorizing them (too much work), in general the years from 1977 to 1996 are much worse at all of these sites, with a majority of below-normal years during that 20 year period. The data is fairly conclusive and leaves little room for stating that recent years have had below normal snowpacks at low-elevation sites in the Washington Cascades.
And why was I expecting this result? Because simply put, the last nine years (from 2005-6 onward) have really been a great period for snowpack and snowfall in the Cascades, based on my personal experience and all the snow data that I track through the winter, spring, and summer each year. This is especially true in Washington, but clearly less so in southern Oregon and California which have suffered 3 straight drought years and possibly entering a fourth. This recent period has included 2 huge near-record-type years (2007-8 and 2010-11), along with several other above-average years, and there has not been a single year that has been well below-average overall for the Washington Cascades since 2004-5. The late-spring and summers of 2010, 2011, and 2012 were the best late-seasons for snowpack in the Cascades in almost 40 years. Then 2013 was a banner year for low-elevation powder even near Snoqualmie Pass (any season that I ski the Kendall Lakes basin area 7 times in deep powder has got to be a banner powder year, especially given my typical preference for skiing elsewhere!). And 2014 turned out to be near-normal or above-normal by any fair objective measure of snowpack, despite a very slow start, and personally was one of my best ski mountaineering seasons ever.
In my own personal experience, I'm just not seeing (or skiing) this bad, below-normal, rapidly declining snowpack -- not at all. I'm rather curious why so many skiers have such strongly held views that the last several years have been terrible overall or at least at low elevations, when hard data and my own impressions indicate strongly otherwise.
(I may revise and edit this post several times, since it is long and complicated, and minor errors may have slipped in too . . . please let me know if you find any. Plus I haven't slept at all overnight or in over 30 hours while working on this data retrieval and analysis.)
Please see Reply #16 below for a further extension of this analysis to include SNOTEL sites in the southernmost Washington Cascades, done 3 days after the initial study.
Please Log in or Create an account to join the conversation.
- GerryH
- [GerryH]
-
- Offline
- Junior Member
-

Less
More
- Posts: 88
- Thank you received: 0
12 Jan 2015 20:32 #223544
by GerryH
Replied by GerryH on topic Re: Has low-elevation Cascade snowpack been declining?
Really fine work Amar. Thanks for so clearly showing these historical trends, particularly of the PDO. Looking at the maximums back in the 50's surely seems to support the Moffet's at Snoqualmie building those dangerously high top off-loading stations on those 1st generation chairlifts. It put real fear in your gut as a beginner, as your chair approached the top lift station, which itself was adorned with the broken ski tips of the unwary or distracted who innocently let their skis dangle
So now for another question: Can you analyze the data to show when enough skiable snow has accumulated, for however many stations you can find. How much variability is there in the onset of skiing? Or, is our 'typical' season still averaging the same mean start, center or overall period? Should we shift our expectations, or just cool it and be patient, knowing that the skiing will always return to the mean - which seems to fly in the face of global warming, which I too fear is well on its way.
So now for another question: Can you analyze the data to show when enough skiable snow has accumulated, for however many stations you can find. How much variability is there in the onset of skiing? Or, is our 'typical' season still averaging the same mean start, center or overall period? Should we shift our expectations, or just cool it and be patient, knowing that the skiing will always return to the mean - which seems to fly in the face of global warming, which I too fear is well on its way.
Please Log in or Create an account to join the conversation.
- Micah
- [primate]
-
- Offline
- Moderator
-

Less
More
- Posts: 142
- Thank you received: 0
13 Jan 2015 08:46 #223548
by Micah
Replied by Micah on topic Re: Has low-elevation Cascade snowpack been declining?
Wow, Amar. I haven't had time to read and contemplate your post, but I wanted to express my gratitude. Thank you for doing this. I am curious about these kinds of questions, but I would never be able to collect, aggregate, and interpret enough historical data!
Please Log in or Create an account to join the conversation.
- Chamois
- [Chamois]
-
- Offline
- Junior Member
-
Less
More
- Posts: 132
- Thank you received: 1
13 Jan 2015 11:48 #223549
by Chamois
Replied by Chamois on topic Re: Has low-elevation Cascade snowpack been declining?
Thanks Amar - very interesting read.
Maybe if we had more snow this year you would not have had time to prepare this!
Maybe if we had more snow this year you would not have had time to prepare this!
Please Log in or Create an account to join the conversation.
- rippy
- [rippy]
-
- Offline
- Junior Member
-
Less
More
- Posts: 89
- Thank you received: 1
13 Jan 2015 19:20 #223552
by rippy
Replied by rippy on topic Re: Has low-elevation Cascade snowpack been declining?
The data gathered and analyzed is very impressive Amar, thanks for delving into this. My observation is that some years in the latter 70's, 80's, early 90's were not as deep and long lasting but did afford skiing at our local areas. Sometimes pretty thin coverage, but adequate.....mostly. The 2005 event and this years stand out although 05 turned a corner late. One has to wonder when the warmest couple years of record show up (don't say this to a mid-westerner, they're getting the polar hammer) along with significant ice melt if the next, say 20 years a predictive approach could let us look into the crystal ball? I can imagine mean snow levels going upward, enough moisture in the storms to drop meaningful amounts of snow, but temp's will be just a few degrees off. Probably some forecasts thinking we'll dry a bit but I doubt there's hard evidence. The conjecture that Snoqualmie Pass will be lucky to pull off a ski season in 20 to 30 years is sounding more real though. In your research do you look at data modeling of longer-term projections? Maybe you've seen some of the "what-if" scenario's and what us armchair weatherpersons might notice should the weather influences go contrary? Just curious and again, very nice job!
Please Log in or Create an account to join the conversation.
- MattT
- [MattT]
-
- Offline
- Junior Member
-
Less
More
- Posts: 62
- Thank you received: 0
13 Jan 2015 21:38 #223555
by MattT
Replied by MattT on topic Re: Has low-elevation Cascade snowpack been declining?
Awesome analysis Amar, thanks for all your hard work (please get some sleep!).
I'm not a old-timer nor long time PNW skier (sorry if I gave that impression). I started skiing here ~10 years ago, in the midst of the "golden age" and thus my perception of declining low elevation snow pack makes sense in that context. Your analysis is fairly conclusive, but it does stand out to me that the cumulative and 30 year avgs are pretty decidedly downward trending in your plots (esp for Longmire and snoq pass). So although it most certainly can be said that our recent low elevation snowpack is not nearly as "bad" as we are perceiving it to be, can it not be said that the low elevation snowpack is declining when using a broad time scale (albeit with some recent improvement due to the "golden age" period)?
Again, nice work! Cheers
Please Log in or Create an account to join the conversation.
- bs.
- [bs.]
-
- Offline
- New Member
-

Less
More
- Posts: 1
- Thank you received: 0
13 Jan 2015 22:53 #223556
by bs.
Replied by bs. on topic Re: Has low-elevation Cascade snowpack been declining?
thanks for an informative and interesting read!
Please Log in or Create an account to join the conversation.
- gravitymk
- [gravitymk]
-
- Offline
- Senior Member
-

Less
More
- Posts: 387
- Thank you received: 0
14 Jan 2015 11:48 #223558
by gravitymk
Replied by gravitymk on topic Re: Has low-elevation Cascade snowpack been declining?
Thank you for sharing!
Please Log in or Create an account to join the conversation.
- Floater
- [Floater]
-
- Offline
- New Member
-
Less
More
- Posts: 23
- Thank you received: 0
14 Jan 2015 23:00 #223568
by Floater
Replied by Floater on topic Re: Has low-elevation Cascade snowpack been declining?
Glad we got to ski together today...loved the post. My problem is I am way too old I did a lot of skiing in the "Golden Years"......LOL. A lot of ghost and hat skiing back then.
Please Log in or Create an account to join the conversation.
- HillsHaveEyes
- [HillsHaveEyes]
-
- Offline
- New Member
-
Less
More
- Posts: 32
- Thank you received: 0
15 Jan 2015 07:34 #223569
by HillsHaveEyes
Replied by HillsHaveEyes on topic Re: Has low-elevation Cascade snowpack been declining?
Thanks for taking the time to do this Amar. There is a lot to chew on here.
Please Log in or Create an account to join the conversation.
- Stefan
- [Stefan]
-
- Offline
- Junior Member
-
Less
More
- Posts: 102
- Thank you received: 2
15 Jan 2015 09:07 #223570
by Stefan
Replied by Stefan on topic Re: Has low-elevation Cascade snowpack been declining?
great info.
As a question that is not scientific...but maybe somewhat in the same direction....
Does anybody have the historic opening and closing dates of skiing at Snoqualmie Pass?
As a question that is not scientific...but maybe somewhat in the same direction....
Does anybody have the historic opening and closing dates of skiing at Snoqualmie Pass?
Please Log in or Create an account to join the conversation.
- Koda
- [WayneH]
-
- Offline
- Junior Member
-
Less
More
- Posts: 166
- Thank you received: 0
15 Jan 2015 11:41 #223572
by Koda
so if the snowpack is not declining are there any measurements to why the snowpack doesn’t seem to start to build up until mid/late January? Seems like in recent years we get late season storms that bring paramount amount of snow to balance out the annual snowfall late in the season. Perhaps without the early season low elevation snowpack these late season storms don’t have as much effect on the lower elevations which melt out sooner after the storm. This might be why some low elevation ski resorts seem to be opening later and closing sooner these days and also may validate some of our old memories of deep snowpacks years ago. If that makes sense in my non-scientific understanding!
Its like the snowpack isn’t declining but there is a change in the weather pattern….
Replied by Koda on topic Re: Has low-elevation Cascade snowpack been declining?
so if the snowpack is not declining are there any measurements to why the snowpack doesn’t seem to start to build up until mid/late January? Seems like in recent years we get late season storms that bring paramount amount of snow to balance out the annual snowfall late in the season. Perhaps without the early season low elevation snowpack these late season storms don’t have as much effect on the lower elevations which melt out sooner after the storm. This might be why some low elevation ski resorts seem to be opening later and closing sooner these days and also may validate some of our old memories of deep snowpacks years ago. If that makes sense in my non-scientific understanding!
Its like the snowpack isn’t declining but there is a change in the weather pattern….
Please Log in or Create an account to join the conversation.
- Micah
- [primate]
-
- Offline
- Moderator
-
Less
More
- Posts: 142
- Thank you received: 0
15 Jan 2015 17:06 - 15 Jan 2015 17:29 #223575
by Micah
Replied by Micah on topic Re: Has low-elevation Cascade snowpack been declining?
Koda:
Here is a quick plot of the snow-water equivalent data from Schreibers Meadow that Amar links above for January and May (chosen near the beginning and end of the time that there is a reasonable amount of data).

I don't see any shift towards deeper snowpack in May relative to January. Actually, if I look closely, it seems like the Jan. numbers are pretty steady, but the May numbers tend to be below average from ~1976 to ~1996 when the PDO index was mostly positive and above average for dates in this dataset before then when the PDO index was mostly negative. Feel free to repeat this analysis for all the other data....
Here is a quick plot of the snow-water equivalent data from Schreibers Meadow that Amar links above for January and May (chosen near the beginning and end of the time that there is a reasonable amount of data).
I don't see any shift towards deeper snowpack in May relative to January. Actually, if I look closely, it seems like the Jan. numbers are pretty steady, but the May numbers tend to be below average from ~1976 to ~1996 when the PDO index was mostly positive and above average for dates in this dataset before then when the PDO index was mostly negative. Feel free to repeat this analysis for all the other data....
Please Log in or Create an account to join the conversation.
- lrudholm
- [lrudholm]
-
- Offline
- Junior Member
-
Less
More
- Posts: 83
- Thank you received: 0
15 Jan 2015 19:00 #223578
by lrudholm
Replied by lrudholm on topic Re: Has low-elevation Cascade snowpack been declining?
We're doomed!
Please Log in or Create an account to join the conversation.
- Koda
- [WayneH]
-
- Offline
- Junior Member
-
Less
More
- Posts: 166
- Thank you received: 0
15 Jan 2015 19:20 #223579
by Koda
I see the dip in the May trend, but I also see a slight decline in the trend overall.
Replied by Koda on topic Re: Has low-elevation Cascade snowpack been declining?
I don't see any shift towards deeper snowpack in May relative to January. Actually, if I look closely, it seems like the Jan. numbers are pretty steady, but the May numbers tend to be below average from ~1976 to ~1996 when the PDO index was mostly positive and above average for dates in this dataset before then when the PDO index was mostly negative. Feel free to repeat this analysis for all the other data....
I see the dip in the May trend, but I also see a slight decline in the trend overall.
Please Log in or Create an account to join the conversation.
- Amar Andalkar
- [andalkar]
-
Topic Author
- Offline
- Premium Member
-
Less
More
- Posts: 635
- Thank you received: 0
15 Jan 2015 20:53 - 17 Jan 2015 13:16 #223581
by Amar Andalkar
Replied by Amar Andalkar on topic Re: Has low-elevation Cascade snowpack been declining?
Continued from the original 2 posts above . . . written 3 days later, as I was out skiing in great snow conditions the past 2 days at Crystal (51,000 vert of sunny empty smooth grippy fast awesome groomers, such a blast at 50+ mph) and Camp Muir via Nisqually Chute (1-2" of silky smooth powder on a firm base on much of the Snowfield, then nice sun-softened proto-corn in the Chute).
For the sake of completeness, I decided to also check the data for relevant low-elevation SNOTEL sites in Washington, even though all were installed in 1978 or later and thus have less than the 40 year minimum period of record used for the snow course data above. So let's look at SNOTEL sites with at least 30 years of data, the bare minimum for addressing the central question of this thread (whether snowpack has been declining over the past 2-3 decades) and also the minimum for NRCS to calculate reliable values for normal snowpack and % of normal (they are currently using the 1981-2010 time frame). Note that relaxing the minimum required period from 40 to 30 years for the earlier analysis above would not have included any additional snow courses, as there are no active snow courses in the Cascades with less than 40 but more than 30 years of data.
This map shows all active snow courses and SNOTEL sites in Washington . There are 79 SNOTEL sites in Washington listed in the NRCS database, of which 75 are still active, only 32 of those have a period of record of over 30 years, and only 6 of those are at roughly 3500 ft or below in the Cascades (one of which at Fish Lake is located adjacent to the snow course listed above in Reply #1).
Low-elevation SNOTEL sites in Washington with at least 30 years of data:
site_name start enddate latitude longitude elev county
Pope Ridge (699) 1980-September active 47.99 -120.57 3590 Chelan
Spirit Lake (777) 1983-October active 46.26 -122.18 3520 Skamania
June Lake (553) 1980-December active 46.15 -122.15 3440 Skamania
Fish Lake (478) 1980-September active 47.54 -121.09 3430 Kittitas
Spencer Meadow (776) 1981-February active 46.18 -121.93 3400 Skamania
Cougar Mountain (420) 1980-September active 47.28 -121.67 3200 King
Looking at that table, one major benefit of including these 6 SNOTEL sites becomes obvious: 3 of them are located in the southernmost Washington Cascades near Mount Saint Helens, well south of any of the snow courses included in this study (which were very disproportionately located in the North Cascades), so they provide an important check on whether these results are consistent throughout the entire Washington Cascades. Here is the same type of quick analysis as was done for the snow courses, but including precip and snow-water statistics since these are available for SNOTEL sites:
Entiat River Road, west of Lake Chelan:
Pope Ridge (699) 3590 ft (1981-2015, snowdepth installed 1997)
Average annual precip of 34", median maximum SWE of 17" near March 20
2014 & 2013 near-normal, 2012 above-normal, 2011 & 2010 near-normal, 2009 below-normal, 2008 & 2007 & 2006 above-normal
Cle Elum River Road:
Fish Lake (478) 3430 ft (1983-2015, snowdepth installed 2000)
Average annual precip of 63", median maximum SWE of 30" near April 1
2014 & 2013 near-normal, 2012 & 2011 above-normal, 2010 below-normal, 2009 near-normal, 2008 & 2007 & 2006 above-normal
Green River north of SR 410:
Cougar Mountain (420) 3200 ft (1981-2015, snowdepth installed 2002)
Average annual precip of 97", median maximum SWE of 16" near March 5
2014 below-normal, 2013 & 2012 & 2011 above-normal, 2010 below-normal, 2009 & 2008 & 2006 above-normal, 2007 near-normal
North side of Mount Saint Helens:
Spirit Lake (777) 3520 ft (1984-2015, snowdepth installed 2005)
Extremely low snowpack site with extreme variability, due to strong rain-shadowing from Saint Helens and a total lack of tree cover in the 1980 eruption zone, it has only about half the precip and 10-15% of the snowpack at June Lake on the south side (and much worse than that by April).
Average annual precip of 88", median maximum SWE of 5" near March 5
2014 below-normal, 2013 & 2012 & 2011 above-normal, 2010 below-normal, 2009 & 2008 & 2007 & 2006 also above-normal
South side of Mount Saint Helens:
June Lake (553) 3440 ft (1984-2015, snowdepth installed 2003)
Average annual precip of 165" (the most of any SNOTEL site as far as I know), median maximum SWE of 38" near March 5
2014 below-normal, 2013 & 2012 & 2011 above-normal, 2010 near-normal, 2009 & 2008 & 2007 & 2006 also above-normal
Between Mount Saint Helens and Mount Adams:
Spencer Meadow (776) 3400 ft (1982-2015, snowdepth installed 2006)
Average annual precip of 100", median maximum SWE of 30" near April 10
2014 below-normal, 2013 & 2012 & 2011 above-normal, 2010 near-normal, 2009 & 2008 & 2007 & 2006 also above-normal
So the results from the SNOTEL sites match those from the snow courses quite well. The years from 2006-2014 have in general been above-normal for snowpack most years, with very few below-normal years, generally only 1 or 2 years at most sites, and in general the years from 1981 to 1996 are much worse at all of these sites, with a majority of below-normal years during that period. Therefore the conclusions stated earlier can be safely extended to the southernmost Washington Cascades.
Also for the sake of completeness, I'm going to show snowfall data from a couple of other low-elevation sites, which did not meet the criteria for inclusion in the initial study (too short a period of record or too low in elevation).
Reasonably high-quality snowfall data is available for Mazama (2170 ft) back to 1968-69, although unfortunately the huge 2007-8 season is missing completely, which artificially makes it look like recent averages were much lower than they actually are. It is likely that snowfall was close to 200" at Mazama that season based on correlations with Holden and Stehekin, while trying to add up data from the nearby Mazama NWAC site gives about 170", an inexact process which sets a minimum value for the snowfall that season. So I have inserted that value (the only estimated data added to any of this analysis!) so that the running averages are not erroneously skewed lower in recent years:
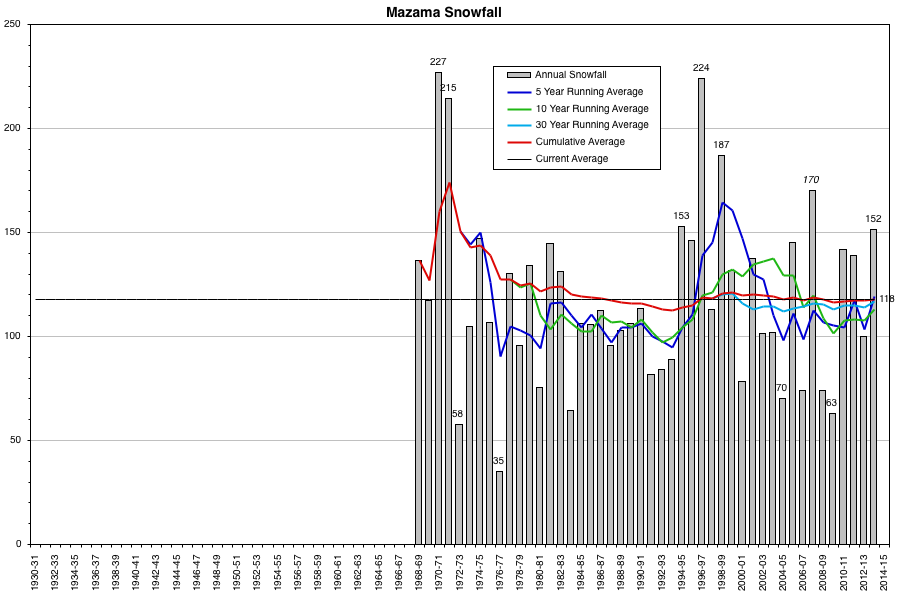
One site just below our elevation cutoff of 1500 ft also has fairly decent-quality snowfall data, a site listed as Stehekin 3 NW at WRCC or Stehekin 4 NW at NCDC . This site is located at the Company Creek powerhouse near 1270 ft about 4 miles NW of Stehekin itself, which is at the NW end of 50+ mile long Lake Chelan (view the location on the map at the NCDC link). Data at this site extends back to 1906, but as with Snoqualmie Pass, the snowfall data is very incomplete with many missing months prior to 1930. Also note that the exact location and elevation at which data has been recorded has shifted several times over the period of record (see Location History at the NCDC link), so the snowfall has definitely not been measured at the same place over the time period shown. So please take this data with a fairly large grain of salt, I am including it only because it is interesting and there are so few sites in the Cascades with any long-term snowfall data at all:
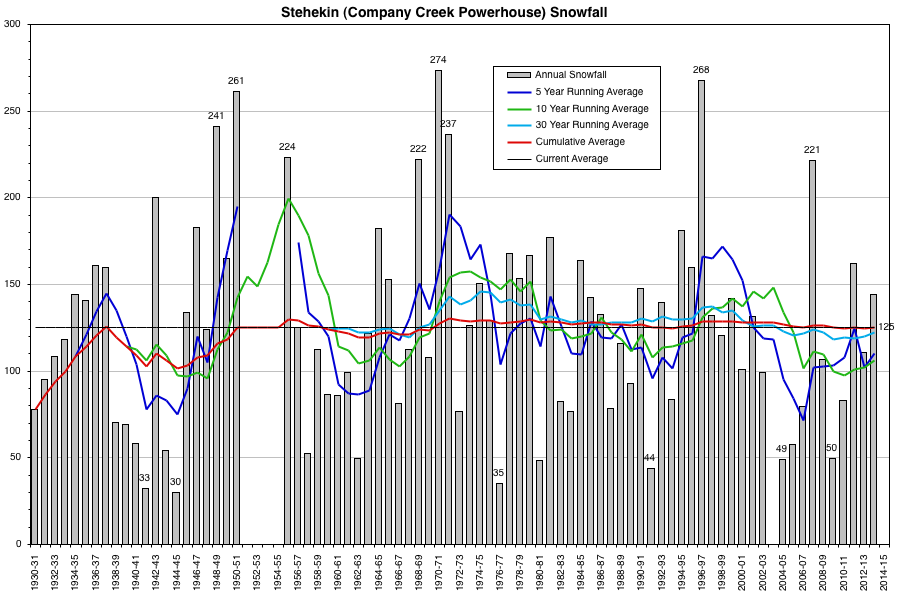
Interestingly, both of these sites have an average annual snowfall of about 120", but they are somewhat different climatologically despite both being located on the floor of deep glacial troughs on the east side of the North Cascades. Mazama is located 12 miles east of the Cascade Crest (Cutthroat Pass) and has an average annual precip of only 22" to produce its almost 120" average annual snowfall, while Stehekin Company Creek powerhouse is located 15 miles east of the Cascade Crest (Dome Peak area) but is nevertheless much farther west than Mazama (due to the Crest angling NE), and has an average annual precip of 34" to produce its 125" average annual snowfall. Annual snowfall at the two sites appears to be moderately well-correlated to each other, not unexpected given that they are located only 22 miles apart on the same side of the Cascades.
Overall, the snowfall data at these 2 sites shows roughly the same thing as Holden and the other 2 sites shown earlier in the original post, with no significant reduction in snowfall in recent years, and in fact greater snowfall recently compared to the 1977-1996 period. Those obsessed with the idea that snowfall must be decreasing at very low elevations in recent years may be able to find some (weak) ammunition to support their argument in the very noisy, extremely variable Stehekin data, however, the overall trend in that data since 1930 is certainly not negative.
It's great to see others taking up the cause and doing their own analysis of the data!
Careful Koda, you're falling into the same trap as the Mote papers mentioned above: you're seeing a false downward trend because that data set starts during a period of historically great snowpack, the golden age from the late 1940s to 1976. If that data extended back to before 1930, the earliest years from the mid-1920s to the mid-1940s would instead look terrible, comparable to the 1977-1996 dip, and far worse than the years since 1997. And your downward trend line would flatten out completely!
I'll attempt to respond to various other questions and comments at some point over the next few days.
For the sake of completeness, I decided to also check the data for relevant low-elevation SNOTEL sites in Washington, even though all were installed in 1978 or later and thus have less than the 40 year minimum period of record used for the snow course data above. So let's look at SNOTEL sites with at least 30 years of data, the bare minimum for addressing the central question of this thread (whether snowpack has been declining over the past 2-3 decades) and also the minimum for NRCS to calculate reliable values for normal snowpack and % of normal (they are currently using the 1981-2010 time frame). Note that relaxing the minimum required period from 40 to 30 years for the earlier analysis above would not have included any additional snow courses, as there are no active snow courses in the Cascades with less than 40 but more than 30 years of data.
This map shows all active snow courses and SNOTEL sites in Washington . There are 79 SNOTEL sites in Washington listed in the NRCS database, of which 75 are still active, only 32 of those have a period of record of over 30 years, and only 6 of those are at roughly 3500 ft or below in the Cascades (one of which at Fish Lake is located adjacent to the snow course listed above in Reply #1).
Low-elevation SNOTEL sites in Washington with at least 30 years of data:
site_name start enddate latitude longitude elev county
Pope Ridge (699) 1980-September active 47.99 -120.57 3590 Chelan
Spirit Lake (777) 1983-October active 46.26 -122.18 3520 Skamania
June Lake (553) 1980-December active 46.15 -122.15 3440 Skamania
Fish Lake (478) 1980-September active 47.54 -121.09 3430 Kittitas
Spencer Meadow (776) 1981-February active 46.18 -121.93 3400 Skamania
Cougar Mountain (420) 1980-September active 47.28 -121.67 3200 King
Looking at that table, one major benefit of including these 6 SNOTEL sites becomes obvious: 3 of them are located in the southernmost Washington Cascades near Mount Saint Helens, well south of any of the snow courses included in this study (which were very disproportionately located in the North Cascades), so they provide an important check on whether these results are consistent throughout the entire Washington Cascades. Here is the same type of quick analysis as was done for the snow courses, but including precip and snow-water statistics since these are available for SNOTEL sites:
Entiat River Road, west of Lake Chelan:
Pope Ridge (699) 3590 ft (1981-2015, snowdepth installed 1997)
Average annual precip of 34", median maximum SWE of 17" near March 20
2014 & 2013 near-normal, 2012 above-normal, 2011 & 2010 near-normal, 2009 below-normal, 2008 & 2007 & 2006 above-normal
Cle Elum River Road:
Fish Lake (478) 3430 ft (1983-2015, snowdepth installed 2000)
Average annual precip of 63", median maximum SWE of 30" near April 1
2014 & 2013 near-normal, 2012 & 2011 above-normal, 2010 below-normal, 2009 near-normal, 2008 & 2007 & 2006 above-normal
Green River north of SR 410:
Cougar Mountain (420) 3200 ft (1981-2015, snowdepth installed 2002)
Average annual precip of 97", median maximum SWE of 16" near March 5
2014 below-normal, 2013 & 2012 & 2011 above-normal, 2010 below-normal, 2009 & 2008 & 2006 above-normal, 2007 near-normal
North side of Mount Saint Helens:
Spirit Lake (777) 3520 ft (1984-2015, snowdepth installed 2005)
Extremely low snowpack site with extreme variability, due to strong rain-shadowing from Saint Helens and a total lack of tree cover in the 1980 eruption zone, it has only about half the precip and 10-15% of the snowpack at June Lake on the south side (and much worse than that by April).
Average annual precip of 88", median maximum SWE of 5" near March 5
2014 below-normal, 2013 & 2012 & 2011 above-normal, 2010 below-normal, 2009 & 2008 & 2007 & 2006 also above-normal
South side of Mount Saint Helens:
June Lake (553) 3440 ft (1984-2015, snowdepth installed 2003)
Average annual precip of 165" (the most of any SNOTEL site as far as I know), median maximum SWE of 38" near March 5
2014 below-normal, 2013 & 2012 & 2011 above-normal, 2010 near-normal, 2009 & 2008 & 2007 & 2006 also above-normal
Between Mount Saint Helens and Mount Adams:
Spencer Meadow (776) 3400 ft (1982-2015, snowdepth installed 2006)
Average annual precip of 100", median maximum SWE of 30" near April 10
2014 below-normal, 2013 & 2012 & 2011 above-normal, 2010 near-normal, 2009 & 2008 & 2007 & 2006 also above-normal
So the results from the SNOTEL sites match those from the snow courses quite well. The years from 2006-2014 have in general been above-normal for snowpack most years, with very few below-normal years, generally only 1 or 2 years at most sites, and in general the years from 1981 to 1996 are much worse at all of these sites, with a majority of below-normal years during that period. Therefore the conclusions stated earlier can be safely extended to the southernmost Washington Cascades.
Also for the sake of completeness, I'm going to show snowfall data from a couple of other low-elevation sites, which did not meet the criteria for inclusion in the initial study (too short a period of record or too low in elevation).
Reasonably high-quality snowfall data is available for Mazama (2170 ft) back to 1968-69, although unfortunately the huge 2007-8 season is missing completely, which artificially makes it look like recent averages were much lower than they actually are. It is likely that snowfall was close to 200" at Mazama that season based on correlations with Holden and Stehekin, while trying to add up data from the nearby Mazama NWAC site gives about 170", an inexact process which sets a minimum value for the snowfall that season. So I have inserted that value (the only estimated data added to any of this analysis!) so that the running averages are not erroneously skewed lower in recent years:
One site just below our elevation cutoff of 1500 ft also has fairly decent-quality snowfall data, a site listed as Stehekin 3 NW at WRCC or Stehekin 4 NW at NCDC . This site is located at the Company Creek powerhouse near 1270 ft about 4 miles NW of Stehekin itself, which is at the NW end of 50+ mile long Lake Chelan (view the location on the map at the NCDC link). Data at this site extends back to 1906, but as with Snoqualmie Pass, the snowfall data is very incomplete with many missing months prior to 1930. Also note that the exact location and elevation at which data has been recorded has shifted several times over the period of record (see Location History at the NCDC link), so the snowfall has definitely not been measured at the same place over the time period shown. So please take this data with a fairly large grain of salt, I am including it only because it is interesting and there are so few sites in the Cascades with any long-term snowfall data at all:
Interestingly, both of these sites have an average annual snowfall of about 120", but they are somewhat different climatologically despite both being located on the floor of deep glacial troughs on the east side of the North Cascades. Mazama is located 12 miles east of the Cascade Crest (Cutthroat Pass) and has an average annual precip of only 22" to produce its almost 120" average annual snowfall, while Stehekin Company Creek powerhouse is located 15 miles east of the Cascade Crest (Dome Peak area) but is nevertheless much farther west than Mazama (due to the Crest angling NE), and has an average annual precip of 34" to produce its 125" average annual snowfall. Annual snowfall at the two sites appears to be moderately well-correlated to each other, not unexpected given that they are located only 22 miles apart on the same side of the Cascades.
Overall, the snowfall data at these 2 sites shows roughly the same thing as Holden and the other 2 sites shown earlier in the original post, with no significant reduction in snowfall in recent years, and in fact greater snowfall recently compared to the 1977-1996 period. Those obsessed with the idea that snowfall must be decreasing at very low elevations in recent years may be able to find some (weak) ammunition to support their argument in the very noisy, extremely variable Stehekin data, however, the overall trend in that data since 1930 is certainly not negative.
Here is a quick plot of the snow-water equivalent data from Schreibers Meadow that Amar links above for January and May (chosen near the beginning and end of the time that there is a reasonable amount of data).
I don't see any shift towards deeper snowpack in May relative to January. Actually, if I look closely, it seems like the Jan. numbers are pretty steady, but the May numbers tend to be below average from ~1976 to ~1996 when the PDO index was mostly positive and above average for dates in this dataset before then when the PDO index was mostly negative. Feel free to repeat this analysis for all the other data....
It's great to see others taking up the cause and doing their own analysis of the data!
I see the dip in the May trend, but I also see a slight decline in the trend overall.
Careful Koda, you're falling into the same trap as the Mote papers mentioned above: you're seeing a false downward trend because that data set starts during a period of historically great snowpack, the golden age from the late 1940s to 1976. If that data extended back to before 1930, the earliest years from the mid-1920s to the mid-1940s would instead look terrible, comparable to the 1977-1996 dip, and far worse than the years since 1997. And your downward trend line would flatten out completely!
I'll attempt to respond to various other questions and comments at some point over the next few days.
Please Log in or Create an account to join the conversation.
- Koda
- [WayneH]
-
- Offline
- Junior Member
-
Less
More
- Posts: 166
- Thank you received: 0
16 Jan 2015 08:48 #223584
by Koda
Replied by Koda on topic Re: Has low-elevation Cascade snowpack been declining?
Good info Amar, so my guess is these relic memories of deep snowpack years stemmed from the 70’s roughly 2-4 generations ago. Coincidentally, isn’t that also the time when alpine bindings became mainstream? What Im getting at here is banner snow years plus huge technological ski development = a surge in snow sports and lasting fond memories that carried through into the 80’s where many gen-xers learned to ski.
Please Log in or Create an account to join the conversation.
- Floater
- [Floater]
-
- Offline
- New Member
-
Less
More
- Posts: 23
- Thank you received: 0
19 Jan 2015 05:52 #223603
by Floater
Replied by Floater on topic Re: Has low-elevation Cascade snowpack been declining?
I have to admit that my perceptions are biased by starting to ski seriously in the early 1960s (Yes I skied here in the 1950s as well as a young kid, ouch). I remember going on the ski bus to Stevens and in some of those amazing years looking at Skykomish and seeing the town buried in snow. Then one year around 1968 I can remember seeing North Bend (main highway went right through town) buried in snow on the way up to the Pass or going through Greenwater and seeing tons of snow there on the way to Crystal.
This gave me a distorted view of snowpacks in the Northwest. It also shows my age. I am just way too old. Yes I skied the Golden Years and yes we used Look Nevada bindings and Head metal skis with long thongs and double leather boots and stretch pants. Yep 200 cm either Head Standards, Masters or Comps. I can remember skiing down to Tunnel Creek from 7th as well and catching a ride at the hairpin back up to the pass and in those days we never carried beacons or for that matter a pack. We did ask the ski patrol and pick and choose our days but I can remember skiing back there and seeing some big nasty slides. Sometimes the patrol would ski along with you. Damn lucky to still be skiing is all I can say.
This gave me a distorted view of snowpacks in the Northwest. It also shows my age. I am just way too old. Yes I skied the Golden Years and yes we used Look Nevada bindings and Head metal skis with long thongs and double leather boots and stretch pants. Yep 200 cm either Head Standards, Masters or Comps. I can remember skiing down to Tunnel Creek from 7th as well and catching a ride at the hairpin back up to the pass and in those days we never carried beacons or for that matter a pack. We did ask the ski patrol and pick and choose our days but I can remember skiing back there and seeing some big nasty slides. Sometimes the patrol would ski along with you. Damn lucky to still be skiing is all I can say.
Please Log in or Create an account to join the conversation.
- Amar Andalkar
- [andalkar]
-
Topic Author
- Offline
- Premium Member
-
Less
More
- Posts: 635
- Thank you received: 0
19 Jan 2015 09:36 - 22 Jan 2015 09:49 #223604
by Amar Andalkar
Replied by Amar Andalkar on topic Re: Has low-elevation Cascade snowpack been declining?
Well, the answer to this thread's title seems clear beyond a reasonable doubt at least in Washington, based on all the data in the posts above -- but what about Oregon? After pondering and analyzing and writing about this subject so much for the past 2 weeks, it seems natural to take a look at our southern neighbor while all this work is still fresh in my mind.
Has the low-elevation snowpack in the Oregon Cascades been declining over the past 2-3 decades??
First of all, let's review the snow climatology of the Oregon Cascades as essential background before looking at the data:
The 250-mile north-south extent of the Oregon Cascades forms a transition zone between two very different climatic regimes, a smooth gradient connecting the cooler and wetter "Pacific Northwet" climate zone (which extends from Washington north through coastal BC and into southeast Alaska) with the warmer and sunnier Mediterranean-type climate zone which covers much of California. Snowfall and snowpack in the Pacific Northwest zone has very strong positive correlations to the cool phase of both the ENSO (La Nina) and PDO cycles as discussed above in the first post, while in California the snowfall and snowpack (and precip) has very strong positive correlations to the warm phase of the ENSO cycle (El Nino), but has uncertain correlations to PDO (probably not well correlated, but I'm not sure if this has been studied much at all).
The northern Oregon Cascades (the northern 1/3 from the Columbia Gorge past Mount Hood south to Mount Jefferson and Santiam Pass) are very similar climatologically to the southern Washington Cascades (which extend from just south of Snoqualmie Pass to the Columbia Gorge including Mounts Rainier, Adams, and Saint Helens). Also similarly, the east side of the northern Oregon Cascades features a substantial deep basin (the Columbia Basin) with elevations of typically 1000-2000 ft, just like the east side of the southern and central Washington Cascades.
The southern Oregon Cascades (the southern 1/3 from the Klamath River at the California border, north past Mount McLoughlin, Crater Lake, and Mount Thielsen) are fairly similar climatologically to the California Cascades (which extend from the Klamath River south through Mount Shasta and Lassen Peak to the northern edge of the Sierra Nevada at Lake Almanor and the North Fork Feather River). The southern Oregon Cascades are much drier and sunnier than the northern Oregon Cascades, and the southernmost part (from about Mount McLoughlin south) is substantially rain-shadowed by the 7000+ ft peaks of the Siskiyou Mountains to their west and southwest.
In between south and north, the central Oregon Cascades (from Santiam Pass through the Three Sisters group south to Diamond Peak) form the heart of the climatic transition zone. The east side of both the central and southern Oregon Cascades features a substantial high plateau (the High Desert) ranging from about 3000-5000 ft, very similar to the California Cascades (with the Modoc Plateau to their east) in that regard.
Just as in Washington, a very sharp east-west climatic separation also occurs along the crest of the Oregon Cascades, with generous annual precip of up to 100-140" along the wet west slopes (highest in the northern part) and a rain-shadowed semi-desert with meager annual precip of barely 10-20" along the dry east slopes and the adjacent High Desert plateau. The west side of both the southern and central Oregon Cascades (and extending partway along the northern Oregon Cascades) also includes a substantial region of lower, older foothills known as the Western Cascades, which extend far west of the crest.
Based on these known climatological factors, we can try to guess what to expect when we look at the data here. For the northern Oregon Cascades, we should expect to find results similar to those of Washington, with near-normal snowpacks in recent years and strong correlation to the PDO cycle. For the southern Oregon Cascades, the situation is likely to be somewhat different, as the effects of the current historically-unprecedented California drought (already 3 full years, and very possibly heading into a fourth) have definitely now extended north into this region. As for the central Oregon Cascades, it's hard to say which way it might lean (closer to northern or southern) during the recent time period or what its historic trends might look like. Let's analyze some relevant data and try to find out.
What low-elevation snow data exists for Oregon?
Once again, we need to define "low-elevation" in this case. Using a similar methodology to Washington, the lower limit of useful snow data is about 2000-2500 ft in the north and 3000-3500 ft in the south, as extreme random variation dominates the snow data at sites below that level. The top of the low-elevation band extends up to about 4500 ft, which includes the lowest passes across the Cascade Crest in Oregon (all between Mount Hood and Olallie Butte, including Barlow Pass, Wapinitia Pass, Abbot Pass, etc.) while excluding all other Cascade Crest passes farther south through the California border. Therefore we'll consider data from about 2500-4500 ft as low-elevation for snowfall and snowpack data in Oregon, while 4500-6500 ft would be considered mid-elevation, and 6500-8000 ft are the highest elevations at which such data is available. Just as in Washington (where each band is about 1000 ft lower), the mid-elevation band contains the overwhelming majority of snowpack measurement sites, with far fewer in the low or especially the high elevation ranges.
At low elevations of 2500-4500 ft that we are considering, and even looking for data that only extends back at least 35-40 years, there are barely a handful of sites in the Oregon Cascades with reasonably complete snowfall and snowdepth data over that period (if there are any other such sites, I have not found them thus far). Thankfully, through pure chance these 5 sites are nicely distributed over the entire length of the Oregon Cascades:
Government Camp 3980 ft 45.30 -121.74 on the south side of Mount Hood
Marion Forks Fish Hatchery 2480 ft 44.61 -121.95 west of Mount Jefferson
Wickiup Dam 4360 ft 43.68 -121.69 south of Mount Bachelor
Lemolo Lake 3 NNW 4080 ft 43.36 -122.22 near Diamond Lake
Howard Prairie Dam 4570 ft 42.23 -122.38 south of Mount McLoughlin
Here are plots of the snowfall data at these 5 sites with several running averages superimposed (data from WRCC and NCDC ):
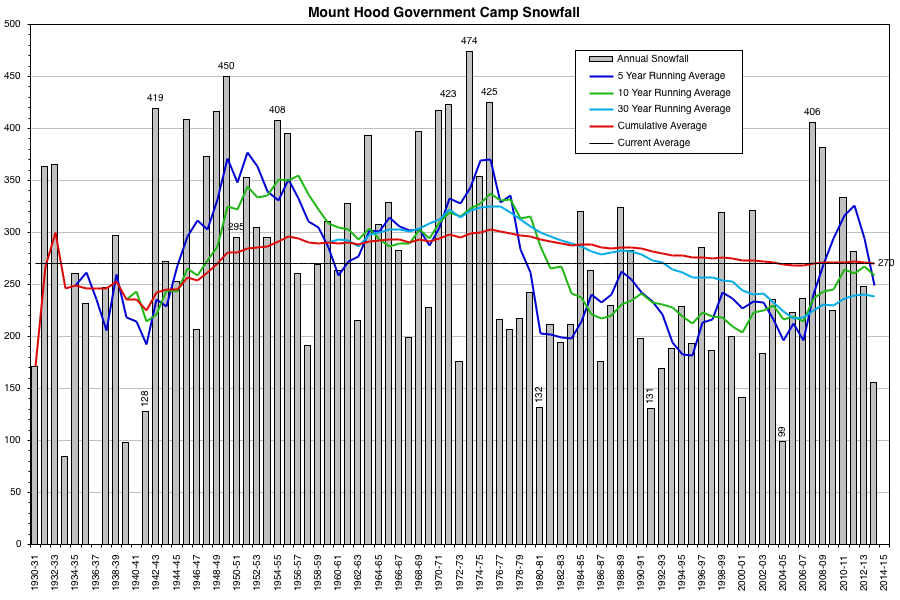
Government Camp (3980 ft) is located on the southern flanks of Mount Hood, about 6 miles SSW of the summit and 3 miles west of the Cascade Crest (which goes up the south side of Hood just west of the White River drainage). It has an average annual precip of 88" to produce its 270" average annual snowfall, which is less than half the average annual snowfall of over 550" with 110" of precip recorded at Timberline Lodge (5900 ft), about halfway from Govy to the summit. Government Camp has one of the longest historical climate records of any mountain location in the entire Cascade Range, with weather records including snowfall and snowdepth extending back to 1895. The current Government Camp site has data back to 1951, while prior to that from 1895-1951 the records are listed under "Summit Guard Station" with the same coordinates and an elevation of 3900 ft, so the snowfall may not have been recorded at the same exact location. Note that prior to 1941, the annual snowfall totals shown above only include data from November through March, so the annual snowfall is being under-reported by roughly 10-15% on average due to missing April (which averages about 26" for the month) and October and May (which each average about 6"). I considered leaving those years out of the plot, but decided to include them with that disclaimer.
Overall, the snowfall data for Government Camp looks very similar to that from Longmire (to which it appears to be quite well-correlated) and Snoqualmie Pass in the Washington Cascades, with recent years generally having above-normal snowfall following a low period from 1977-1996, which was preceded by well above-normal snowfall from the mid-1940s through 1976. Just as expected from the basic climatology of the northern Oregon Cascades discussed above.
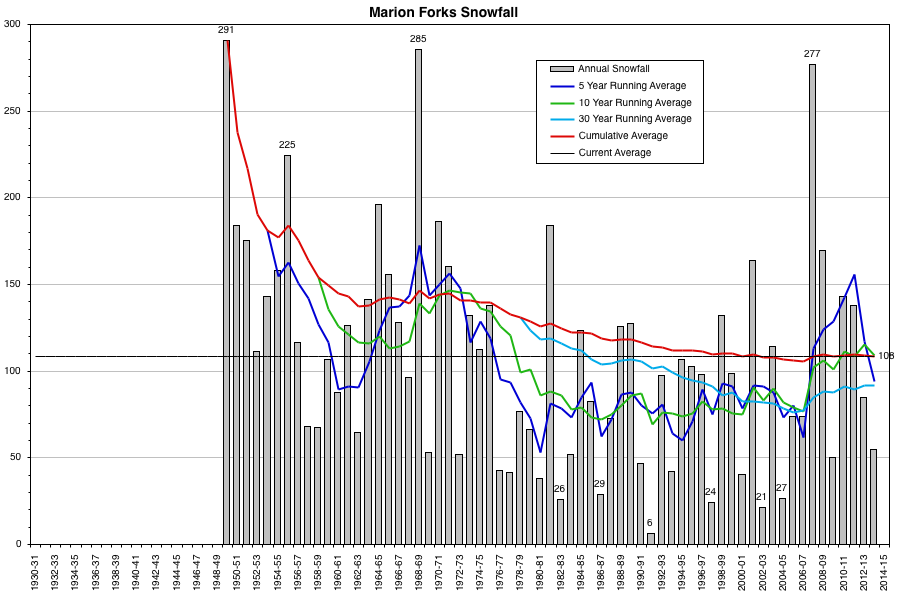
The Marion Forks Fish Hatchery (2480 ft) is located on the floor of a large glacial trough which extends down from Marion Lake into the North Santiam River valley, about 8 miles WSW of the summit of Mount Jefferson and 7 miles west of the Cascade Crest. It has an average annual precip of 70" to produce its 110" average annual snowfall, but its very low elevation results in extreme variability in the snowfall numbers, with annual totals spanning an almost unbelievable range from nearly 300" in the biggest years to only 6" in the record low year, a factor of almost 50 from highest to lowest! Despite that variability, the long-term pattern is fairly similar to that of Government Camp and the Washington Cascades, with the past 9 years being much better than 1977-2005, and a period of generally larger snowfalls before that.
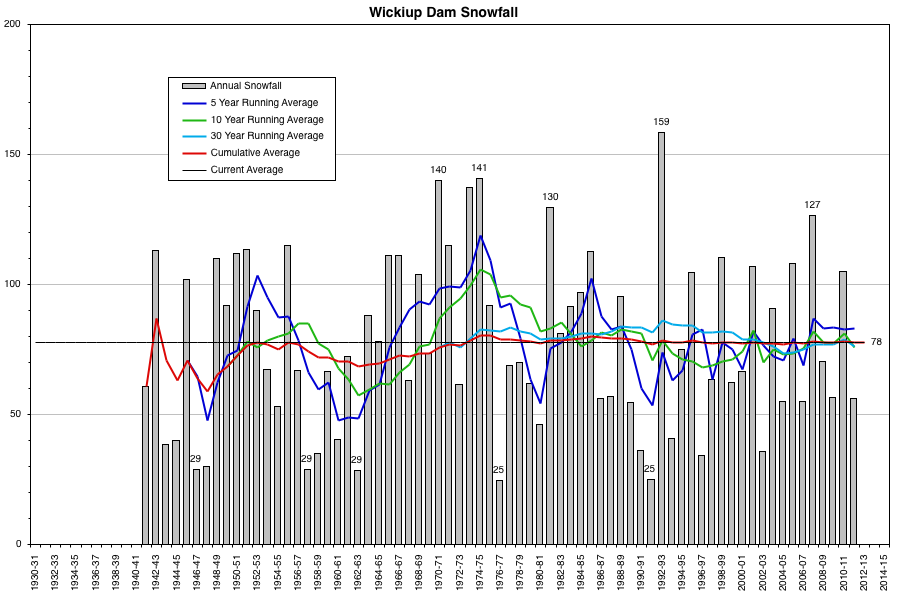
Wickiup Dam (4360 ft) is located well out on the dry eastern flank of the central Oregon Cascades, about 14 miles east of Maiden Peak on the Cascade Crest near Willamette Pass and 20 miles south of Mount Bachelor. With an average annual precip of only 20" to produce its almost 80" average annual snowfall, this is clearly in a very different climate than either of the preceding 2 sites. The pattern of snowfall years reflects this difference, as it looks nothing like those 2 sites or any of the 5 sites graphed in Washington. Quite interestingly, it shows almost no long-term trends at all, with its large annual variations superimposed on a nearly flat long-term average, perhaps even with a very slight upward trend if at all. Unfortunately, data for the past 2 years is very spotty and largely missing, so it is unclear if the high-quality snow data from this site will continue or not.
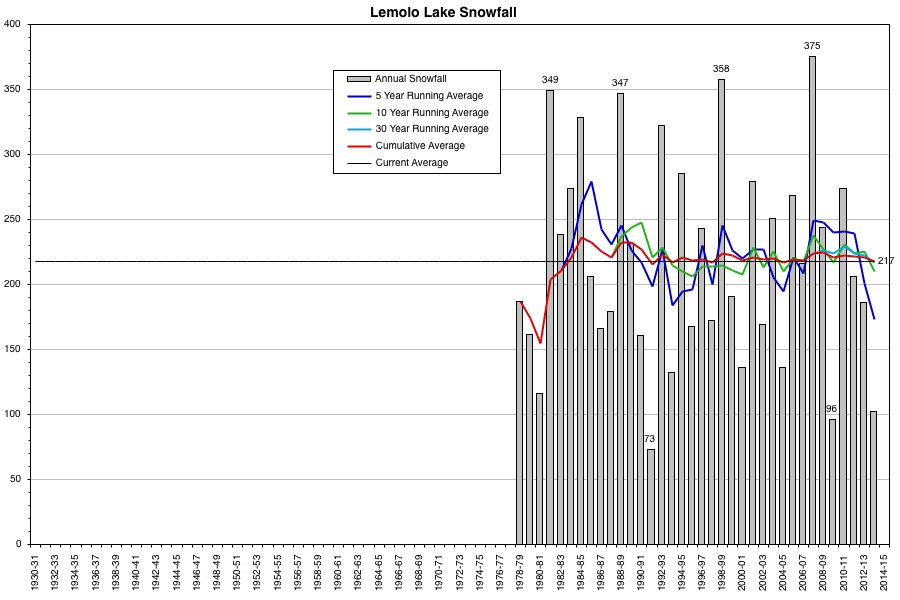
The Lemolo Lake 3 NNW site (4080 ft) is located 3 miles NW of Lemolo Lake, about 9 miles west of Windigo Pass on the Cascade Crest, about 12 miles SSW of Diamond Peak and 12 miles NNW of Diamond Lake. Although only about 35 miles SW of Wickiup Dam, it is in a much wetter climate on the west side of the range, with an average annual precip of 65" to produce its almost 220" average annual snowfall. Over its fairly short 36-year period of record, this site also shows almost no long-term trends at all, although the past 3 seasons have all been below normal due to the effects of the California drought extending north into this part of the southern Oregon Cascades.
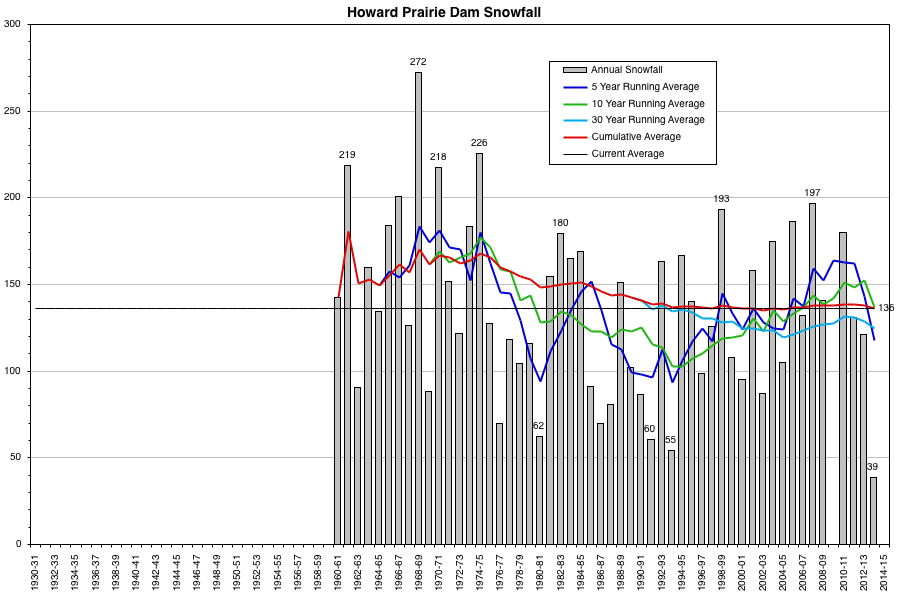
Howard Prairie Dam (4570 ft) is located about 15 miles SSW of Mount McLoughlin and 15 miles north of the California border, about 9 miles west of the Cascade Crest. Despite being west of the Crest, due to rain-shadowing from the 7000+ ft peaks of the Siskiyou Mountains to the west and southwest, this is a much drier climate than areas farther north like Lemolo Lake, with an average annual precip of 32" to produce its almost 140" average annual snowfall. Although a strong downward long-term trend is not clear, there are definitely more medium-term ups and downs than either of the previous 2 sites, and once again the past 3 seasons have all been below normal due to the effects of the California drought, with 2013-14 sadly posting the all-time record low snowfall at this site over its 50+ year period of record.
For an interesting comparison with the low-elevation sites, here is the data from a much higher elevation site at Crater Lake over the same time period (this plot added on 22Jan2015):
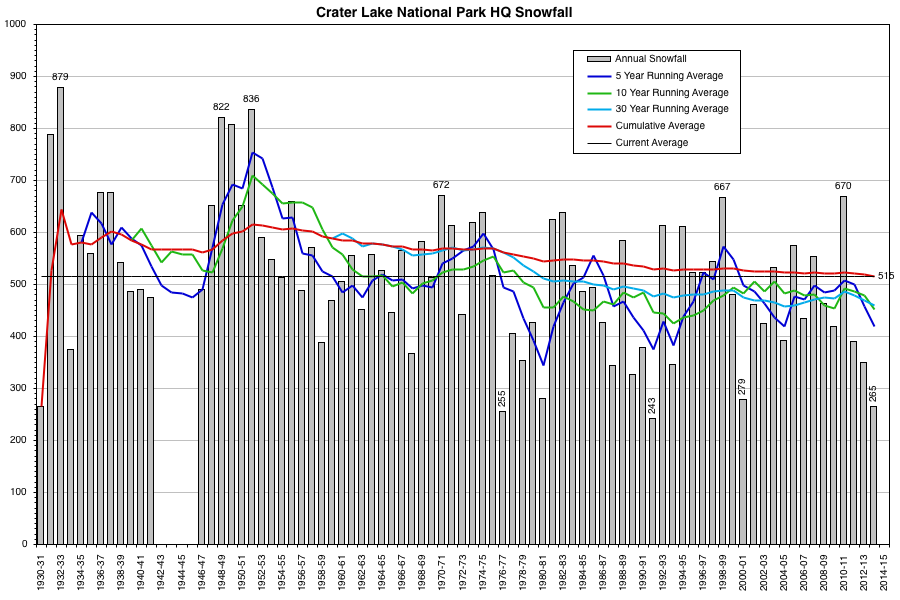
As mentioned in the original post above, Crater Lake National Park Headquarters (6470 ft) in southern Oregon is one of only 2 mid-high elevation sites in the entire Cascade Range with snowfall and snowdepth data extending back for over 90 years. It is far snowier than any other site in southern Oregon, with an average annual precip of 65" to produce its 515" average annual snowfall. The data from Crater Lake clearly shows more of an overall downward trend in snowfall over the entire period back to 1930 than any of the low elevation sites in Washington or Oregon which have snowfall data that far back, a strange situation for which I have found no good explanation. However, snowfall totals in recent years are somewhat better than during the 1977-1992 period.
Low-elevation snowpack data:
As with Washington, there are many more sites in Oregon with snowpack data than with the harder-to-measure snowfall, although only a small fraction of snowpack sites are still active and at low elevation. In order to get an adequately large data set, we will need to include all active sites (both snow courses and SNOTEL) with at least 30 years of data. This map shows all active snow courses and SNOTEL sites in Oregon .
Out of 317 total snow courses in Oregon listed in the NRCS database, only 72 are still active and being measured , 65 of those have a period of record of over 30 years, and only 17 of those are at roughly 4500 ft or below in the Cascades. There are 82 SNOTEL sites in Oregon listed in the NRCS database, of which 81 are still active, 70 of those have a period of record of over 30 years, and only 17 of those are at roughly 4500 ft or below in the Cascades. Unlike the Washington data, both snow courses and SNOTEL sites in the Oregon Cascades are combined in a single list here, and will be analyzed together.
Low-elevation snow courses (with alphanumeric IDs) and SNOTEL sites (3-digit numbers) in the Oregon Cascades with at least 30 years of data, sorted by latitude from north to south:
site_name start enddate latitude longitude elev county
Greenpoint (504) 1978-October active 45.62 -121.70 3310 Hood River
North Fork (666) 1978-October active 45.55 -122.00 3060 Multnomah
Red Hill (712) 1978-October active 45.46 -121.70 4410 Hood River
Mill Creek Meadow (21D39) 1985-January active 45.45 -121.52 4400 Hood River
Blazed Alder (351) 1980-June active 45.43 -121.86 3650 Clackamas
Mud Ridge (655) 1978-October active 45.25 -121.74 4070 Clackamas
Clear Lake (401) 1980-June active 45.19 -121.69 3810 Wasco
Clackamas Lake (398) 1980-June active 45.10 -121.75 3400 Clackamas
Beaver Creek #1 (21D36) 1982-February active 45.10 -121.61 4210 Wasco
Beaver Creek #2 (21D37) 1982-February active 45.10 -121.61 4220 Wasco
Peavine Ridge (687) 1980-June active 45.04 -121.93 3420 Clackamas
Little Meadows (584) 1978-December active 44.61 -122.23 4020 Linn
Marion Forks (614) 1980-July active 44.59 -121.97 2590 Linn
Daly Lake (434) 1978-December active 44.52 -122.09 3690 Linn
Santiam Jct. (733) 1978-October active 44.44 -121.95 3740 Linn
Jump Off Joe (552) 1978-October active 44.39 -122.17 3520 Linn
Hungry Flat (21F04) 1952-February active 43.99 -121.44 4400 Deschutes
Railroad Overpass (710) 1981-July active 43.66 -122.21 2680 Lane
Salt Creek Falls (729) 1980-July active 43.61 -122.12 4220 Lane
North Umpqua (22F16) 1937-February active 43.31 -122.16 4200 Douglas
Trap Creek (22F17) 1937-February active 43.25 -122.29 3830 Douglas
Red Butte 4 (22F26) 1961-March active 43.20 -122.85 3000 Douglas
Red Butte 3 (22F25) 1961-January active 43.20 -122.87 3500 Douglas
Red Butte 2 (22F24) 1960-January active 43.19 -122.86 4050 Douglas
Red Butte 1 (22F23) 1960-January active 43.17 -122.88 4460 Douglas
Silver Burn (22G02) 1937-March active 42.93 -122.40 3680 Jackson
King Mountain 4 (23G11) 1967-February active 42.75 -123.18 3050 Jackson
King Mountain 3 (23G10) 1961-January active 42.74 -123.17 3680 Jackson
King Mountain 1 (23G08) 1961-January active 42.72 -123.20 4760 Jackson
King Mountain (558) 1980-June active 42.72 -123.20 4340 Jackson
Fish Lk. (479) 1980-June active 42.38 -122.35 4660 Jackson
Deadwood Junction (22G27) 1960-January active 42.29 -122.38 4660 Jackson
Howard Prairie (22G26) 1959-January active 42.21 -122.37 4580 Jackson
Siskiyou Summit Rev. (22G35) 1932-January active 42.07 -122.61 4560 Jackson
It works out nicely that the highest of our "low-elevation" sites are all located at the southernmost end of the Oregon Cascades, where it makes the most sense to include slightly higher elevations in the low-elevation band.
Continued in next post, exceeded 20,000 character limit AGAIN . . .
Has the low-elevation snowpack in the Oregon Cascades been declining over the past 2-3 decades??
First of all, let's review the snow climatology of the Oregon Cascades as essential background before looking at the data:
The 250-mile north-south extent of the Oregon Cascades forms a transition zone between two very different climatic regimes, a smooth gradient connecting the cooler and wetter "Pacific Northwet" climate zone (which extends from Washington north through coastal BC and into southeast Alaska) with the warmer and sunnier Mediterranean-type climate zone which covers much of California. Snowfall and snowpack in the Pacific Northwest zone has very strong positive correlations to the cool phase of both the ENSO (La Nina) and PDO cycles as discussed above in the first post, while in California the snowfall and snowpack (and precip) has very strong positive correlations to the warm phase of the ENSO cycle (El Nino), but has uncertain correlations to PDO (probably not well correlated, but I'm not sure if this has been studied much at all).
The northern Oregon Cascades (the northern 1/3 from the Columbia Gorge past Mount Hood south to Mount Jefferson and Santiam Pass) are very similar climatologically to the southern Washington Cascades (which extend from just south of Snoqualmie Pass to the Columbia Gorge including Mounts Rainier, Adams, and Saint Helens). Also similarly, the east side of the northern Oregon Cascades features a substantial deep basin (the Columbia Basin) with elevations of typically 1000-2000 ft, just like the east side of the southern and central Washington Cascades.
The southern Oregon Cascades (the southern 1/3 from the Klamath River at the California border, north past Mount McLoughlin, Crater Lake, and Mount Thielsen) are fairly similar climatologically to the California Cascades (which extend from the Klamath River south through Mount Shasta and Lassen Peak to the northern edge of the Sierra Nevada at Lake Almanor and the North Fork Feather River). The southern Oregon Cascades are much drier and sunnier than the northern Oregon Cascades, and the southernmost part (from about Mount McLoughlin south) is substantially rain-shadowed by the 7000+ ft peaks of the Siskiyou Mountains to their west and southwest.
In between south and north, the central Oregon Cascades (from Santiam Pass through the Three Sisters group south to Diamond Peak) form the heart of the climatic transition zone. The east side of both the central and southern Oregon Cascades features a substantial high plateau (the High Desert) ranging from about 3000-5000 ft, very similar to the California Cascades (with the Modoc Plateau to their east) in that regard.
Just as in Washington, a very sharp east-west climatic separation also occurs along the crest of the Oregon Cascades, with generous annual precip of up to 100-140" along the wet west slopes (highest in the northern part) and a rain-shadowed semi-desert with meager annual precip of barely 10-20" along the dry east slopes and the adjacent High Desert plateau. The west side of both the southern and central Oregon Cascades (and extending partway along the northern Oregon Cascades) also includes a substantial region of lower, older foothills known as the Western Cascades, which extend far west of the crest.
Based on these known climatological factors, we can try to guess what to expect when we look at the data here. For the northern Oregon Cascades, we should expect to find results similar to those of Washington, with near-normal snowpacks in recent years and strong correlation to the PDO cycle. For the southern Oregon Cascades, the situation is likely to be somewhat different, as the effects of the current historically-unprecedented California drought (already 3 full years, and very possibly heading into a fourth) have definitely now extended north into this region. As for the central Oregon Cascades, it's hard to say which way it might lean (closer to northern or southern) during the recent time period or what its historic trends might look like. Let's analyze some relevant data and try to find out.
What low-elevation snow data exists for Oregon?
Once again, we need to define "low-elevation" in this case. Using a similar methodology to Washington, the lower limit of useful snow data is about 2000-2500 ft in the north and 3000-3500 ft in the south, as extreme random variation dominates the snow data at sites below that level. The top of the low-elevation band extends up to about 4500 ft, which includes the lowest passes across the Cascade Crest in Oregon (all between Mount Hood and Olallie Butte, including Barlow Pass, Wapinitia Pass, Abbot Pass, etc.) while excluding all other Cascade Crest passes farther south through the California border. Therefore we'll consider data from about 2500-4500 ft as low-elevation for snowfall and snowpack data in Oregon, while 4500-6500 ft would be considered mid-elevation, and 6500-8000 ft are the highest elevations at which such data is available. Just as in Washington (where each band is about 1000 ft lower), the mid-elevation band contains the overwhelming majority of snowpack measurement sites, with far fewer in the low or especially the high elevation ranges.
At low elevations of 2500-4500 ft that we are considering, and even looking for data that only extends back at least 35-40 years, there are barely a handful of sites in the Oregon Cascades with reasonably complete snowfall and snowdepth data over that period (if there are any other such sites, I have not found them thus far). Thankfully, through pure chance these 5 sites are nicely distributed over the entire length of the Oregon Cascades:
Government Camp 3980 ft 45.30 -121.74 on the south side of Mount Hood
Marion Forks Fish Hatchery 2480 ft 44.61 -121.95 west of Mount Jefferson
Wickiup Dam 4360 ft 43.68 -121.69 south of Mount Bachelor
Lemolo Lake 3 NNW 4080 ft 43.36 -122.22 near Diamond Lake
Howard Prairie Dam 4570 ft 42.23 -122.38 south of Mount McLoughlin
Here are plots of the snowfall data at these 5 sites with several running averages superimposed (data from WRCC and NCDC ):
Government Camp (3980 ft) is located on the southern flanks of Mount Hood, about 6 miles SSW of the summit and 3 miles west of the Cascade Crest (which goes up the south side of Hood just west of the White River drainage). It has an average annual precip of 88" to produce its 270" average annual snowfall, which is less than half the average annual snowfall of over 550" with 110" of precip recorded at Timberline Lodge (5900 ft), about halfway from Govy to the summit. Government Camp has one of the longest historical climate records of any mountain location in the entire Cascade Range, with weather records including snowfall and snowdepth extending back to 1895. The current Government Camp site has data back to 1951, while prior to that from 1895-1951 the records are listed under "Summit Guard Station" with the same coordinates and an elevation of 3900 ft, so the snowfall may not have been recorded at the same exact location. Note that prior to 1941, the annual snowfall totals shown above only include data from November through March, so the annual snowfall is being under-reported by roughly 10-15% on average due to missing April (which averages about 26" for the month) and October and May (which each average about 6"). I considered leaving those years out of the plot, but decided to include them with that disclaimer.
Overall, the snowfall data for Government Camp looks very similar to that from Longmire (to which it appears to be quite well-correlated) and Snoqualmie Pass in the Washington Cascades, with recent years generally having above-normal snowfall following a low period from 1977-1996, which was preceded by well above-normal snowfall from the mid-1940s through 1976. Just as expected from the basic climatology of the northern Oregon Cascades discussed above.
The Marion Forks Fish Hatchery (2480 ft) is located on the floor of a large glacial trough which extends down from Marion Lake into the North Santiam River valley, about 8 miles WSW of the summit of Mount Jefferson and 7 miles west of the Cascade Crest. It has an average annual precip of 70" to produce its 110" average annual snowfall, but its very low elevation results in extreme variability in the snowfall numbers, with annual totals spanning an almost unbelievable range from nearly 300" in the biggest years to only 6" in the record low year, a factor of almost 50 from highest to lowest! Despite that variability, the long-term pattern is fairly similar to that of Government Camp and the Washington Cascades, with the past 9 years being much better than 1977-2005, and a period of generally larger snowfalls before that.
Wickiup Dam (4360 ft) is located well out on the dry eastern flank of the central Oregon Cascades, about 14 miles east of Maiden Peak on the Cascade Crest near Willamette Pass and 20 miles south of Mount Bachelor. With an average annual precip of only 20" to produce its almost 80" average annual snowfall, this is clearly in a very different climate than either of the preceding 2 sites. The pattern of snowfall years reflects this difference, as it looks nothing like those 2 sites or any of the 5 sites graphed in Washington. Quite interestingly, it shows almost no long-term trends at all, with its large annual variations superimposed on a nearly flat long-term average, perhaps even with a very slight upward trend if at all. Unfortunately, data for the past 2 years is very spotty and largely missing, so it is unclear if the high-quality snow data from this site will continue or not.
The Lemolo Lake 3 NNW site (4080 ft) is located 3 miles NW of Lemolo Lake, about 9 miles west of Windigo Pass on the Cascade Crest, about 12 miles SSW of Diamond Peak and 12 miles NNW of Diamond Lake. Although only about 35 miles SW of Wickiup Dam, it is in a much wetter climate on the west side of the range, with an average annual precip of 65" to produce its almost 220" average annual snowfall. Over its fairly short 36-year period of record, this site also shows almost no long-term trends at all, although the past 3 seasons have all been below normal due to the effects of the California drought extending north into this part of the southern Oregon Cascades.
Howard Prairie Dam (4570 ft) is located about 15 miles SSW of Mount McLoughlin and 15 miles north of the California border, about 9 miles west of the Cascade Crest. Despite being west of the Crest, due to rain-shadowing from the 7000+ ft peaks of the Siskiyou Mountains to the west and southwest, this is a much drier climate than areas farther north like Lemolo Lake, with an average annual precip of 32" to produce its almost 140" average annual snowfall. Although a strong downward long-term trend is not clear, there are definitely more medium-term ups and downs than either of the previous 2 sites, and once again the past 3 seasons have all been below normal due to the effects of the California drought, with 2013-14 sadly posting the all-time record low snowfall at this site over its 50+ year period of record.
For an interesting comparison with the low-elevation sites, here is the data from a much higher elevation site at Crater Lake over the same time period (this plot added on 22Jan2015):
As mentioned in the original post above, Crater Lake National Park Headquarters (6470 ft) in southern Oregon is one of only 2 mid-high elevation sites in the entire Cascade Range with snowfall and snowdepth data extending back for over 90 years. It is far snowier than any other site in southern Oregon, with an average annual precip of 65" to produce its 515" average annual snowfall. The data from Crater Lake clearly shows more of an overall downward trend in snowfall over the entire period back to 1930 than any of the low elevation sites in Washington or Oregon which have snowfall data that far back, a strange situation for which I have found no good explanation. However, snowfall totals in recent years are somewhat better than during the 1977-1992 period.
Low-elevation snowpack data:
As with Washington, there are many more sites in Oregon with snowpack data than with the harder-to-measure snowfall, although only a small fraction of snowpack sites are still active and at low elevation. In order to get an adequately large data set, we will need to include all active sites (both snow courses and SNOTEL) with at least 30 years of data. This map shows all active snow courses and SNOTEL sites in Oregon .
Out of 317 total snow courses in Oregon listed in the NRCS database, only 72 are still active and being measured , 65 of those have a period of record of over 30 years, and only 17 of those are at roughly 4500 ft or below in the Cascades. There are 82 SNOTEL sites in Oregon listed in the NRCS database, of which 81 are still active, 70 of those have a period of record of over 30 years, and only 17 of those are at roughly 4500 ft or below in the Cascades. Unlike the Washington data, both snow courses and SNOTEL sites in the Oregon Cascades are combined in a single list here, and will be analyzed together.
Low-elevation snow courses (with alphanumeric IDs) and SNOTEL sites (3-digit numbers) in the Oregon Cascades with at least 30 years of data, sorted by latitude from north to south:
site_name start enddate latitude longitude elev county
Greenpoint (504) 1978-October active 45.62 -121.70 3310 Hood River
North Fork (666) 1978-October active 45.55 -122.00 3060 Multnomah
Red Hill (712) 1978-October active 45.46 -121.70 4410 Hood River
Mill Creek Meadow (21D39) 1985-January active 45.45 -121.52 4400 Hood River
Blazed Alder (351) 1980-June active 45.43 -121.86 3650 Clackamas
Mud Ridge (655) 1978-October active 45.25 -121.74 4070 Clackamas
Clear Lake (401) 1980-June active 45.19 -121.69 3810 Wasco
Clackamas Lake (398) 1980-June active 45.10 -121.75 3400 Clackamas
Beaver Creek #1 (21D36) 1982-February active 45.10 -121.61 4210 Wasco
Beaver Creek #2 (21D37) 1982-February active 45.10 -121.61 4220 Wasco
Peavine Ridge (687) 1980-June active 45.04 -121.93 3420 Clackamas
Little Meadows (584) 1978-December active 44.61 -122.23 4020 Linn
Marion Forks (614) 1980-July active 44.59 -121.97 2590 Linn
Daly Lake (434) 1978-December active 44.52 -122.09 3690 Linn
Santiam Jct. (733) 1978-October active 44.44 -121.95 3740 Linn
Jump Off Joe (552) 1978-October active 44.39 -122.17 3520 Linn
Hungry Flat (21F04) 1952-February active 43.99 -121.44 4400 Deschutes
Railroad Overpass (710) 1981-July active 43.66 -122.21 2680 Lane
Salt Creek Falls (729) 1980-July active 43.61 -122.12 4220 Lane
North Umpqua (22F16) 1937-February active 43.31 -122.16 4200 Douglas
Trap Creek (22F17) 1937-February active 43.25 -122.29 3830 Douglas
Red Butte 4 (22F26) 1961-March active 43.20 -122.85 3000 Douglas
Red Butte 3 (22F25) 1961-January active 43.20 -122.87 3500 Douglas
Red Butte 2 (22F24) 1960-January active 43.19 -122.86 4050 Douglas
Red Butte 1 (22F23) 1960-January active 43.17 -122.88 4460 Douglas
Silver Burn (22G02) 1937-March active 42.93 -122.40 3680 Jackson
King Mountain 4 (23G11) 1967-February active 42.75 -123.18 3050 Jackson
King Mountain 3 (23G10) 1961-January active 42.74 -123.17 3680 Jackson
King Mountain 1 (23G08) 1961-January active 42.72 -123.20 4760 Jackson
King Mountain (558) 1980-June active 42.72 -123.20 4340 Jackson
Fish Lk. (479) 1980-June active 42.38 -122.35 4660 Jackson
Deadwood Junction (22G27) 1960-January active 42.29 -122.38 4660 Jackson
Howard Prairie (22G26) 1959-January active 42.21 -122.37 4580 Jackson
Siskiyou Summit Rev. (22G35) 1932-January active 42.07 -122.61 4560 Jackson
It works out nicely that the highest of our "low-elevation" sites are all located at the southernmost end of the Oregon Cascades, where it makes the most sense to include slightly higher elevations in the low-elevation band.
Continued in next post, exceeded 20,000 character limit AGAIN . . .
Please Log in or Create an account to join the conversation.
- Amar Andalkar
- [andalkar]
-
Topic Author
- Offline
- Premium Member
-
Less
More
- Posts: 635
- Thank you received: 0
19 Jan 2015 09:37 - 28 Jan 2015 10:11 #223605
by Amar Andalkar
Replied by Amar Andalkar on topic Re: Has low-elevation Cascade snowpack been declining?
Continued from previous post . . .
Let's do the same type of quick analysis as for the Washington sites, looking at the snowdepth and SWE as a % of normal (1981-2010 median) over the last 9 years 2006 to 2014 at these 34 sites. Once again, sites are arranged in geographic order from north to south along the Cascades, and those 9 seasons are very approximately categorized as above-near-below normal by glancing at the % of normal values.
Columbia Gorge:
Greenpoint (504) 3310 ft (1979-2015, snowdepth installed 2006)
A somewhat rain-shadowed site near the Columbia Gorge, 17 miles north of Mount Hood, average annual precip of 71", median maximum SWE of 19" near March 5
2014 far below-normal, 2013 & 2010 below-normal, 2012 above-normal, 2011 near-normal, 2009 & 2008 & 2007 & 2006 also above-normal
North Fork (666) 3060 ft (1978-2015, snowdepth installed 1996)
Above the Columbia Gorge, 19 miles NW of Mount Hood, average annual precip of 144" (the most of any SNOTEL site in Oregon), median maximum SWE of 17" near April 10
2014 far below-normal, 2013 & 2012 & 2011 above-normal, 2010 near-normal, 2009 & 2008 & 2007 & 2006 also above-normal
North of Mount Hood:
Red Hill (712) 4410 ft (1978-2015, snowdepth installed 2006)
6 miles north of Mount Hood, average annual precip of 110", median maximum SWE of 47" near March 25
2014 below-normal, 2012 & 2011 above-normal, 2013 & 2010 near-normal, 2009 & 2008 & 2007 & 2006 also above-normal
Mill Creek Meadow (21D39) 4400 ft (1985-2015) 10 miles NE of Mount Hood
2014 & 2010 below-normal, 2013 & 2011 near-normal, 2012 & 2009 & 2008 & 2006 above-normal, 2007 insufficient data
Blazed Alder (351) 3650 ft (1981-2015, snowdepth installed 1996)
9 miles NW of Mount Hood, average annual precip of 122", median maximum SWE of 27" near March 25
2014 & 2010 below-normal, 2013 & 2012 & 2011 & 2009 & 2008 & 2006 above-normal, 2007 near-normal
South of Mount Hood:
Mud Ridge (655) 4070 ft (1978-2015, snowdepth installed 1996)
8 miles SSW of Mount Hood, average annual precip of 67", median maximum SWE of 25" near March 1
2014 & 2010 below-normal, 2013 near-normal, 2012 & 2011 & 2009 & 2008 & 2006 above-normal, 2007 near-normal
Clear Lake (401) 3810 ft (1980-2015, snowdepth installed 2005)
12 miles south of Mount Hood, average annual precip of 44", median maximum SWE of 13" near March 1
2014 & 2010 far below-normal, 2013 below-normal, 2012 & 2011 & 2009 & 2008 & 2006 above-normal, 2007 near-normal
Clackamas Lake (398) 3400 ft (1980-2015, snowdepth installed 2002)
19 miles SSW of Mount Hood, average annual precip of 53", median maximum SWE of 13" near March 5
2014 & 2010 far below-normal, 2013 below-normal, 2012 & 2011 & 2009 & 2008 & 2006 above-normal, 2007 near-normal
Farther south of Mount Hood:
Beaver Creek #1 (21D36) 4210 ft (1982-2015) 19 miles SSE of Mount Hood
2014 & 2010 far below-normal, 2013 below-normal, 2012 & 2011 & 2009 & 2008 & 2006 above-normal, 2007 near-normal
Beaver Creek #2 (21D37) 4220 ft (1982-2015) 19 miles SSE of Mount Hood
similar pattern at this adjacent site, which somehow has much lower snowpack despite near-identical elevation
Peavine Ridge (687) 3420 ft (1981-2015, snowdepth installed 2003)
25 miles SSW of Mount Hood, average annual precip of 65", median maximum SWE of 12" near February 20
2014 & 2010 far below-normal, 2013 & 2012 & 2011 & 2009 & 2008 & 2006 above-normal, 2007 near-normal
West of Mount Jefferson:
Little Meadows (584) 4020 ft (1980-2015, snowdepth installed 2003)
21 miles WSW of Mount Jefferson, average annual precip of 113", median maximum SWE of 23" near March 20
2014 far below-normal, 2013 & 2012 & 2011 above-normal, 2010 near-normal, 2009 & 2008 & 2007 & 2006 above-normal
Marion Forks (614) 2590 ft (1980-2015, snowdepth installed 2005)
10 miles SW of Mount Jefferson, 2 miles SW of Marion Forks Fish Hatchery (2480 ft) site with snowfall data shown above,
average annual precip of 80", median maximum SWE of 8" near March 5
2014 & 2010 far below-normal, 2013 & 2012 & 2011 & 2009 & 2008 & 2006 above-normal, 2007 near-normal
Daly Lake (434) 3690 ft (1980-2015, snowdepth installed 2004)
17 miles SW of Mount Jefferson, average annual precip of 86", median maximum SWE of 13" near March 5
2014 & 2010 far below-normal, 2013 & 2012 & 2011 & 2009 & 2008 & 2006 above-normal, 2007 near-normal
Santiam Pass Highway US 20:
Santiam Jct. (733) 3740 ft (1978-2015, snowdepth installed 2004)
18 miles SSW of Mount Jefferson, average annual precip of 74", median maximum SWE of 16" near February 25
2014 & 2010 far below-normal, 2013 & 2012 & 2011 & 2009 & 2008 & 2006 above-normal, 2007 below-normal
Jump Off Joe (552) 3520 ft (1978-2015, snowdepth installed 2002)
27 miles SW of Mount Jefferson, average annual precip of 86", median maximum SWE of 13" near March 5 (same as Daly Lake above)
2014 & 2010 far below-normal, 2013 & 2012 & 2011 & 2009 & 2008 & 2007 & 2006 above-normal
Cascade Lakes Highway near Bend:
Hungry Flat (21F04) 4400 ft (1952-2015)
12 miles east of Mount Bachelor, extremely low snowpack site in a very dry area with about 2" median maximum SWE
2014 & 2013 & 2010 far below-normal, 2012 & 2009 & 2007 below-normal, 2011 & 2008 & 2006 above-normal
Willamette Pass Highway ORE 58:
Railroad Overpass (710) 2680 ft (1981-2015, snowdepth installed 2006)
9 miles WNW of Willamette Pass, average annual precip of 56", median maximum SWE of 0", average maximum SWE of 0.6"!!
This site almost never has measurable snowpack! The link above includes 1981-2010 averages, which are at least non-zero unlike the medians.
Salt Creek Falls (729) 4220 ft (1980-2015, snowdepth installed 2005)
4 miles WNW of Willamette Pass, 6 miles NNE of Diamond Peak, average annual precip of 75", median maximum SWE of 17" near April 1
2014 & 2010 far below-normal, 2013 & 2011 & 2009 & 2008 & 2007 & 2006 above-normal, 2012 near-normal
North Umpqua Highway ORE 138:
North Umpqua (22F16) 4200 ft (1937-2013)
8 miles north of Diamond Lake, just SE of Lemolo Lake, 5 miles SE of Lemolo Lake 3 NNW (4080 ft) site with snowfall data shown above
2013 & 2007 below-normal, 2012 & 2011 & 2009 & 2008 & 2006 above-normal, 2010 far below-normal
Trap Creek (22F17) 3830 ft (1937-2013)
7 miles NW of Diamond Lake along ORE 138, 7 miles NNW of Mount Bailey
2013 & 2012 & 2011 & 2009 & 2008 & 2006 above-normal, 2010 far below-normal, 2007 near-normal
Western Cascades, 25 miles east of Roseburg, 35 miles west of Diamond Lake and 40 miles west of the Cascade Crest:
Red Butte 4 (22F26) 3000 ft (1961-2015)
This site almost never has measurable snowpack! The link above includes 1981-2010 averages, which are at least non-zero unlike the medians.
Red Butte 3 (22F25) 3500 ft (1961-2015)
This site has extremely low snowpack! The link above includes 1981-2010 averages, which are at least useful unlike the tiny medians.
Red Butte 2 (22F24) 4050 ft (1960-2015)
At least this site is high enough to have some snowpack most years! Except 2014 which was zero!
Red Butte 1 (22F23) 4460 ft (1960-2015)
2014 & 2010 far below-normal, 2013 & 2012 & 2011 & 2009 & 2008 & 2007 & 2006 above-normal
West of Crater Lake:
Silver Burn (22G02) 3680 ft (1937-2015) 11 miles west of Crater Lake along ORE 62
2014 & 2010 far below-normal, 2013 & 2012 & 2007 near-normal, 2011 & 2009 & 2008 & 2006 above-normal
Western Cascades, 5 miles SE of I-5, 20 miles NNE of Grants Pass, 50 miles west of the Cascade Crest:
King Mountain 4 (23G11) 3050 ft (1967-2015)
King Mountain 3 (23G10) 3680 ft (1961-2015)
These 2 lower sites almost never have measurable snowpack! The links above include 1981-2010 averages, which are at least non-zero unlike the medians.
King Mountain 1 (23G08) 4760 ft (1961-2015)
2014 far below-normal, 2013 & 2012 & 2011 & 2009 & 2008 & 2007 & 2006 above-normal, 2010 below-normal
King Mountain (558) 4340 ft (1980-2015, snowdepth installed 2006)
Very low snowpack, hard to categorize reliably, average annual precip of 62", median maximum SWE of 3" near March 1
South of Mount McLoughlin:
Fish Lk. (479) 4660 ft (1981-2015, snowdepth installed 2006)
5 miles SSW of Mount McLoughlin, average annual precip of 46", median maximum SWE of 12" near March 5
2014 & 2010 far below-normal, 2013 & 2011 & 2009 & 2008 & 2006 above-normal, 2012 & 2007 near-normal
Deadwood Junction (22G27) 4660 ft (1960-2015)
11 miles SSW of Mount McLoughlin, along Dead Indian Memorial Road
2014 near-zero snowpack, 2010 far below-normal, 2013 & 2011 & 2009 & 2008 & 2006 above-normal, 2012 & 2007 near-normal
Howard Prairie (22G26) 4580 ft (1959-2015)
15 miles SSW of Mount McLoughlin, 1 mile SE of Howard Prairie Dam (4570 ft) site with snowfall data shown above
2014 near-zero snowpack, 2010 far below-normal, 2013 & 2011 & 2009 & 2008 & 2006 above-normal, 2012 & 2007 near-normal
Siskiyou Summit:
Siskiyou Summit Rev. (22G35) 4560 ft (1932-2015)
30 miles SW of Mount McLoughlin, 0.5 mile NW of 4310 ft Siskiyou Summit (highest point on I-5), near the border between Cascade Range and Siskiyou Mountains
2014 zero snowpack (!), 2013 & 2012 & 2011 & 2009 & 2008 & 2007 & 2006 above-normal, 2010 below-normal
Continued in next post, exceeded 20,000 character limit AGAIN . . .
Please Log in or Create an account to join the conversation.
- Amar Andalkar
- [andalkar]
-
Topic Author
- Offline
- Premium Member
-
Less
More
- Posts: 635
- Thank you received: 0
19 Jan 2015 09:38 #223606
by Amar Andalkar
Replied by Amar Andalkar on topic Re: Has low-elevation Cascade snowpack been declining?
Continued from previous post . . .
Conclusions on the snowpack in the Oregon Cascades:
Well, as in Washington, the overall answer to the question appears to be a solid No! The low-elevation snowpack in the Oregon Cascades has not been declining over the past 2-3 decades!
In particular, the most recent decade is no worse than 2-3 decades ago, and in fact appears to have slightly better low-elevation snowpacks. This is most definitely true in the northern Oregon Cascades which match the southern Washington Cascades quite well, and also appears to hold true in both the central and southern Oregon Cascades too, other than 2014 which was a disastrously poor snow year in the southern end, with near-record lows for snowpack and snowfall at many sites. The poor 2014 at the southern end was expected given that 2014 was the worst drought year in California since 1977, but the fact that the previous 2 years were generally above-normal comes as a bit of a surprise given that 2012 and 2013 were the first two years of the current California drought, and that the snowfall numbers shown earlier for the 2 southern sites were slightly below-normal for those years too.
What about the Coast Ranges? The Olympics, Oregon Coast Range, Klamath & Siskiyou Mountains
In the Washington "Coast Ranges" (i.e. the Olympic Mountains and Willapa Hills), there are no active snow courses or SNOTEL sites within the 1500-3500 ft low-elevation band there, and only a handful of sites period, all above 4000 ft in the Olympics. In the Oregon part of the Siskiyou Mountains, there is only a single site in the low-elevation band (Siskiyou Summit) which was already included in the analysis above.
But in the Oregon Coast Range, there are 2 SNOTEL sites and 1 snow course with at least 30 years of data, all in the northern half of the range:
site_name start enddate latitude longitude elev county
Saddle Mountain (726) 1978-November active 45.54 -123.37 3110 Washington
Seine Creek (743) 1980-June active 45.53 -123.30 2060 Washington
Marys Peak Rev. (23E04) 1938-February active 44.51 -123.56 3580 Benton
Might as well take a quick look at these sites too in case there are any surprises to be found:
Wilson River Highway, ORE 6:
Saddle Mountain (726) 3110 ft (1979-2015, snowdepth installed 1998)
Average annual precip of 98", median maximum SWE not given, average maximum SWE of 6", NOTE: 1971-2000 normals used since 1981-2010 are missing
2014 near-zero snowpack, 2012 & 2010 & 2006 far below-normal, 2013 & 2011 & 2008 above-normal, 2009 & 2007 very variable
Seine Creek (743) 2060 ft (1981-2015, snowdepth installed 2000)
Average annual precip of 73", median maximum SWE of 0.2", average maximum SWE of 1.8"!!
This site almost never has measurable snowpack! The link above includes 1981-2010 averages, which are at least non-zero unlike the medians.
Corvallis-Newport Highway, US 20:
Marys Peak Rev. (23E04) 3580 ft (1938-2015)
2014 near-zero snowpack, 2013 & 2012 & 2011 & 2009 & 2008 & 2007 & 2006 above-normal, 2010 below-normal
Well, it's hard to tell much from such a small sample size, but at first glance these sites appear to be more closely correlated with areas in the southern part of the Western Cascades, while not really matching the annual pattern of the northern Oregon Cascades which are located directly east of these sites. The snowpack at the northern Wilson River sites has definitely been terrible in several recent years, the worst of any location looked at in this entire study in Oregon or Washington, but in sharp contrast the Marys Peak site farther south and slightly higher has had mostly above-normal years. Not much more can be said based on the limited data which is available.
And what about the southernmost part of the Cascade Range, the California Cascades?
There appears to be very little low-elevation snow data in this region, but a detailed analysis of whatever is available is underway . . .
Please Log in or Create an account to join the conversation.
- Amar Andalkar
- [andalkar]
-
Topic Author
- Offline
- Premium Member
-
Less
More
- Posts: 635
- Thank you received: 0
19 Jan 2015 09:39 #223607
by Amar Andalkar
Replied by Amar Andalkar on topic Re: Has low-elevation Cascade snowpack been declining?
Reserved for posting California Cascades data and analysis . . .
Please Log in or Create an account to join the conversation.
- mccallboater
- [mccallboater]
-

- Offline
- New Member
-
Less
More
- Posts: 11
- Thank you received: 0
20 Jan 2015 14:31 #223627
by mccallboater
Replied by mccallboater on topic Re: Has low-elevation Cascade snowpack been declining?
I'd love to see the same analysis of the interior ranges. Selkirks, Bitterroots, West Central Idaho, Sawtooths. I'm seeing big changes (warmer) at the middle elevations there. So does the U of I.
But does warmer mean less snow?
But does warmer mean less snow?
Please Log in or Create an account to join the conversation.
- LDboarder
- [LDboarder]
-
- Offline
- New Member
-
Less
More
- Posts: 3
- Thank you received: 0
28 Jan 2015 07:40 #223669
by LDboarder
Replied by LDboarder on topic Re: Has low-elevation Cascade snowpack been declining?
Wow. As a snow enthusiast and amateur weather geek, i am thoroughly impressed with all this research. You have saved me time at my boring office job scanning SNOTEL sites just to see who has the deepest snow pack. I love this stuff. Thank you Mr Andalker!
Couple questions about SNOTEL you might be able to help me with. Does Canada have any similar sites set up? I am curious about snow depths in the BC Ranges and always am wondering who is getting the best winter out there! Any European Countries using something similar? Also, do you have any information on SNOTEL sites themselves and how they work? i know they are operated by NRCS, but how exactly is the data collected? I think they use snow pillows for snow water content but how exactly do they measure total depth? In all of your data analysis, is there any one snow event or series of storms that stands out here in the Pacific Northwest? Thanks again!
Couple questions about SNOTEL you might be able to help me with. Does Canada have any similar sites set up? I am curious about snow depths in the BC Ranges and always am wondering who is getting the best winter out there! Any European Countries using something similar? Also, do you have any information on SNOTEL sites themselves and how they work? i know they are operated by NRCS, but how exactly is the data collected? I think they use snow pillows for snow water content but how exactly do they measure total depth? In all of your data analysis, is there any one snow event or series of storms that stands out here in the Pacific Northwest? Thanks again!
Please Log in or Create an account to join the conversation.
- Amar Andalkar
- [andalkar]
-
Topic Author
- Offline
- Premium Member
-
Less
More
- Posts: 635
- Thank you received: 0
28 Jan 2015 13:53 - 07 Apr 2015 23:54 #223675
by Amar Andalkar
Replied by Amar Andalkar on topic Re: Has low-elevation Cascade snowpack been declining?
Thanks everyone for the comments and compliments, it's nice to see that this work and effort is appreciated. The California Cascades data analysis is still in-progress (snowfall sites done, snowpack sites not yet started), as I was out of town for several days on an impromptu road trip to exactly that region, skiing nice smooth Juneuary corn in the sunshine on Lassen Peak (my first winter summit and ski descent there), Mount Shasta (first winter summit denied at 12000 ft by unexpected extreme gusty winds and dangerous falling ice missiles), and Crater Lake (easy ski tour to The Watchman).
But I'll try to address a few more of the comments now:
It would be possible to go through all the data and check when some critical threshold of snowdepth (say 24" or 36") is first reached in each season, for sites which have hourly or daily data. But I have not yet done so for any site, and it would take a large amount of work to do it, either doing it completely manually or by writing a reliable script to extract it (and then manually double-checking). Maybe at some point I may do so for some sites, time and other priorities permitting, but it is not a high-priority yet, and it's hard.
However, unlike most such snowfall-related questions, I really don't have a good idea beforehand what that data might show, whether the date of reaching a skiable depth has been shifting later over the decades or not. So it is an interesting and open question which deserves investigation.
As far as I know, that information is not readily available for almost any ski area, and almost all ski areas are very reluctant to release that info publicly. It's simply not anything they want the public to know, for obvious marketing/business reasons! The one exception I've ever seen (there may be others) is Mammoth Mountain Ski Area in California, which publicly posted all of its historic opening and closing dates back to 1968 on its website, along with complete monthly snowfall data too. But Mammoth did so for marketing reasons too: to promote its very long ski season, as it often has the 2nd longest ski season in North America, trailing only Mount Hood Timberline Lodge, and often extending from late October to early July (and even into mid-August in 1995). However, it has fallen far short of that range in the past 3 seasons during the unprecedented California drought, and perhaps not coincidentally, the historic opening/closing data appears to have now vanished from its website.
Although I haven't tried to ask the Summit at Snoqualmie for that data, the likelihood that they would provide it along with permission to post it online seems near-zero, and not worth the effort. But maybe someone should try. Or perhaps try to get it from the US Forest Service for those ski areas which operate under a USFS special use permit (like Snoqualmie, and most other Northwest ski areas). Otherwise, this type of historical data would have had to have been collected by someone in the general public each year for many decades, but I know of no one who has done so. I have it for the last several years for most Northwest ski areas, but that is not nearly long enough to be useful yet.
Unfortunately, I'm not the right person to do that analysis. Without an in-depth familiarity with the snow climatology of a given range or region (i.e. knowing spatial variations such as rain-shadowing, or temporal cycles such as the PDO correlation), it would be easy to make foolish mistakes and egregious errors in the data analysis, and I simply don't have that knowledge for any interior range. I do have the necessary degree of knowledge and familiarity for the entire Cascade Range, plus adjacent portions of the southwestern BC Coast Mountains, the Olympics, Klamath Mountains, and Sierra Nevada in California, so I'm comfortable analyzing data and drawing conclusions for those areas, but not really for any other areas as of yet.
For British Columbia, the BC River Forecast Centre has a very modest network of hourly snow telemetry sites: only 51 last year, now 50, not all of which have snowdepth sensors, in the entire vast mostly-mountainous province with an area greater than Washington, Oregon, and California combined. There's also a larger network of monthly snow course sites (about 165 active). Luckily the monthly manual snow course data for the current season is readily viewable online.
Viewing data from their telemetry sites is not easy though, as only 7 days of data are readily available for each site as an unformatted CSV file, with telemetry data for the rest of the current season and all the years since 2011 only available on this page as a set of 4 separate files (SWE, snow depth, precip, temperature), each of which includes all telemetry sites ( archived data from the start date through 2011 is available for each site separately, but not for more recent years). Very inconvenient and hard to use, really a maddening and unacceptable situation, but that's how it is. In order to actually view the unformatted CSV data for the last 7 days, I wrote my own viewer script a few years ago, which also converts from metric units: British Columbia Snow Telemetry . I recently got an email from someone who works at BCRFC who says they use my viewer script to easily and quickly view their own telemetry data! Excellent!
For Alberta, snow telemetry and monthly snow course data can be found here, but I haven't really used it much: environment.alberta.ca/forecasting/reports/
Don't know about European snow telemetry.
SNOTEL sites transmit data via the super-cool and ultra-reliable meteor burst communications technology. The snowdepth is measured using an ultrasonic distance sensor looking downward at the snowpack from an arm mounted high on a tower, the same as at NWAC telemetry sites.
Some info about SNOTEL sites can be found here: www.wcc.nrcs.usda.gov/snow/about.html and www.wcc.nrcs.usda.gov/factpub/sect_4b.html
Much more detailed info about and pictures of SNOTEL sites: Idaho Snow Survey Frequently Asked Questions
There have been a number of huge storm cycles (generally those dumping 10 ft or more of snow at many sites) in the Cascades over the 21 seasons since I moved to Seattle from the East Coast. Among the most notable was one in February 1999 which buried chairlifts at Mount Baker Ski Area in the middle of that record-setting 1140" snowfall season, but it's hard to remember details for most of them though without having written something down. The most recent such storm cycle happened last February, and was documented in detail here on TAY: HUGE storm cycle brings 4-14 ft snow Feb6-25,2014!
But I'll try to address a few more of the comments now:
Really fine work Amar. Thanks for so clearly showing these historical trends, particularly of the PDO. Looking at the maximums back in the 50's surely seems to support the Moffet's at Snoqualmie building those dangerously high top off-loading stations on those 1st generation chairlifts. It put real fear in your gut as a beginner, as your chair approached the top lift station, which itself was adorned with the broken ski tips of the unwary or distracted who innocently let their skis dangle
So now for another question: Can you analyze the data to show when enough skiable snow has accumulated, for however many stations you can find. How much variability is there in the onset of skiing? Or, is our 'typical' season still averaging the same mean start, center or overall period? Should we shift our expectations, or just cool it and be patient, knowing that the skiing will always return to the mean - which seems to fly in the face of global warming, which I too fear is well on its way.
It would be possible to go through all the data and check when some critical threshold of snowdepth (say 24" or 36") is first reached in each season, for sites which have hourly or daily data. But I have not yet done so for any site, and it would take a large amount of work to do it, either doing it completely manually or by writing a reliable script to extract it (and then manually double-checking). Maybe at some point I may do so for some sites, time and other priorities permitting, but it is not a high-priority yet, and it's hard.
However, unlike most such snowfall-related questions, I really don't have a good idea beforehand what that data might show, whether the date of reaching a skiable depth has been shifting later over the decades or not. So it is an interesting and open question which deserves investigation.
great info.
As a question that is not scientific...but maybe somewhat in the same direction....
Does anybody have the historic opening and closing dates of skiing at Snoqualmie Pass?
As far as I know, that information is not readily available for almost any ski area, and almost all ski areas are very reluctant to release that info publicly. It's simply not anything they want the public to know, for obvious marketing/business reasons! The one exception I've ever seen (there may be others) is Mammoth Mountain Ski Area in California, which publicly posted all of its historic opening and closing dates back to 1968 on its website, along with complete monthly snowfall data too. But Mammoth did so for marketing reasons too: to promote its very long ski season, as it often has the 2nd longest ski season in North America, trailing only Mount Hood Timberline Lodge, and often extending from late October to early July (and even into mid-August in 1995). However, it has fallen far short of that range in the past 3 seasons during the unprecedented California drought, and perhaps not coincidentally, the historic opening/closing data appears to have now vanished from its website.
Although I haven't tried to ask the Summit at Snoqualmie for that data, the likelihood that they would provide it along with permission to post it online seems near-zero, and not worth the effort. But maybe someone should try. Or perhaps try to get it from the US Forest Service for those ski areas which operate under a USFS special use permit (like Snoqualmie, and most other Northwest ski areas). Otherwise, this type of historical data would have had to have been collected by someone in the general public each year for many decades, but I know of no one who has done so. I have it for the last several years for most Northwest ski areas, but that is not nearly long enough to be useful yet.
I'd love to see the same analysis of the interior ranges. Selkirks, Bitterroots, West Central Idaho, Sawtooths. I'm seeing big changes (warmer) at the middle elevations there. So does the U of I.
But does warmer mean less snow?
Unfortunately, I'm not the right person to do that analysis. Without an in-depth familiarity with the snow climatology of a given range or region (i.e. knowing spatial variations such as rain-shadowing, or temporal cycles such as the PDO correlation), it would be easy to make foolish mistakes and egregious errors in the data analysis, and I simply don't have that knowledge for any interior range. I do have the necessary degree of knowledge and familiarity for the entire Cascade Range, plus adjacent portions of the southwestern BC Coast Mountains, the Olympics, Klamath Mountains, and Sierra Nevada in California, so I'm comfortable analyzing data and drawing conclusions for those areas, but not really for any other areas as of yet.
Wow. As a snow enthusiast and amateur weather geek, i am thoroughly impressed with all this research. You have saved me time at my boring office job scanning SNOTEL sites just to see who has the deepest snow pack. I love this stuff. Thank you Mr Andalkar!
Couple questions about SNOTEL you might be able to help me with. Does Canada have any similar sites set up? I am curious about snow depths in the BC Ranges and always am wondering who is getting the best winter out there! Any European Countries using something similar? Also, do you have any information on SNOTEL sites themselves and how they work? i know they are operated by NRCS, but how exactly is the data collected? I think they use snow pillows for snow water content but how exactly do they measure total depth? In all of your data analysis, is there any one snow event or series of storms that stands out here in the Pacific Northwest? Thanks again!
For British Columbia, the BC River Forecast Centre has a very modest network of hourly snow telemetry sites: only 51 last year, now 50, not all of which have snowdepth sensors, in the entire vast mostly-mountainous province with an area greater than Washington, Oregon, and California combined. There's also a larger network of monthly snow course sites (about 165 active). Luckily the monthly manual snow course data for the current season is readily viewable online.
Viewing data from their telemetry sites is not easy though, as only 7 days of data are readily available for each site as an unformatted CSV file, with telemetry data for the rest of the current season and all the years since 2011 only available on this page as a set of 4 separate files (SWE, snow depth, precip, temperature), each of which includes all telemetry sites ( archived data from the start date through 2011 is available for each site separately, but not for more recent years). Very inconvenient and hard to use, really a maddening and unacceptable situation, but that's how it is. In order to actually view the unformatted CSV data for the last 7 days, I wrote my own viewer script a few years ago, which also converts from metric units: British Columbia Snow Telemetry . I recently got an email from someone who works at BCRFC who says they use my viewer script to easily and quickly view their own telemetry data! Excellent!
For Alberta, snow telemetry and monthly snow course data can be found here, but I haven't really used it much: environment.alberta.ca/forecasting/reports/
Don't know about European snow telemetry.
SNOTEL sites transmit data via the super-cool and ultra-reliable meteor burst communications technology. The snowdepth is measured using an ultrasonic distance sensor looking downward at the snowpack from an arm mounted high on a tower, the same as at NWAC telemetry sites.
Some info about SNOTEL sites can be found here: www.wcc.nrcs.usda.gov/snow/about.html and www.wcc.nrcs.usda.gov/factpub/sect_4b.html
Much more detailed info about and pictures of SNOTEL sites: Idaho Snow Survey Frequently Asked Questions
There have been a number of huge storm cycles (generally those dumping 10 ft or more of snow at many sites) in the Cascades over the 21 seasons since I moved to Seattle from the East Coast. Among the most notable was one in February 1999 which buried chairlifts at Mount Baker Ski Area in the middle of that record-setting 1140" snowfall season, but it's hard to remember details for most of them though without having written something down. The most recent such storm cycle happened last February, and was documented in detail here on TAY: HUGE storm cycle brings 4-14 ft snow Feb6-25,2014!
Please Log in or Create an account to join the conversation.
- ryanb
- [ryanb]
-
- Offline
- Junior Member
-
Less
More
- Posts: 55
- Thank you received: 0
30 Jan 2015 20:37 #223691
by ryanb
Replied by ryanb on topic Re: Has low-elevation Cascade snowpack been declining?
Very interesting analysis!
I ran across Pederson's "The unusual nature of recent snowpack declines in the North American Cordillera" while looking for information on regional snow pack variability and it seems worth reviewing in this thread:
scholar.google.com/scholar?hl=en&q=The+U...+American+Cordillera
They use tree ring records to establish a snow pack record back to the year 1200. They focus on the rockies instead of the coast ranges but have a bunch of findings that seem relevant to this discussion.
In particular they show that a major driving factor in snow pack is a decade scale phasing in where the major storm tracks go...ie colorado has a good decade when the northern rockies have a bad one and visa versa.
Looking at their graphs the decline since the 50's in the northern rockies and columbia basin could be largely driven by this. However the 50's are actually somewhat average years and the recent years and ~20's era are bellow average when compared to the 1800's and before.
Ie they find a distinct decline in snow pack in the 20'th century which took effect in about ~1900.
I think that the decade scale phasing in storm tracks will confound any analysis of the much shorter record of snowtel data. It might be possible to control for this by looking at retained precipitation or snow versus rain for each individual site?
Amar, I'm no meteorologist and may have missed something so i'm curious to know what your thoughts are.
Please Log in or Create an account to join the conversation.