- Posts: 635
- Thank you received: 0
2014-15 Snow Season Summary, April 2015
- Amar Andalkar
- [andalkar]
-
 Topic Author
- Offline
- Premium Member
-

Less
More
05 Apr 2015 00:24 - 05 Apr 2015 10:12 #224355
by Amar Andalkar
2014-15 Snow Season Summary, April 2015 was created by Amar Andalkar
See also these 3 previous snowfall & snowpack threads from earlier this season, which include snowpack summaries at earlier points in the season:
Lassen Peak CA reaches 100" snowdepth!! 17Dec2014
Lyman Lake SNOTEL hits 100" snowdepth!?! 05Jan2015
Mt Shasta gets 3 ft new snow in 24 hrs!! 07Feb2015 (see Reply #12 for 10Feb2015 snowpack summary)
2014-15 Snow Season Summary for Western North America, April 2015
(plus a weather forecast outlook through mid-April, looking very snowy!)
By any measure, 2014-15 will go down as one of the most anomalous and unusual snow seasons in the historical record of the Pacific Northwest, and it clearly also ranks among the worst in the subjective judgment of many skiers. But how does this bizarre season really stack up, by the hard numbers? And how does it compare to 2004-5, the most recent far-below-normal snowpack year in the Northwest?
Well, we've now passed April 1, the most important date in the entire year for snow climatology and snowpack measurements. The normal seasonal maximum of mountain snowpacks throughout western North America occurs near April 1, obviously coming a bit earlier at lower elevations and latitudes, and somewhat later at higher elevations and latitudes (even averaging as late as early-mid May at many of the highest snowpack measurement sites). The one single number used most often to characterize an entire season's snowpack in the Northern Hemisphere is the April 1 measurement of snow water content as a percentage of normal (although "normal" is defined differently by various snowpack measurement agencies, as either a median or a mean, and calculated over either the full period of record or just over a fixed interval such as 1981-2010).
So it's time to take a look at the overall state of the mountain snowpack in the Pacific Northwest and also throughout western North America, as this has been a historically anomalous and unusual snow season over much of that vast region. Overall throughout western North America, it's probably the 2nd worst snow year in the past 6 decades, roughly matching 1980-81 and only slightly better than 1976-77, which was the most severe drought year averaged over that entire region since at least the early 1940s. Here is a quick overview of April 1 snowpack (snow water equivalent) from the SNOTEL network throughout the western US:
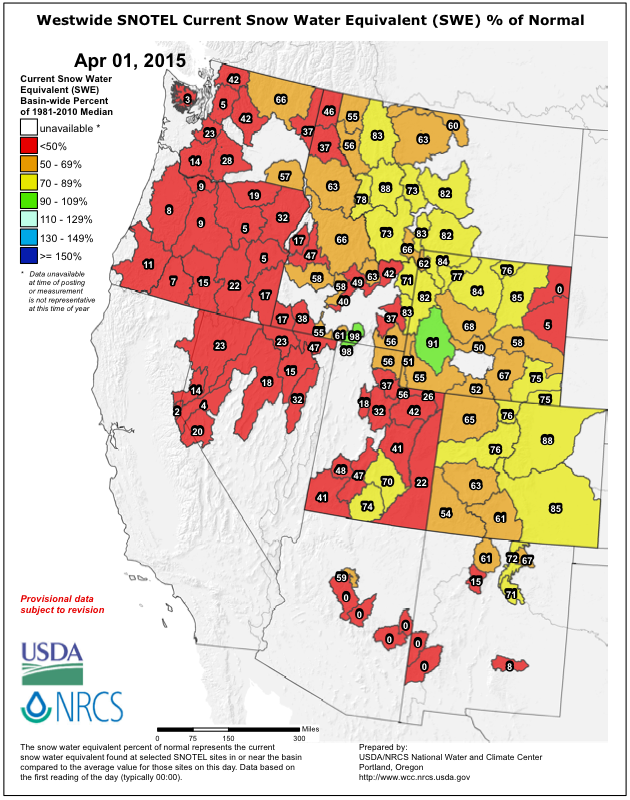
Shockingly, the April 1 snowpack is below normal in all drainage basins in the entire western US, with only a few isolated areas in the Rockies even close to normal, which had been above normal throughout much the season until March. The situation in BC and Alaska is almost as bad (see below). And the snowpack is really quite far below-normal, with over half of all areas in the western US at less than 50% of normal and a sizable fraction at less than 10% of normal (!!). This season now ranks as the all-time record low for snowpack over a large section of the US West Coast, from the Olympics and central Washington Cascades extending south through the entire Oregon and California Cascades, and continuing over the entire length of the Sierra Nevada, with only isolated locations at higher elevations in that entire area avoiding record lows and being merely well below-normal. There are several more maps below showing the wide extent of the record lows, along with maps for California which has its own state snow survey system separate from the national SNOTEL network.
But it must be said: despite the record-low snowpack and all the rain and Pineapple Expresses, ski conditions throughout the length of the Cascades have still been amazingly good at the right times and places this year, with excellent corn snow during several long sunny stretches, and even some outstanding powder during the last days of December and the first 2 days of April:
April 1-2, 2015, Rainier, Mazama & Cowlitz POWDER!
[size=small](Sorry, just had to include a link to that TR here for posterity, to balance out the bleakness of the rest of this snowpack summary.)[/size]
So let's go ahead and look at the April 1 numbers and maps in more detail, starting close to home and then covering the rest of western North America. The current April 1 CLISNO report from NWAC ( current and older reports are archived here ) shows snowdepths at new record lows at most of the sites they track, and near record lows at the remaining sites:
CLIMATOLOGICAL SNOWDEPTH INFORMATION
NORTHWEST AVALANCHE CENTER SEATTLE WASHINGTON
DAY 1 MONTH 4 YEAR 2015
DATA IN INCHES, -99 DENOTES MISSING DATA
CURRENT CLIMATE PER CENT LAST THRU 2014 THRU 2014
DEPTH AVERAGE OF NORMAL YEAR MAX/YEAR MIN/YEAR
HURRICANE 12 109 11 92 252/1999 42/2005
MT BAKER 17 175 10 173 311/1999 72/1934
STEVENS 22 102 22 109 192/1956 24/1941
SNOQUALMIE 15 86 17 81 170/1956 2/1992
STAMPEDE -99 100 -99 85 183/1956 17/1992
MISSION 0 47 0 45 86/1983 20/1973
CRYSTAL 6 73 8 72 144/1999 16/1981
PARADISE 73 176 41 184 327/1956 66/1941
WHITE PASS 2 57 4 52 110/1997 0/1992
TIMBERLINE 57 165 35 164 300/1999 57/1981
MEADOWS 33 129 26 133 199/2008 49/2005
THIS TABLE PRODUCED ON THE 1ST AND 15TH BETWEEN 15 NOVEMBER AND 1 MAY.
AVERAGES, MAXIMUMS AND MINIMUMS EARLY AND LATE IN THE SEASON MAY BE
INACCURATE DUE TO LIMITED DATA.
IF THERE IS TIE FOR THE MAXIMUM OR MINIMUM SNOW DEPTH THEN THE LATEST
YEAR IS INDICATED.
RECORDS BEGIN: HURRICANE 1979, MT BAKER 1926, STEVENS 1939,
SNOQUALMIE 1929, STAMPEDE 1943, MISSION RIDGE 1970,
CRYSTAL 1967, PARADISE 1926, WHITE PASS 1976,
TIMBERLINE 1973, MT HOOD MEADOWS 1974.
NOTE: NRCS DATA USED AT STAMPEDE STARTING 2006-2007 SEASON.
The most shocking number in that table is clearly at Mount Baker Ski Area (famed for its world record 1140" season snowfall in 1998-99), where the 17" snowdepth is less than 10% of normal and also less than 1/4 of its previous record low for April 1, over an 80+ year period of record. Obviously, none of the numbers in that table are pretty at all. However, both Mount Rainier Paradise and Mount Hood Timberline Lodge are maintaining a quite respectably large snowdepth compared to any typical snow measurement site throughout western North America, and most mountain locations would be thrilled to have a 57" or 73" deep snowpack on April 1. The Paradise and Timberline numbers only look bad when viewed as a percentage of their own exceptionally huge normal snowdepths, which rank among the deepest of any measurement sites in the world.
But the terrible April 1 numbers are actually an improvement, as the situation was even worse 2 weeks earlier in mid-March. Snowdepths at most of these sites have increased since the previous CLISNO report of March 15, somewhat significantly for a few sites:
CLIMATOLOGICAL SNOWDEPTH INFORMATION
NORTHWEST AVALANCHE CENTER SEATTLE WASHINGTON
DAY 15 MONTH 3 YEAR 2015
CURRENT CLIMATE PER CENT LAST THRU 2014 THRU 2014
DEPTH AVERAGE OF NORMAL YEAR MAX/YEAR MIN/YEAR
HURRICANE 6 104 6 72 252/1999 8/2005
MT BAKER 14 165 8 142 305/1999 15/2005
STEVENS 24 103 23 115 200/1956 18/2005
SNOQUALMIE 0 92 0 84 195/1956 0/2005
STAMPEDE -99 100 -99 82 216/1964 0/2005
MISSION 5 46 11 42 83/1999 7/2005
CRYSTAL 5 70 7 62 136/1999 9/1981
PARADISE 57 169 34 160 357/1956 34/2005
WHITE PASS 0 58 0 49 132/1997 0/2005
TIMBERLINE 41 149 28 131 258/1999 34/1981
MEADOWS 26 125 21 106 288/1974 24/2005
A major pattern shift occurred on March 12 this year, as was fairly well predicted by global weather models including the GFS even 10-12 days before it occurred. The weather pattern has been significantly wetter in the Pacific Northwest since then, with temperatures closer to normal at first, and then even dipping below normal for the first time in 2015 by the last week of March and into the start of April, bringing a sustained cool and wet pattern which had not been seen at all since December 2014.
Note that despite all the record lows in the NWAC table, it's important to remember that the Pacific Northwest still has the deepest snowpack of any measurement sites in the United States! The Lyman Lake SNOTEL site (5980 ft) near Holden and the Brown Top SNOTEL site (5830 ft) near Mount Redoubt in the North Cascades each have 98" of snow depth as of April 1, just ahead of 3 SNOTEL sites in Montana which are also over 90". It really goes to show just how spoiled we are in the Northwest by our normal ridiculously large (and very reliable) snowpack, that even in a record-low snow year for the region as a whole, a few of our sites are still atop the entire national heap (and there are over 900 SNOTEL sites throughout the western US including Alaska, along with well over 100 more snow telemetry sites run by other agencies such as NWAC, California Cooperative Snow Surveys, several regional USFS Avalanche Centers, etc). The 98" depth is about 70% of the April 1 normal at Lyman Lake SNOTEL, far better than any site in the NWAC table, while the Brown Top SNOTEL was only installed in 2009 and so normal values are not yet able to be calculated.
Even in Canada, as far as I know, only 2 telemetry sites have a greater April 1 snow depth than the 98" of Lyman Lake and Brown Top, led by the Redfish Creek BCRFC site at 6840 ft in the Selkirk Mountains with 128" as of April 1, about 110% of its normal. Located on the southern border of Kokanee Glacier Provincial Park just NW of Kootenay Lake, this is the 2nd highest snow telemetry site in BC, and it stayed all-snow during several atmospheric river events this season with temps remaining just below freezing. The Azure River BCRFC site at 5330 ft, located over 200 km farther north in the Cariboo Mountains SW of Valemount, also managed to remain all-snow during several of those atmospheric rivers and has 107" as of April 1, about 105% of its normal.
An interesting comparison is to look at the numbers from 2004-5, the last far-below-normal snowpack year in the Northwest, and the most similar year to this one in the historical snowpack record for Washington and northern Oregon. That year, a series of large, very warm atmospheric river events in January destroyed much of the snowpack (it's the warmth and wind that really does the damage, not so much the rainfall which is largely incapable of melting any significant amount of snow). That series of Pineapple Expresses eventually shut down almost all Northwest ski areas except Whistler/Blackcomb, Timberline, and Mount Bachelor. Alpental and the Summit at Snoqualmie closed on January 17, White Pass on January 19, Mount Baker, Stevens Pass, Mount Hood Skibowl, and Mount Hood Meadows closed on January 20, Crystal on January 26, etc. A few of those areas would try to reopen for a few days during late February following modest snowfalls, but it was pretty much a lost cause and none of them managed to stay open at that time. So that was definitely a much worse Northwest lift-served ski-area season than this one, by far!
Sustained heavy snowfall resumed around March 16, 2005, and continued for an entire month, bringing as much as 100-200" of new snowfall during that time. That allowed several Northwest ski areas to reopen by late March (Baker, Mt Hood Meadows) and the first weekend of April (Crystal, Stevens, White Pass, Alpental, Summit West), and stay open for a few weeks through their normal closing dates in mid to late April. Here are the March 15, April 1, and April 15 CLISNO reports for 2005, showing the substantial increase in snowdepths after March 15:
CLIMATOLOGICAL SNOWDEPTH INFORMATION
NORTHWEST WEATHER AND AVALANCHE CENTER SEATTLE WASHINGTON
DAY 15 MONTH 3 YEAR 2005
DATA IN INCHES, -99 DENOTES MISSING DATA
CURRENT CLIMATE PER CENT LAST THRU 2004 THRU 2004
DEPTH AVERAGE OF NORMAL YEAR MAX/YEAR MIN/YEAR
HURRICANE 0 106 0 88 252/1999 32/1981
MT BAKER 15 165 9 150 305/1999 44/1981
STEVENS 18 104 17 84 200/1956 26/1981
SNOQUALMIE 0 93 0 79 195/1956 13/1981
STAMPEDE 0 103 0 86 216/1964 13/1981
MISSION 7 47 15 45 83/1999 20/1976
CRYSTAL 15 68 22 83 136/1999 9/1981
PARADISE 34 171 20 168 357/1956 72/1981
WHITE PASS 0 57 0 63 132/1997 8/1981
TIMBERLINE 39 150 26 195 258/1999 34/1981
MEADOWS 24 126 19 130 288/1974 33/1981
CLIMATOLOGICAL SNOWDEPTH INFORMATION
NORTHWEST WEATHER AND AVALANCHE CENTER SEATTLE WASHINGTON
DAY 1 MONTH 4 YEAR 2005
CURRENT CLIMATE PER CENT LAST THRU 2004 THRU 2004
DEPTH AVERAGE OF NORMAL YEAR MAX/YEAR MIN/YEAR
HURRICANE 42 106 40 95 252/1999 48/1981
MT BAKER 78 175 45 159 311/1999 72/1934
STEVENS 49 101 49 79 192/1956 24/1941
SNOQUALMIE 25 86 29 69 170/1956 2/1992
STAMPEDE 35 101 35 77 183/1956 17/1992
MISSION 21 47 45 44 86/1983 20/1973
CRYSTAL 31 69 45 83 144/1999 16/1981
PARADISE 92 175 53 169 327/1956 66/1941
WHITE PASS 15 54 28 54 110/1997 0/1992
TIMBERLINE 74 164 45 182 300/1999 57/1981
MEADOWS 49 127 39 126 199/1999 55/1992
CLIMATOLOGICAL SNOWDEPTH INFORMATION
NORTHWEST WEATHER AND AVALANCHE CENTER SEATTLE WASHINGTON
DAY 15 MONTH 4 YEAR 2005
CURRENT CLIMATE PER CENT LAST THRU 2004 THRU 2004
DEPTH AVERAGE OF NORMAL YEAR MAX/YEAR MIN/YEAR
HURRICANE 51 112 46 81 252/1999 65/2001
MT BAKER 79 167 47 138 290/1999 56/1934
STEVENS 39 94 41 61 170/1956 17/1941
SNOQUALMIE 16 72 22 35 153/1974 0/1992
STAMPEDE 26 99 26 52 216/1964 9/1992
MISSION 22 47 47 35 79/1983 21/1990
CRYSTAL 36 71 51 69 130/1999 30/1981
PARADISE 91 173 53 147 302/1972 68/1934
WHITE PASS 3 43 7 25 95/1997 0/1992
TIMBERLINE 88 162 54 163 300/1999 71/1977
MEADOWS 54 125 43 114 190/1982 54/1992
THIS TABLE PRODUCED ON THE 1ST AND 15TH BETWEEN 15 NOVEMBER AND 1 MAY.
AVERAGES, MAXIMUMS AND MINIMUMS EARLY IN THE SEASON MAY BE INACCURATE
DUE TO LIMITED DATA.
RECORDS BEGIN: HURRICANE 1979, MT BAKER 1926, STEVENS 1939,
SNOQUALMIE 1929, STAMPEDE 1943, MISSION RIDGE 1970,
CRYSTAL 1967, PARADISE 1926, WHITE PASS 1976,
TIMBERLINE 1973, MT HOOD MEADOWS 1974.
Clearly it was a nightmarish snowpack as of March 15 that year, very similar to this year, but the large gains at all sites by April 1 in 2005 were far more significant than the modest improvements over that same period this year. Several of the sites even continued to increase through April 15 that year.
Another very significant difference in 2005 is that the snowpack rapidly improved heading southward from the central Oregon Cascades into California, with the southern Oregon Cascades much closer to normal than areas farther north, the California Cascades near-normal or slightly above, and the Sierra Nevada enjoying a banner year with far above-normal snowpack. That is in sharpest possible contrast to this year, where the Oregon Cascades snowpack is setting a new record low, and the California statewide snowpack is also at an all-time record low, exceeding the previous record lows of last year 2013-14 and also 1976-77. A typical example of that contrast is Mammoth Mountain on the east side of the southern Sierra Nevada, which in 2005 had an April 1 snowdepth of 180" at its 8900 ft Main Lodge site with snowfall for the season of 534" up to that point and 607" by season's end, over 160% of normal (they closed on July 4, as is typical for them in big snow years). This year, April 1 snowdepth at Mammoth is only 12", with snowfall for the season of 120" thus far, and it is uncertain if they can remain open even into May. Despite its almost Pineapple-proof 8900 ft base elevation, Mammoth's snowfall and snowdepth this year are nevertheless nearly as bad as 3000 ft Snoqualmie Pass.
Other than a few sites near the Lake Tahoe basin (which drains eastward into Nevada) that are part of the NRCS SNOTEL network, California has a separate state-operated system of snow course and telemetry sites. This plot from California Cooperative Snow Surveys shows the California snowpack throughout this season, and also for last year and 2004-5, compared to the historical highs of 1982-83 and the previous record low season of 1976-77. Although 2013-14 was comparably bad to 1976-77, this year is clearly even worse than either of those at only 5% of normal in all 3 regions, and is now by far the new record low year in California's snowpack history, extending back at least 70 years:
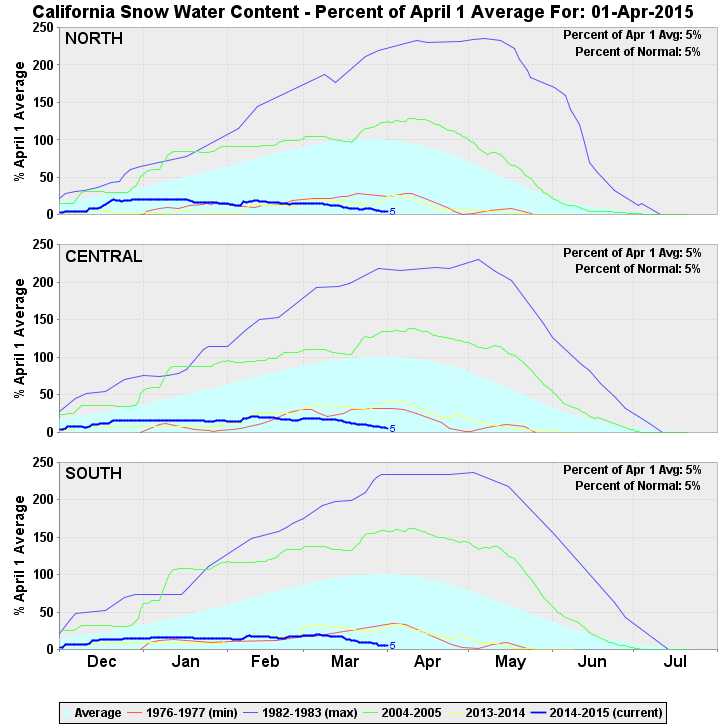
The plots above also clearly show just how good 2004-5 was in California, especially so farther south where it was over 150% of normal by April 1 and then stayed fat throughout the spring. This map makes it easier to visualize the 3 regions shown in the plots above:
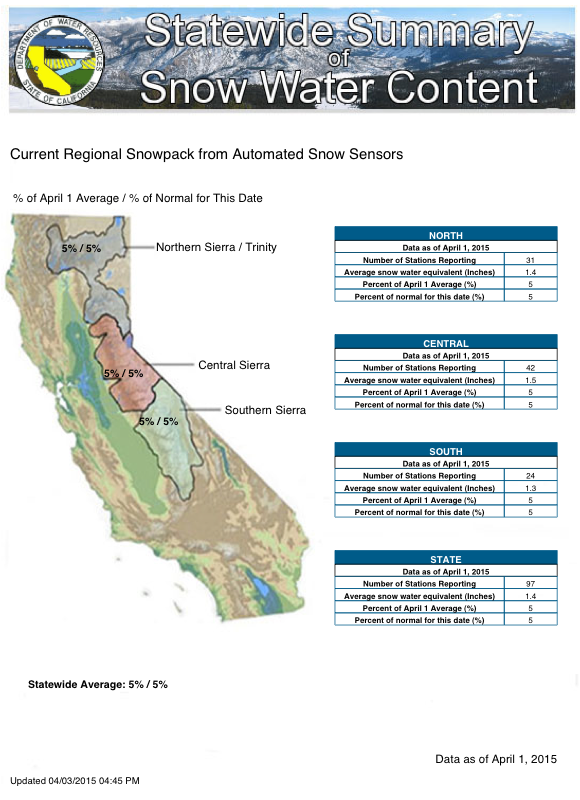
[size=small](Note that the "Northern Sierra / Trinity" region includes the entire California Cascades, apparently it's fashionable in California to pretend that Shasta and Lassen are somehow part of the Sierra!)[/size]
Continued in next post, exceeded 20,000 character limit . . .
Lassen Peak CA reaches 100" snowdepth!! 17Dec2014
Lyman Lake SNOTEL hits 100" snowdepth!?! 05Jan2015
Mt Shasta gets 3 ft new snow in 24 hrs!! 07Feb2015 (see Reply #12 for 10Feb2015 snowpack summary)
2014-15 Snow Season Summary for Western North America, April 2015
(plus a weather forecast outlook through mid-April, looking very snowy!)
By any measure, 2014-15 will go down as one of the most anomalous and unusual snow seasons in the historical record of the Pacific Northwest, and it clearly also ranks among the worst in the subjective judgment of many skiers. But how does this bizarre season really stack up, by the hard numbers? And how does it compare to 2004-5, the most recent far-below-normal snowpack year in the Northwest?
Well, we've now passed April 1, the most important date in the entire year for snow climatology and snowpack measurements. The normal seasonal maximum of mountain snowpacks throughout western North America occurs near April 1, obviously coming a bit earlier at lower elevations and latitudes, and somewhat later at higher elevations and latitudes (even averaging as late as early-mid May at many of the highest snowpack measurement sites). The one single number used most often to characterize an entire season's snowpack in the Northern Hemisphere is the April 1 measurement of snow water content as a percentage of normal (although "normal" is defined differently by various snowpack measurement agencies, as either a median or a mean, and calculated over either the full period of record or just over a fixed interval such as 1981-2010).
So it's time to take a look at the overall state of the mountain snowpack in the Pacific Northwest and also throughout western North America, as this has been a historically anomalous and unusual snow season over much of that vast region. Overall throughout western North America, it's probably the 2nd worst snow year in the past 6 decades, roughly matching 1980-81 and only slightly better than 1976-77, which was the most severe drought year averaged over that entire region since at least the early 1940s. Here is a quick overview of April 1 snowpack (snow water equivalent) from the SNOTEL network throughout the western US:
Shockingly, the April 1 snowpack is below normal in all drainage basins in the entire western US, with only a few isolated areas in the Rockies even close to normal, which had been above normal throughout much the season until March. The situation in BC and Alaska is almost as bad (see below). And the snowpack is really quite far below-normal, with over half of all areas in the western US at less than 50% of normal and a sizable fraction at less than 10% of normal (!!). This season now ranks as the all-time record low for snowpack over a large section of the US West Coast, from the Olympics and central Washington Cascades extending south through the entire Oregon and California Cascades, and continuing over the entire length of the Sierra Nevada, with only isolated locations at higher elevations in that entire area avoiding record lows and being merely well below-normal. There are several more maps below showing the wide extent of the record lows, along with maps for California which has its own state snow survey system separate from the national SNOTEL network.
But it must be said: despite the record-low snowpack and all the rain and Pineapple Expresses, ski conditions throughout the length of the Cascades have still been amazingly good at the right times and places this year, with excellent corn snow during several long sunny stretches, and even some outstanding powder during the last days of December and the first 2 days of April:
April 1-2, 2015, Rainier, Mazama & Cowlitz POWDER!
[size=small](Sorry, just had to include a link to that TR here for posterity, to balance out the bleakness of the rest of this snowpack summary.)[/size]
So let's go ahead and look at the April 1 numbers and maps in more detail, starting close to home and then covering the rest of western North America. The current April 1 CLISNO report from NWAC ( current and older reports are archived here ) shows snowdepths at new record lows at most of the sites they track, and near record lows at the remaining sites:
CLIMATOLOGICAL SNOWDEPTH INFORMATION
NORTHWEST AVALANCHE CENTER SEATTLE WASHINGTON
DAY 1 MONTH 4 YEAR 2015
DATA IN INCHES, -99 DENOTES MISSING DATA
CURRENT CLIMATE PER CENT LAST THRU 2014 THRU 2014
DEPTH AVERAGE OF NORMAL YEAR MAX/YEAR MIN/YEAR
HURRICANE 12 109 11 92 252/1999 42/2005
MT BAKER 17 175 10 173 311/1999 72/1934
STEVENS 22 102 22 109 192/1956 24/1941
SNOQUALMIE 15 86 17 81 170/1956 2/1992
STAMPEDE -99 100 -99 85 183/1956 17/1992
MISSION 0 47 0 45 86/1983 20/1973
CRYSTAL 6 73 8 72 144/1999 16/1981
PARADISE 73 176 41 184 327/1956 66/1941
WHITE PASS 2 57 4 52 110/1997 0/1992
TIMBERLINE 57 165 35 164 300/1999 57/1981
MEADOWS 33 129 26 133 199/2008 49/2005
THIS TABLE PRODUCED ON THE 1ST AND 15TH BETWEEN 15 NOVEMBER AND 1 MAY.
AVERAGES, MAXIMUMS AND MINIMUMS EARLY AND LATE IN THE SEASON MAY BE
INACCURATE DUE TO LIMITED DATA.
IF THERE IS TIE FOR THE MAXIMUM OR MINIMUM SNOW DEPTH THEN THE LATEST
YEAR IS INDICATED.
RECORDS BEGIN: HURRICANE 1979, MT BAKER 1926, STEVENS 1939,
SNOQUALMIE 1929, STAMPEDE 1943, MISSION RIDGE 1970,
CRYSTAL 1967, PARADISE 1926, WHITE PASS 1976,
TIMBERLINE 1973, MT HOOD MEADOWS 1974.
NOTE: NRCS DATA USED AT STAMPEDE STARTING 2006-2007 SEASON.
The most shocking number in that table is clearly at Mount Baker Ski Area (famed for its world record 1140" season snowfall in 1998-99), where the 17" snowdepth is less than 10% of normal and also less than 1/4 of its previous record low for April 1, over an 80+ year period of record. Obviously, none of the numbers in that table are pretty at all. However, both Mount Rainier Paradise and Mount Hood Timberline Lodge are maintaining a quite respectably large snowdepth compared to any typical snow measurement site throughout western North America, and most mountain locations would be thrilled to have a 57" or 73" deep snowpack on April 1. The Paradise and Timberline numbers only look bad when viewed as a percentage of their own exceptionally huge normal snowdepths, which rank among the deepest of any measurement sites in the world.
But the terrible April 1 numbers are actually an improvement, as the situation was even worse 2 weeks earlier in mid-March. Snowdepths at most of these sites have increased since the previous CLISNO report of March 15, somewhat significantly for a few sites:
CLIMATOLOGICAL SNOWDEPTH INFORMATION
NORTHWEST AVALANCHE CENTER SEATTLE WASHINGTON
DAY 15 MONTH 3 YEAR 2015
CURRENT CLIMATE PER CENT LAST THRU 2014 THRU 2014
DEPTH AVERAGE OF NORMAL YEAR MAX/YEAR MIN/YEAR
HURRICANE 6 104 6 72 252/1999 8/2005
MT BAKER 14 165 8 142 305/1999 15/2005
STEVENS 24 103 23 115 200/1956 18/2005
SNOQUALMIE 0 92 0 84 195/1956 0/2005
STAMPEDE -99 100 -99 82 216/1964 0/2005
MISSION 5 46 11 42 83/1999 7/2005
CRYSTAL 5 70 7 62 136/1999 9/1981
PARADISE 57 169 34 160 357/1956 34/2005
WHITE PASS 0 58 0 49 132/1997 0/2005
TIMBERLINE 41 149 28 131 258/1999 34/1981
MEADOWS 26 125 21 106 288/1974 24/2005
A major pattern shift occurred on March 12 this year, as was fairly well predicted by global weather models including the GFS even 10-12 days before it occurred. The weather pattern has been significantly wetter in the Pacific Northwest since then, with temperatures closer to normal at first, and then even dipping below normal for the first time in 2015 by the last week of March and into the start of April, bringing a sustained cool and wet pattern which had not been seen at all since December 2014.
Note that despite all the record lows in the NWAC table, it's important to remember that the Pacific Northwest still has the deepest snowpack of any measurement sites in the United States! The Lyman Lake SNOTEL site (5980 ft) near Holden and the Brown Top SNOTEL site (5830 ft) near Mount Redoubt in the North Cascades each have 98" of snow depth as of April 1, just ahead of 3 SNOTEL sites in Montana which are also over 90". It really goes to show just how spoiled we are in the Northwest by our normal ridiculously large (and very reliable) snowpack, that even in a record-low snow year for the region as a whole, a few of our sites are still atop the entire national heap (and there are over 900 SNOTEL sites throughout the western US including Alaska, along with well over 100 more snow telemetry sites run by other agencies such as NWAC, California Cooperative Snow Surveys, several regional USFS Avalanche Centers, etc). The 98" depth is about 70% of the April 1 normal at Lyman Lake SNOTEL, far better than any site in the NWAC table, while the Brown Top SNOTEL was only installed in 2009 and so normal values are not yet able to be calculated.
Even in Canada, as far as I know, only 2 telemetry sites have a greater April 1 snow depth than the 98" of Lyman Lake and Brown Top, led by the Redfish Creek BCRFC site at 6840 ft in the Selkirk Mountains with 128" as of April 1, about 110% of its normal. Located on the southern border of Kokanee Glacier Provincial Park just NW of Kootenay Lake, this is the 2nd highest snow telemetry site in BC, and it stayed all-snow during several atmospheric river events this season with temps remaining just below freezing. The Azure River BCRFC site at 5330 ft, located over 200 km farther north in the Cariboo Mountains SW of Valemount, also managed to remain all-snow during several of those atmospheric rivers and has 107" as of April 1, about 105% of its normal.
An interesting comparison is to look at the numbers from 2004-5, the last far-below-normal snowpack year in the Northwest, and the most similar year to this one in the historical snowpack record for Washington and northern Oregon. That year, a series of large, very warm atmospheric river events in January destroyed much of the snowpack (it's the warmth and wind that really does the damage, not so much the rainfall which is largely incapable of melting any significant amount of snow). That series of Pineapple Expresses eventually shut down almost all Northwest ski areas except Whistler/Blackcomb, Timberline, and Mount Bachelor. Alpental and the Summit at Snoqualmie closed on January 17, White Pass on January 19, Mount Baker, Stevens Pass, Mount Hood Skibowl, and Mount Hood Meadows closed on January 20, Crystal on January 26, etc. A few of those areas would try to reopen for a few days during late February following modest snowfalls, but it was pretty much a lost cause and none of them managed to stay open at that time. So that was definitely a much worse Northwest lift-served ski-area season than this one, by far!
Sustained heavy snowfall resumed around March 16, 2005, and continued for an entire month, bringing as much as 100-200" of new snowfall during that time. That allowed several Northwest ski areas to reopen by late March (Baker, Mt Hood Meadows) and the first weekend of April (Crystal, Stevens, White Pass, Alpental, Summit West), and stay open for a few weeks through their normal closing dates in mid to late April. Here are the March 15, April 1, and April 15 CLISNO reports for 2005, showing the substantial increase in snowdepths after March 15:
CLIMATOLOGICAL SNOWDEPTH INFORMATION
NORTHWEST WEATHER AND AVALANCHE CENTER SEATTLE WASHINGTON
DAY 15 MONTH 3 YEAR 2005
DATA IN INCHES, -99 DENOTES MISSING DATA
CURRENT CLIMATE PER CENT LAST THRU 2004 THRU 2004
DEPTH AVERAGE OF NORMAL YEAR MAX/YEAR MIN/YEAR
HURRICANE 0 106 0 88 252/1999 32/1981
MT BAKER 15 165 9 150 305/1999 44/1981
STEVENS 18 104 17 84 200/1956 26/1981
SNOQUALMIE 0 93 0 79 195/1956 13/1981
STAMPEDE 0 103 0 86 216/1964 13/1981
MISSION 7 47 15 45 83/1999 20/1976
CRYSTAL 15 68 22 83 136/1999 9/1981
PARADISE 34 171 20 168 357/1956 72/1981
WHITE PASS 0 57 0 63 132/1997 8/1981
TIMBERLINE 39 150 26 195 258/1999 34/1981
MEADOWS 24 126 19 130 288/1974 33/1981
CLIMATOLOGICAL SNOWDEPTH INFORMATION
NORTHWEST WEATHER AND AVALANCHE CENTER SEATTLE WASHINGTON
DAY 1 MONTH 4 YEAR 2005
CURRENT CLIMATE PER CENT LAST THRU 2004 THRU 2004
DEPTH AVERAGE OF NORMAL YEAR MAX/YEAR MIN/YEAR
HURRICANE 42 106 40 95 252/1999 48/1981
MT BAKER 78 175 45 159 311/1999 72/1934
STEVENS 49 101 49 79 192/1956 24/1941
SNOQUALMIE 25 86 29 69 170/1956 2/1992
STAMPEDE 35 101 35 77 183/1956 17/1992
MISSION 21 47 45 44 86/1983 20/1973
CRYSTAL 31 69 45 83 144/1999 16/1981
PARADISE 92 175 53 169 327/1956 66/1941
WHITE PASS 15 54 28 54 110/1997 0/1992
TIMBERLINE 74 164 45 182 300/1999 57/1981
MEADOWS 49 127 39 126 199/1999 55/1992
CLIMATOLOGICAL SNOWDEPTH INFORMATION
NORTHWEST WEATHER AND AVALANCHE CENTER SEATTLE WASHINGTON
DAY 15 MONTH 4 YEAR 2005
CURRENT CLIMATE PER CENT LAST THRU 2004 THRU 2004
DEPTH AVERAGE OF NORMAL YEAR MAX/YEAR MIN/YEAR
HURRICANE 51 112 46 81 252/1999 65/2001
MT BAKER 79 167 47 138 290/1999 56/1934
STEVENS 39 94 41 61 170/1956 17/1941
SNOQUALMIE 16 72 22 35 153/1974 0/1992
STAMPEDE 26 99 26 52 216/1964 9/1992
MISSION 22 47 47 35 79/1983 21/1990
CRYSTAL 36 71 51 69 130/1999 30/1981
PARADISE 91 173 53 147 302/1972 68/1934
WHITE PASS 3 43 7 25 95/1997 0/1992
TIMBERLINE 88 162 54 163 300/1999 71/1977
MEADOWS 54 125 43 114 190/1982 54/1992
THIS TABLE PRODUCED ON THE 1ST AND 15TH BETWEEN 15 NOVEMBER AND 1 MAY.
AVERAGES, MAXIMUMS AND MINIMUMS EARLY IN THE SEASON MAY BE INACCURATE
DUE TO LIMITED DATA.
RECORDS BEGIN: HURRICANE 1979, MT BAKER 1926, STEVENS 1939,
SNOQUALMIE 1929, STAMPEDE 1943, MISSION RIDGE 1970,
CRYSTAL 1967, PARADISE 1926, WHITE PASS 1976,
TIMBERLINE 1973, MT HOOD MEADOWS 1974.
Clearly it was a nightmarish snowpack as of March 15 that year, very similar to this year, but the large gains at all sites by April 1 in 2005 were far more significant than the modest improvements over that same period this year. Several of the sites even continued to increase through April 15 that year.
Another very significant difference in 2005 is that the snowpack rapidly improved heading southward from the central Oregon Cascades into California, with the southern Oregon Cascades much closer to normal than areas farther north, the California Cascades near-normal or slightly above, and the Sierra Nevada enjoying a banner year with far above-normal snowpack. That is in sharpest possible contrast to this year, where the Oregon Cascades snowpack is setting a new record low, and the California statewide snowpack is also at an all-time record low, exceeding the previous record lows of last year 2013-14 and also 1976-77. A typical example of that contrast is Mammoth Mountain on the east side of the southern Sierra Nevada, which in 2005 had an April 1 snowdepth of 180" at its 8900 ft Main Lodge site with snowfall for the season of 534" up to that point and 607" by season's end, over 160% of normal (they closed on July 4, as is typical for them in big snow years). This year, April 1 snowdepth at Mammoth is only 12", with snowfall for the season of 120" thus far, and it is uncertain if they can remain open even into May. Despite its almost Pineapple-proof 8900 ft base elevation, Mammoth's snowfall and snowdepth this year are nevertheless nearly as bad as 3000 ft Snoqualmie Pass.
Other than a few sites near the Lake Tahoe basin (which drains eastward into Nevada) that are part of the NRCS SNOTEL network, California has a separate state-operated system of snow course and telemetry sites. This plot from California Cooperative Snow Surveys shows the California snowpack throughout this season, and also for last year and 2004-5, compared to the historical highs of 1982-83 and the previous record low season of 1976-77. Although 2013-14 was comparably bad to 1976-77, this year is clearly even worse than either of those at only 5% of normal in all 3 regions, and is now by far the new record low year in California's snowpack history, extending back at least 70 years:
The plots above also clearly show just how good 2004-5 was in California, especially so farther south where it was over 150% of normal by April 1 and then stayed fat throughout the spring. This map makes it easier to visualize the 3 regions shown in the plots above:
[size=small](Note that the "Northern Sierra / Trinity" region includes the entire California Cascades, apparently it's fashionable in California to pretend that Shasta and Lassen are somehow part of the Sierra!)[/size]
Continued in next post, exceeded 20,000 character limit . . .
Please Log in or Create an account to join the conversation.
- Amar Andalkar
- [andalkar]
-
Topic Author
- Offline
- Premium Member
-
Less
More
- Posts: 635
- Thank you received: 0
05 Apr 2015 00:26 - 10 Apr 2015 08:14 #224356
by Amar Andalkar
Replied by Amar Andalkar on topic Re: 2014-15 Snow Season Summary, April 2015
Continued from previous post . . .
So let's return to the overview of the entire western US, and take a look in more detail. Here's the same view of April 1 snowpack conditions from the SNOTEL network, which was shown above:
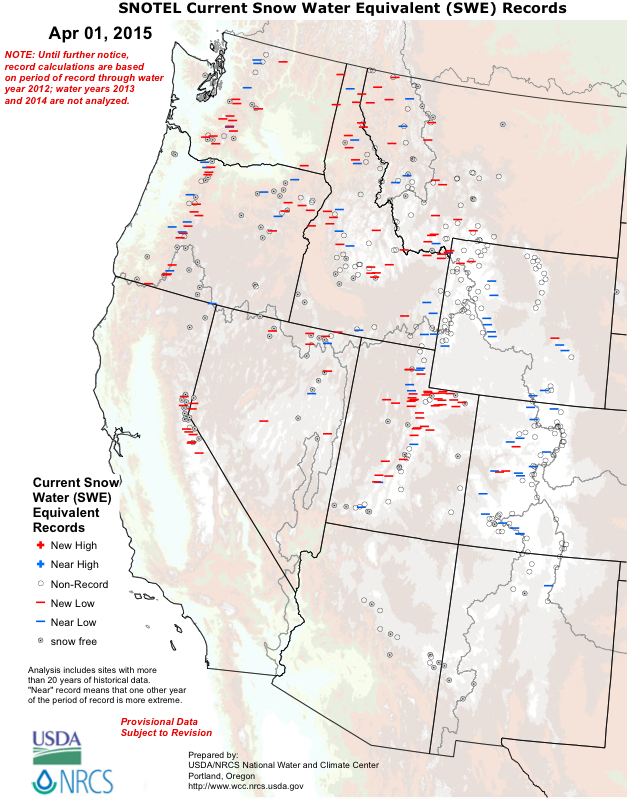
As mentioned earlier, the April 1 snowpack is below normal in all drainage basins in the entire western US, with over half of all basins at less than 50% of normal and a sizable fraction at less than 10% of normal. But how do those values compare to previous record lows? Luckily the NRCS makes it easy to answer that question, with a nice plot which marks new records and near-records at every SNOTEL site in the western US:
[size=small](Note that all sites marked as "snow free" are obviously at least tied for their record low.)[/size]
So this year has set new April 1 snowpack record lows and near-record lows at the majority of SNOTEL sites throughout the Washington and Oregon Cascades, the Lake Tahoe basin, and Utah, with a significant smattering of similar records and near-record lows in the Wallowas and Nevada plus many sites in the Rockies of Idaho, Montana, Wyoming, and Colorado. The snowpack misery of 2014-15 has clearly not been confined to our corner of the country at all. In the Cascades and Sierra Nevada, the higher elevation sites in general are the only ones which are not at new record lows.
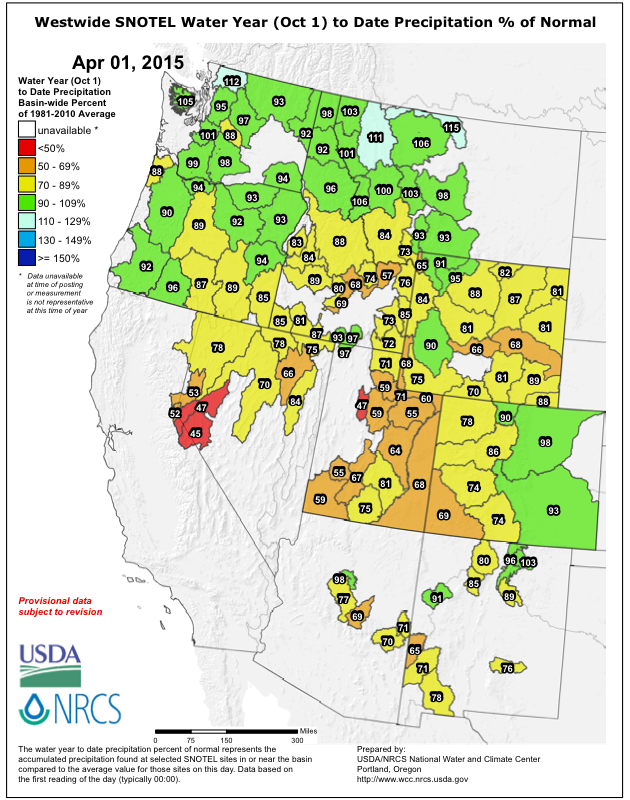
For comparison, this is the water-year-to-date precipitation (since Oct 1) as a percent of normal, which in sharp contrast to SWE remains near-normal and even above normal throughout the Northwest, just as it has been throughout this season. A similar bounty of above-normal precip is found only in Montana, with near-normal in parts of Idaho, Wyoming, Colorado, and New Mexico. The rest of the West is pretty much solidly below-normal for precip this year, most severely so in the Lake Tahoe basin (along with the rest of the Sierra not shown on this map) and in Utah:
Here's a similar view of new records and near-records for water-year-to-date precipitation at every SNOTEL site in the western US:
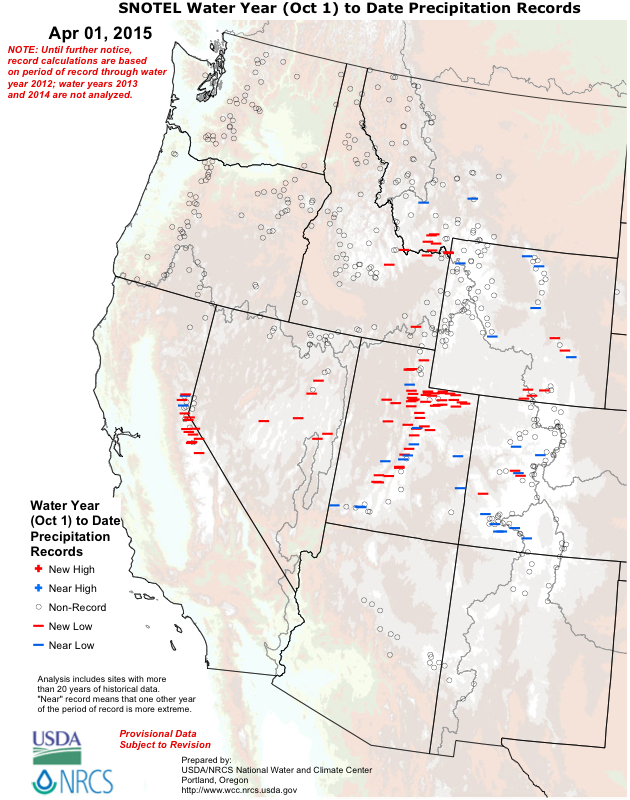
The same contrast is seen here again, with the Pacific Northwest (including most of the Inland Northwest) not even close to record lows for precip, while the majority of sites in the Lake Tahoe basin, central Nevada, and throughout Utah are setting new precip lows, along with a scattered number of sites in the Rockies of southern Montana, Wyoming, and Colorado.
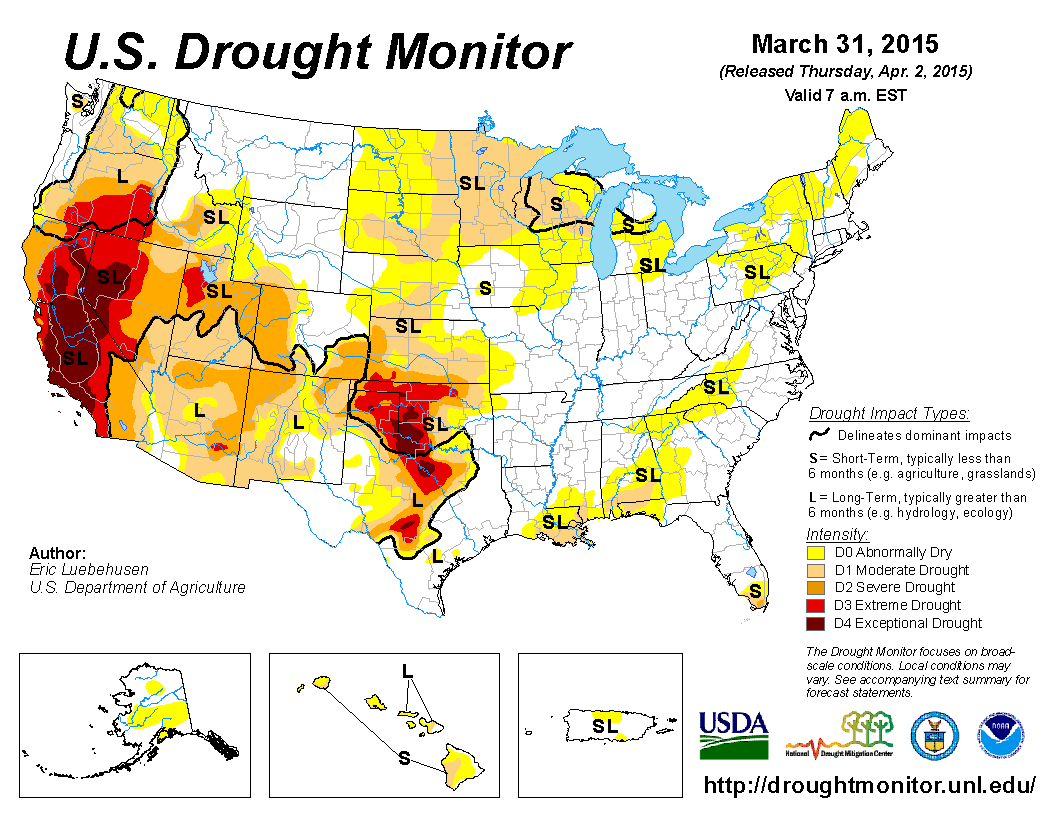
At least we are very fortunate in most of the Northwest to not be dealing with severe drought, unlike California which is in its 4th year of unprecedented extreme drought, and places like Utah and much of the Southwest which are headed towards severe drought given their far below-normal snowpack and precip:
So what did the rest of the western US look like in 2004-5? The NRCS (quite amazingly) has a daily archive of the various maps shown above (and many more types too) available freely online, which makes it easy to go back and look up the snowpack conditions over the entire western US or for any western state for any previous date -- but that extends back only to 2008. For earlier years, there is an archive of snowpack maps for the 1st of each month from January to May, extending back to 1980, at www.wcc.nrcs.usda.gov/gis/snow.html (these maps include data from both SNOTEL and monthly snow course sites, along with data from California Cooperative Snow Surveys covering the rest of that state, so they are more comprehensive). Here is the snowpack throughout the western US for April 1, 2005:
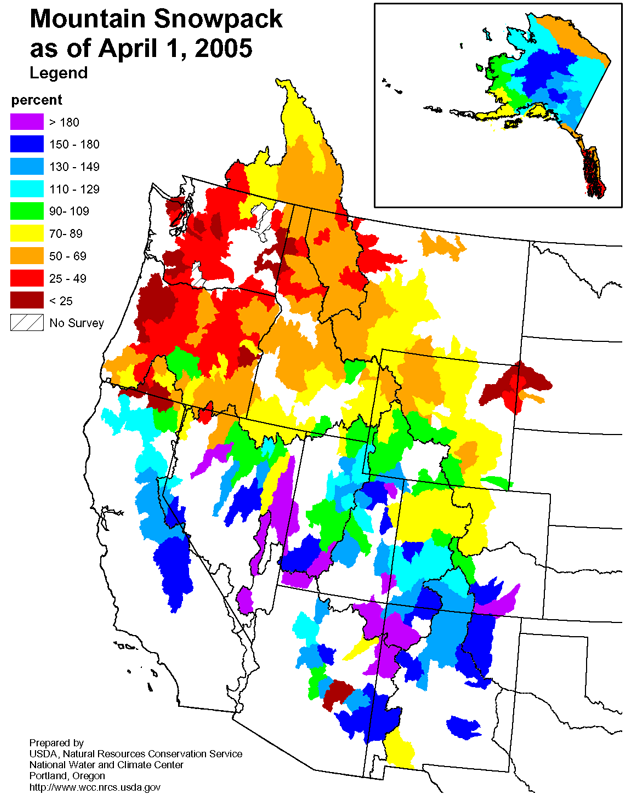
As we saw above, the April 2005 snowpack was less than 50% of normal in much of the Northwest, but improved rapidly by heading southward from southern Oregon into California, eventually exceeding 150% of normal in the southern Sierra. This same north-south snowpack gradient held true for the rest of the western US too, with below normal snowpack in the Northern Rockies and far above normal throughout the Southwest and the Southern Rockies. So even though 2004-5 was the most similar snowpack year in the Northwest to the current one, overall it was not very similar at all throughout the western US.
What about Alaska? Here is April 1 snowpack (snow water equivalent) as a percent of normal from the SNOTEL network:
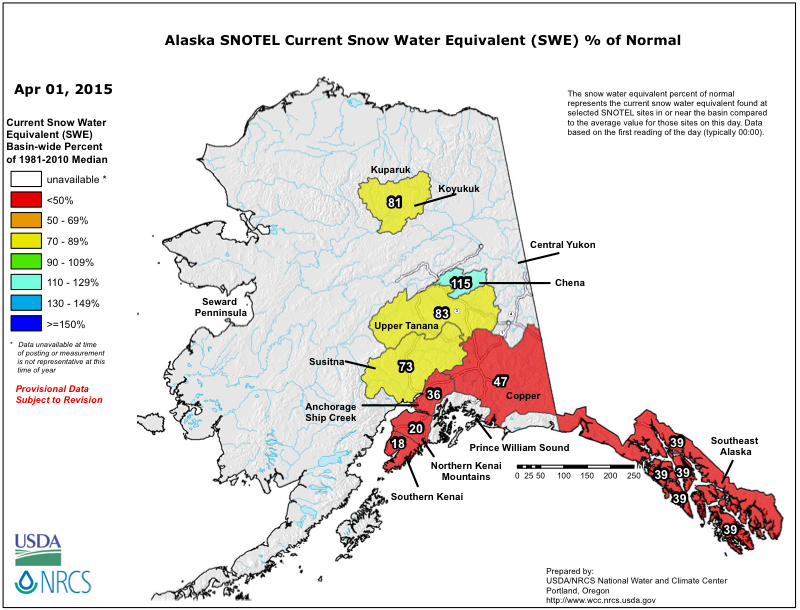
Alaska is also suffering through a far below-normal snowpack season especially in the coastal mountain ranges, worst in south-central Alaska and only slightly better in southeast Alaska. Despite significant snowfall at higher elevations in March (in south-central AK, "higher elevations" means above 2000 ft!), the snowpack has not improved much overall. The main problem in Alaska the entire season has been the same as in the Pacific Northwest: plenty of precip, but most of it arriving in atmospheric river events with high freezing levels.
Looking at the water-year-to-date precipitation (since Oct 1) as a percent of normal shows this clearly, as in sharp contrast to SWE, the precip remains near-normal throughout most of coastal Alaska, just as in the Pacific Northwest:
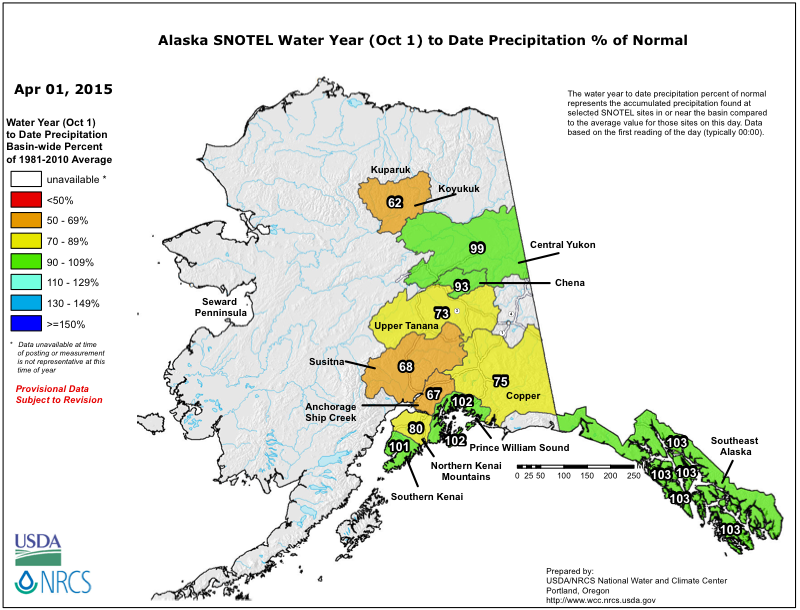
Precip in the Alaskan interior has been somewhat below normal, but temps have clearly been cold enough there to build a snowpack much closer to normal. Note that the NRCS does not appear to offer any graphics showing record high/low SWE and precip for Alaska as it does for the western US, so it is uncertain whether the Alaskan coastal snowpack is near record lows or not.
How was 2004-5 in Alaska? Here's the Alaska snowpack for April 1 that year, which shows a far below-normal snowpack in southeast Alaska (matching the situation in the Pacific Northwest), increasing closer to normal in south-central Alaska and then quickly building far above normal in the interior:
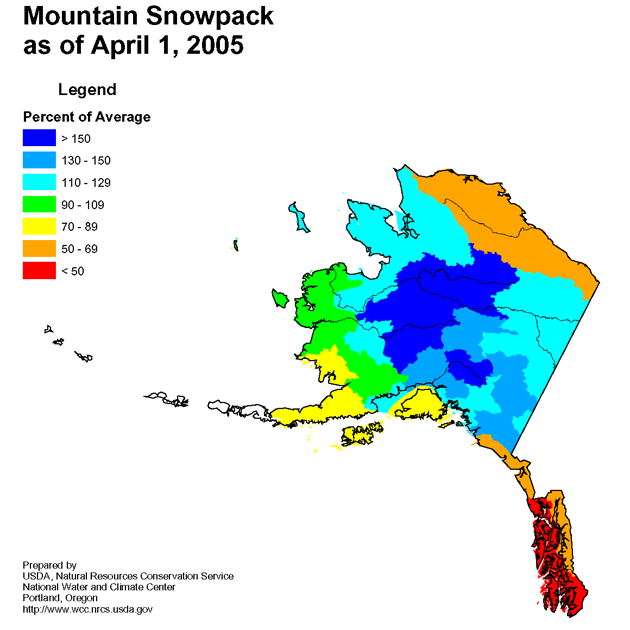
The sharp north-south snowpack gradient across most of Alaska that year (excluding the North Slope adjacent to the Arctic Ocean) roughly mirrors the gradient seen for the entire western US above, with the opposite sign.
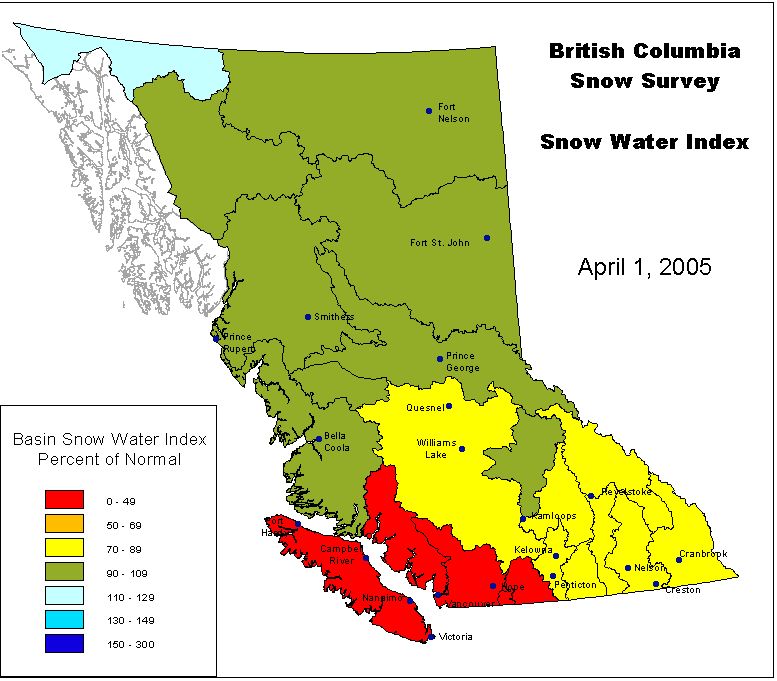
What about the missing piece of the western North American snowpack puzzle that we have yet to cover, Beautiful British Columbia? The BC River Forecast Centre has just released its April 1 snowpack report on April 8 (daily updated maps are not available for BC, only once a month and scheduled for release about a week after the date of the report):
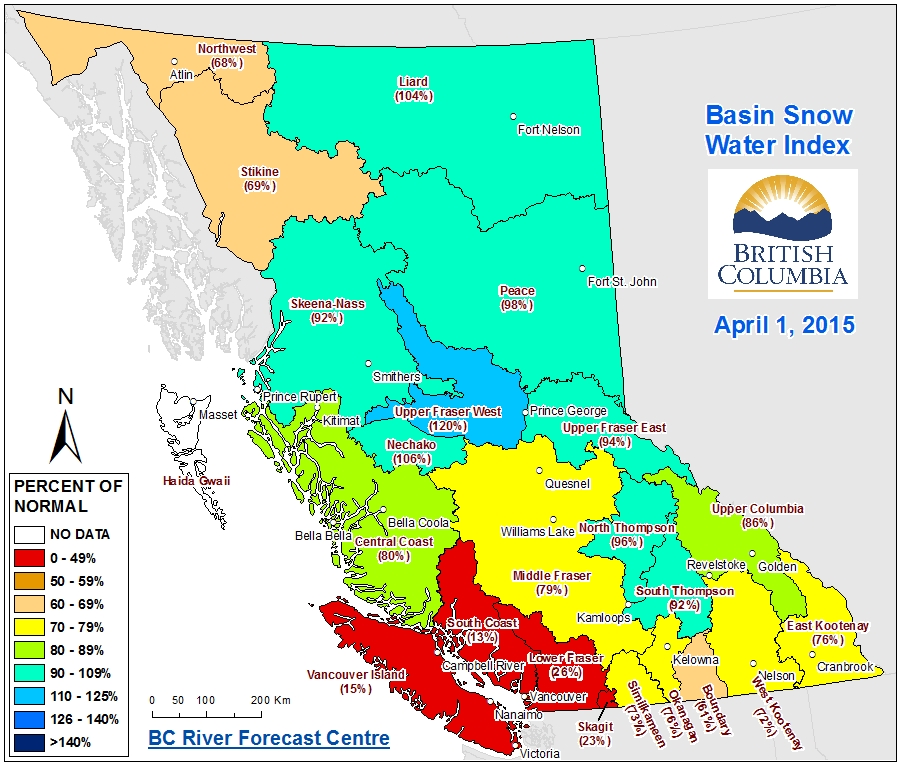
The snowpack in southwestern BC is far below-normal, while most of the rest of the province is closer to normal. The central and northern Coast Mountains are doing much better for snowpack this season in sharp contrast to the southern parts of the same range. The interior of southeastern BC is somewhat below-normal, while areas farther to the north are near-normal. Overall, averaged over the entire province, the snowpack is significantly below normal, just as in the rest of western North America. According to the April 1 snow survey bulletin, the average of all provincial snow water equivalent measurements is 73% of normal, the second lowest in the past 31 years of record.
A map of water-year-to-date precipitation does not appear to be readily available online for BC.
The situation was quite similar in 2004-5, with a far below-normal snowpack in southwestern BC, somewhat below-normal in southeastern BC, and near-normal farther north:
So that covers most of the available snowpack data for western North America, except Alberta which doesn't seem to have the same type of snowpack overview graphics available online (see environment.alberta.ca/forecasting/reports/). Being located immediately adjacent to British Columbia on the dry side of the Continental Divide through the Canadian Rockies, the Alberta mountain snowpack probably is a reasonably close match to that of the adjacent Upper Fraser East, Upper Columbia, and East Kootenay basins of BC.
There's another set of snow data that is also of interest too. How have ski areas throughout the West been doing for snowfall this season?
Tony Crocker's informative website BestSnow.net has season summaries covering snowfall at many ski areas throughout North America over the past 2 decades, with season progress reports updated every 2 weeks from November to April covering several dozen ski areas, and a final season summary published in late spring with data for over 100 ski areas (see the main list of these reports at www.bestsnow.net/snowrpts.htm). Although seasonal snowfall and April 1 snowpack are generally well-correlated at most mountain sites, it's not always a perfect correspondence, especially in a highly unusual season such as this one, with rain at high freezing levels extending well into the interior of BC and the intermountain region of Idaho and Montana during several of the strongest atmospheric river events. So Crocker's emphasis on snowfall versus snowpack provides another complementary view of snow conditions.
According to his April 1 update, "the West remains on track to match its second worst snow season of 1980-81, with a few areas threatening the record lows of 1976-77." The tables in his update show not a single ski area in all of western North America with over 100% of normal snowfall for the season as of April 1, with snowfall averaging about 20-60% of normal throughout the Pacific Northwest and Sierra Nevada, 60-90% of normal in the Canadian Rockies and interior BC, 50-70% of normal in the northern US Rockies (MT, ID, WY) and in Utah, and 60-90% of normal in Colorado. These numbers generally match the snowpack data from SNOTEL sites in the same regions fairly well, except in the Pacific Northwest which has a higher percentage of low-elevation sites with minimal snowpack.
What does the weather outlook for the next 2 weeks look like? First of all, there's a major snowstorm predicted for the California Cascades and Klamath Mountains from Sunday through Tuesday, with heavy snowfall also extending south through the Sierra Nevada and north through the Oregon Cascades into the southern Washington Cascades.
A powerful, cold, closed upper-level low has already developed a few days ago in the Gulf of Alaska and moved off the BC coast near Haida Gwaii today, and it will continue moving southward off the northern California coast over the next couple days. Cold closed / cutoff lows are THE classic pattern for delivering heavy snowfall with low snow levels to northern California, as they provide a mechanism for transporting a pool of cold upper level air southward in latitude to that region, and the associated instability ensures the generation of large amounts of precip spawned from the Pacific.
Here is a view of the fully-formed and deepened closed low from Thursday morning's UW WRF-GFS model run:
And here is what the current Saturday evening model run predicts that the low will look like by Monday evening, when the heaviest snowfall is expected to begin in northern California:
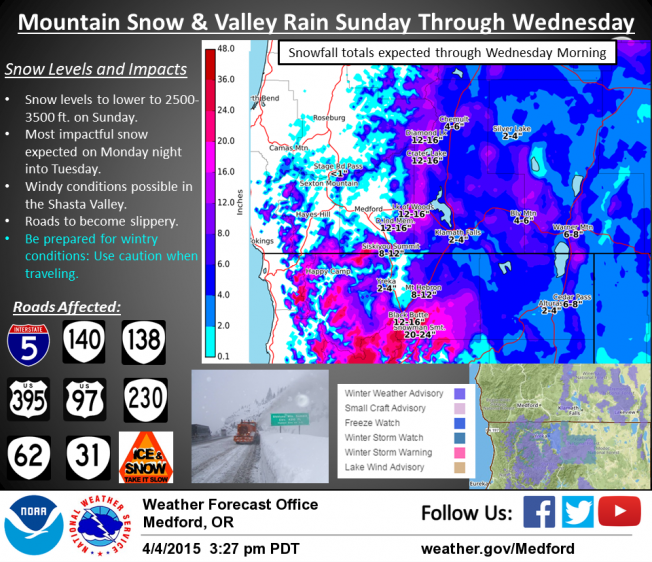
The high-resolution UW model is predicting new snowfall amounts of up to 2-4 ft over the 72 hour period through Wednesday morning for the Mount Shasta and Lassen Peak areas, with snow levels as low as 2-3000 ft, well below the level of Shasta City at 3500 ft. These would be the lowest snow levels of any storm thus far in 2015 in that area, and even in town there, snowfall amounts could exceed 1 ft. The current Weather Story from the NWS Medford Forecast Office predicts 12-16" of new snow at Black Butte Summit (3900 ft) on I-5 and 20-24" at Snowman Summit (4500 ft) on SR 89, each located on the west and south flanks of Mount Shasta respectively:
Snowfall amounts of 1-3 ft are predicted to extend south through the Sierra Nevada and north through the Oregon Cascades, with about 1-2 ft extending farther north into the southern Washington Cascades and very little snow for northern Washington:
Higher resolution version of that, showing the Pacific Northwest and also zoomed in on Washington and Oregon:
And also a quickly-Photoshopped zoom in on northernmost California, showing maximum amounts of 4+ ft (marked by white inside yellow) on Mount Shasta and near Castle Crags, with amounts of up to 3 ft on Lassen Peak and throughout much of the Klamath Mountains:
The majority of that snowfall is expected during a 24-hour period through Tuesday morning, with snowfall rates predicted to exceed 2-3" per hour at the peak of the storm Monday evening. It will be very interesting to see if these model predictions verify, as that is still 2 days away. Recent model runs over the past couple days have been very consistent in their predictions of this storm system.
After that intense storm system, a brief ridge is expected to build for the rest of the week through Friday, followed by another system arriving on Friday into the weekend. This one may be aimed much farther north this time into southwestern BC, Washington, and Oregon, with additional snowfall of up to 1-2 ft for the Washington and Oregon Cascades:
The extended GFS model out to 384 hours (16 days) shows continued precip and an active stormy weather pattern over the West Coast during the 8-16 day period through April 20. This is the predicted 24-hour precip throughout that period, click "Loop All" to see all the graphics (3 hour intervals up to 240 hours, 12 hour intervals beyond that):
GFS, North Pacific, 04/05/2015 00UTC, precip_p24
This graphic shows the total accumulated precip predicted by the GFS model over the entire 16 day period through Monday evening, April 20, with amounts of over 5" shown for parts of the Cascades and northern California:
But the 8-16 day period is a long way off, and models are often quite unreliable more than 1 week out, so take those predictions with a large grain of salt.
So let's return to the overview of the entire western US, and take a look in more detail. Here's the same view of April 1 snowpack conditions from the SNOTEL network, which was shown above:
As mentioned earlier, the April 1 snowpack is below normal in all drainage basins in the entire western US, with over half of all basins at less than 50% of normal and a sizable fraction at less than 10% of normal. But how do those values compare to previous record lows? Luckily the NRCS makes it easy to answer that question, with a nice plot which marks new records and near-records at every SNOTEL site in the western US:
[size=small](Note that all sites marked as "snow free" are obviously at least tied for their record low.)[/size]
So this year has set new April 1 snowpack record lows and near-record lows at the majority of SNOTEL sites throughout the Washington and Oregon Cascades, the Lake Tahoe basin, and Utah, with a significant smattering of similar records and near-record lows in the Wallowas and Nevada plus many sites in the Rockies of Idaho, Montana, Wyoming, and Colorado. The snowpack misery of 2014-15 has clearly not been confined to our corner of the country at all. In the Cascades and Sierra Nevada, the higher elevation sites in general are the only ones which are not at new record lows.
For comparison, this is the water-year-to-date precipitation (since Oct 1) as a percent of normal, which in sharp contrast to SWE remains near-normal and even above normal throughout the Northwest, just as it has been throughout this season. A similar bounty of above-normal precip is found only in Montana, with near-normal in parts of Idaho, Wyoming, Colorado, and New Mexico. The rest of the West is pretty much solidly below-normal for precip this year, most severely so in the Lake Tahoe basin (along with the rest of the Sierra not shown on this map) and in Utah:
Here's a similar view of new records and near-records for water-year-to-date precipitation at every SNOTEL site in the western US:
The same contrast is seen here again, with the Pacific Northwest (including most of the Inland Northwest) not even close to record lows for precip, while the majority of sites in the Lake Tahoe basin, central Nevada, and throughout Utah are setting new precip lows, along with a scattered number of sites in the Rockies of southern Montana, Wyoming, and Colorado.
At least we are very fortunate in most of the Northwest to not be dealing with severe drought, unlike California which is in its 4th year of unprecedented extreme drought, and places like Utah and much of the Southwest which are headed towards severe drought given their far below-normal snowpack and precip:
So what did the rest of the western US look like in 2004-5? The NRCS (quite amazingly) has a daily archive of the various maps shown above (and many more types too) available freely online, which makes it easy to go back and look up the snowpack conditions over the entire western US or for any western state for any previous date -- but that extends back only to 2008. For earlier years, there is an archive of snowpack maps for the 1st of each month from January to May, extending back to 1980, at www.wcc.nrcs.usda.gov/gis/snow.html (these maps include data from both SNOTEL and monthly snow course sites, along with data from California Cooperative Snow Surveys covering the rest of that state, so they are more comprehensive). Here is the snowpack throughout the western US for April 1, 2005:
As we saw above, the April 2005 snowpack was less than 50% of normal in much of the Northwest, but improved rapidly by heading southward from southern Oregon into California, eventually exceeding 150% of normal in the southern Sierra. This same north-south snowpack gradient held true for the rest of the western US too, with below normal snowpack in the Northern Rockies and far above normal throughout the Southwest and the Southern Rockies. So even though 2004-5 was the most similar snowpack year in the Northwest to the current one, overall it was not very similar at all throughout the western US.
What about Alaska? Here is April 1 snowpack (snow water equivalent) as a percent of normal from the SNOTEL network:
Alaska is also suffering through a far below-normal snowpack season especially in the coastal mountain ranges, worst in south-central Alaska and only slightly better in southeast Alaska. Despite significant snowfall at higher elevations in March (in south-central AK, "higher elevations" means above 2000 ft!), the snowpack has not improved much overall. The main problem in Alaska the entire season has been the same as in the Pacific Northwest: plenty of precip, but most of it arriving in atmospheric river events with high freezing levels.
Looking at the water-year-to-date precipitation (since Oct 1) as a percent of normal shows this clearly, as in sharp contrast to SWE, the precip remains near-normal throughout most of coastal Alaska, just as in the Pacific Northwest:
Precip in the Alaskan interior has been somewhat below normal, but temps have clearly been cold enough there to build a snowpack much closer to normal. Note that the NRCS does not appear to offer any graphics showing record high/low SWE and precip for Alaska as it does for the western US, so it is uncertain whether the Alaskan coastal snowpack is near record lows or not.
How was 2004-5 in Alaska? Here's the Alaska snowpack for April 1 that year, which shows a far below-normal snowpack in southeast Alaska (matching the situation in the Pacific Northwest), increasing closer to normal in south-central Alaska and then quickly building far above normal in the interior:
The sharp north-south snowpack gradient across most of Alaska that year (excluding the North Slope adjacent to the Arctic Ocean) roughly mirrors the gradient seen for the entire western US above, with the opposite sign.
What about the missing piece of the western North American snowpack puzzle that we have yet to cover, Beautiful British Columbia? The BC River Forecast Centre has just released its April 1 snowpack report on April 8 (daily updated maps are not available for BC, only once a month and scheduled for release about a week after the date of the report):
The snowpack in southwestern BC is far below-normal, while most of the rest of the province is closer to normal. The central and northern Coast Mountains are doing much better for snowpack this season in sharp contrast to the southern parts of the same range. The interior of southeastern BC is somewhat below-normal, while areas farther to the north are near-normal. Overall, averaged over the entire province, the snowpack is significantly below normal, just as in the rest of western North America. According to the April 1 snow survey bulletin, the average of all provincial snow water equivalent measurements is 73% of normal, the second lowest in the past 31 years of record.
A map of water-year-to-date precipitation does not appear to be readily available online for BC.
The situation was quite similar in 2004-5, with a far below-normal snowpack in southwestern BC, somewhat below-normal in southeastern BC, and near-normal farther north:
So that covers most of the available snowpack data for western North America, except Alberta which doesn't seem to have the same type of snowpack overview graphics available online (see environment.alberta.ca/forecasting/reports/). Being located immediately adjacent to British Columbia on the dry side of the Continental Divide through the Canadian Rockies, the Alberta mountain snowpack probably is a reasonably close match to that of the adjacent Upper Fraser East, Upper Columbia, and East Kootenay basins of BC.
There's another set of snow data that is also of interest too. How have ski areas throughout the West been doing for snowfall this season?
Tony Crocker's informative website BestSnow.net has season summaries covering snowfall at many ski areas throughout North America over the past 2 decades, with season progress reports updated every 2 weeks from November to April covering several dozen ski areas, and a final season summary published in late spring with data for over 100 ski areas (see the main list of these reports at www.bestsnow.net/snowrpts.htm). Although seasonal snowfall and April 1 snowpack are generally well-correlated at most mountain sites, it's not always a perfect correspondence, especially in a highly unusual season such as this one, with rain at high freezing levels extending well into the interior of BC and the intermountain region of Idaho and Montana during several of the strongest atmospheric river events. So Crocker's emphasis on snowfall versus snowpack provides another complementary view of snow conditions.
According to his April 1 update, "the West remains on track to match its second worst snow season of 1980-81, with a few areas threatening the record lows of 1976-77." The tables in his update show not a single ski area in all of western North America with over 100% of normal snowfall for the season as of April 1, with snowfall averaging about 20-60% of normal throughout the Pacific Northwest and Sierra Nevada, 60-90% of normal in the Canadian Rockies and interior BC, 50-70% of normal in the northern US Rockies (MT, ID, WY) and in Utah, and 60-90% of normal in Colorado. These numbers generally match the snowpack data from SNOTEL sites in the same regions fairly well, except in the Pacific Northwest which has a higher percentage of low-elevation sites with minimal snowpack.
What does the weather outlook for the next 2 weeks look like? First of all, there's a major snowstorm predicted for the California Cascades and Klamath Mountains from Sunday through Tuesday, with heavy snowfall also extending south through the Sierra Nevada and north through the Oregon Cascades into the southern Washington Cascades.
A powerful, cold, closed upper-level low has already developed a few days ago in the Gulf of Alaska and moved off the BC coast near Haida Gwaii today, and it will continue moving southward off the northern California coast over the next couple days. Cold closed / cutoff lows are THE classic pattern for delivering heavy snowfall with low snow levels to northern California, as they provide a mechanism for transporting a pool of cold upper level air southward in latitude to that region, and the associated instability ensures the generation of large amounts of precip spawned from the Pacific.
Here is a view of the fully-formed and deepened closed low from Thursday morning's UW WRF-GFS model run:
And here is what the current Saturday evening model run predicts that the low will look like by Monday evening, when the heaviest snowfall is expected to begin in northern California:
The high-resolution UW model is predicting new snowfall amounts of up to 2-4 ft over the 72 hour period through Wednesday morning for the Mount Shasta and Lassen Peak areas, with snow levels as low as 2-3000 ft, well below the level of Shasta City at 3500 ft. These would be the lowest snow levels of any storm thus far in 2015 in that area, and even in town there, snowfall amounts could exceed 1 ft. The current Weather Story from the NWS Medford Forecast Office predicts 12-16" of new snow at Black Butte Summit (3900 ft) on I-5 and 20-24" at Snowman Summit (4500 ft) on SR 89, each located on the west and south flanks of Mount Shasta respectively:
Snowfall amounts of 1-3 ft are predicted to extend south through the Sierra Nevada and north through the Oregon Cascades, with about 1-2 ft extending farther north into the southern Washington Cascades and very little snow for northern Washington:
Higher resolution version of that, showing the Pacific Northwest and also zoomed in on Washington and Oregon:
And also a quickly-Photoshopped zoom in on northernmost California, showing maximum amounts of 4+ ft (marked by white inside yellow) on Mount Shasta and near Castle Crags, with amounts of up to 3 ft on Lassen Peak and throughout much of the Klamath Mountains:
The majority of that snowfall is expected during a 24-hour period through Tuesday morning, with snowfall rates predicted to exceed 2-3" per hour at the peak of the storm Monday evening. It will be very interesting to see if these model predictions verify, as that is still 2 days away. Recent model runs over the past couple days have been very consistent in their predictions of this storm system.
After that intense storm system, a brief ridge is expected to build for the rest of the week through Friday, followed by another system arriving on Friday into the weekend. This one may be aimed much farther north this time into southwestern BC, Washington, and Oregon, with additional snowfall of up to 1-2 ft for the Washington and Oregon Cascades:
The extended GFS model out to 384 hours (16 days) shows continued precip and an active stormy weather pattern over the West Coast during the 8-16 day period through April 20. This is the predicted 24-hour precip throughout that period, click "Loop All" to see all the graphics (3 hour intervals up to 240 hours, 12 hour intervals beyond that):
GFS, North Pacific, 04/05/2015 00UTC, precip_p24
This graphic shows the total accumulated precip predicted by the GFS model over the entire 16 day period through Monday evening, April 20, with amounts of over 5" shown for parts of the Cascades and northern California:
But the 8-16 day period is a long way off, and models are often quite unreliable more than 1 week out, so take those predictions with a large grain of salt.
Please Log in or Create an account to join the conversation.
- AndyMartin
- [AndyMartin]
-
- Offline
- Junior Member
-

Less
More
- Posts: 51
- Thank you received: 0
05 Apr 2015 11:00 #224357
by AndyMartin
Replied by AndyMartin on topic Re: 2014-15 Snow Season Summary, April 2015
Superb summary - thanks for all the work you do on this subject!
Please Log in or Create an account to join the conversation.
- Amar Andalkar
- [andalkar]
-
Topic Author
- Offline
- Premium Member
-
Less
More
- Posts: 635
- Thank you received: 0
05 Apr 2015 19:01 #224358
by Amar Andalkar
Replied by Amar Andalkar on topic Re: 2014-15 Snow Season Summary, April 2015
Thanks for your kind words, Andy, I appreciate it.
Updated Forecast Outlook, 05Apr2015:
Sunday morning's UW model run has stayed quite consistent in predicting big snowfall for the current storm system, and if anything, snowfall amounts have increased slightly over most of the region affected by the storm from the Olympics and Washington Cascades to the southern end of the Sierra Nevada.
It's still predicting new snowfall amounts of up to 2-4 ft over the 72 hour period through Wednesday morning for the Mount Shasta and Lassen Peak areas. Snowfall amounts of 1-3 ft are predicted to extend south through the Sierra Nevada and north through the Oregon Cascades, with about 1-2 ft extending farther north into the southern Washington Cascades, up to 1 ft in the Olympics, and several inches for northern Washington. Compare these graphics with those above from the previous run:
Higher resolution version of that, showing the Pacific Northwest and also zoomed in on Washington and Oregon. Compared to the previous run, significantly more snow is predicted for the southern Oregon Cascades, southern Washington Cascades, Mount Baker region, and Olympics, with somewhat less in the northern Oregon Cascades and east slopes of the Washington Cascades:
And the same quickly-Photoshopped zoom in on northernmost California as above, still showing maximum amounts of 4+ ft (marked by white inside yellow) on Mount Shasta and near Castle Crags, with amounts of up to 3 ft on Lassen Peak and throughout much of the Klamath Mountains:
So everything still looks great for the first storm system! Light snowfall has already begun as of Sunday morning in northern California and southern Oregon, spreading northward through the Oregon Cascades during the day, with snow falling down to 3200 ft on I-5 (Mott Road Exit 734) on the south flank of Mount Shasta, 3500 ft in Shingletown northwest of Lassen Park, Santiam Junction at 3800 ft, and Government Camp at 3900 ft on Mount Hood:
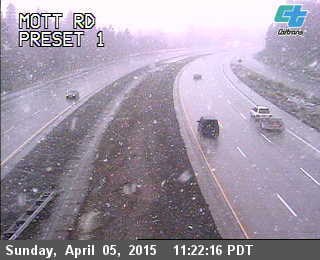
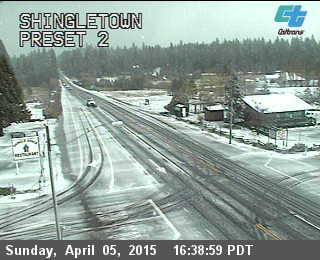
[size=small]I-5 Mott Road Exit 734, Mt Shasta, 3200 ft | Shingletown, NW of Lassen Park, 3500 ft[/size]
[img]http://www.skimountaineer.com/TR/Images2015/US20 at Santiam Jct_pid1675-05Apr2015.jpg[/img][img]http://www.skimountaineer.com/TR/Images2015/US26 at Govt Camp Lp Rd_pid1776-05Apr2015.jpg[/img]
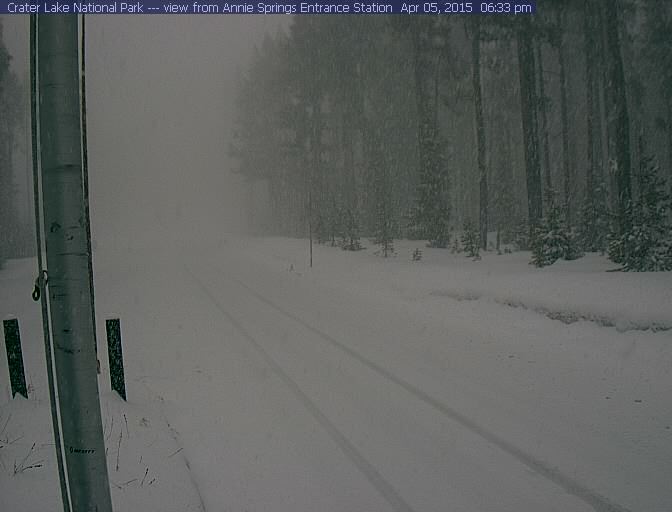
The heaviest new snowfall amounts thus far have occurred at Crater Lake, with telemetry showing about 4-5" new already from noon to 6pm on Sunday at Park Headquarters (6400 ft) and the Crater Rim (7050 ft), with snow accumulating down to below 4500 ft. Here's the new snowfall at 6000 ft:
Next weekend's system after the brief ridge of high pressure is still uncertain in strength and track, as the morning run now shows it weaker and perhaps splitting, with less snowfall overall:
But that's still 5-7 days out, and model predictions for it are likely to continue changing, as the actual development and track of the current storm system will have a large effect on the subsequent weather.
Updated Forecast Outlook, 05Apr2015:
Sunday morning's UW model run has stayed quite consistent in predicting big snowfall for the current storm system, and if anything, snowfall amounts have increased slightly over most of the region affected by the storm from the Olympics and Washington Cascades to the southern end of the Sierra Nevada.
It's still predicting new snowfall amounts of up to 2-4 ft over the 72 hour period through Wednesday morning for the Mount Shasta and Lassen Peak areas. Snowfall amounts of 1-3 ft are predicted to extend south through the Sierra Nevada and north through the Oregon Cascades, with about 1-2 ft extending farther north into the southern Washington Cascades, up to 1 ft in the Olympics, and several inches for northern Washington. Compare these graphics with those above from the previous run:
Higher resolution version of that, showing the Pacific Northwest and also zoomed in on Washington and Oregon. Compared to the previous run, significantly more snow is predicted for the southern Oregon Cascades, southern Washington Cascades, Mount Baker region, and Olympics, with somewhat less in the northern Oregon Cascades and east slopes of the Washington Cascades:
And the same quickly-Photoshopped zoom in on northernmost California as above, still showing maximum amounts of 4+ ft (marked by white inside yellow) on Mount Shasta and near Castle Crags, with amounts of up to 3 ft on Lassen Peak and throughout much of the Klamath Mountains:
So everything still looks great for the first storm system! Light snowfall has already begun as of Sunday morning in northern California and southern Oregon, spreading northward through the Oregon Cascades during the day, with snow falling down to 3200 ft on I-5 (Mott Road Exit 734) on the south flank of Mount Shasta, 3500 ft in Shingletown northwest of Lassen Park, Santiam Junction at 3800 ft, and Government Camp at 3900 ft on Mount Hood:
[size=small]I-5 Mott Road Exit 734, Mt Shasta, 3200 ft | Shingletown, NW of Lassen Park, 3500 ft[/size]
[img]http://www.skimountaineer.com/TR/Images2015/US20 at Santiam Jct_pid1675-05Apr2015.jpg[/img][img]http://www.skimountaineer.com/TR/Images2015/US26 at Govt Camp Lp Rd_pid1776-05Apr2015.jpg[/img]
The heaviest new snowfall amounts thus far have occurred at Crater Lake, with telemetry showing about 4-5" new already from noon to 6pm on Sunday at Park Headquarters (6400 ft) and the Crater Rim (7050 ft), with snow accumulating down to below 4500 ft. Here's the new snowfall at 6000 ft:
Next weekend's system after the brief ridge of high pressure is still uncertain in strength and track, as the morning run now shows it weaker and perhaps splitting, with less snowfall overall:
But that's still 5-7 days out, and model predictions for it are likely to continue changing, as the actual development and track of the current storm system will have a large effect on the subsequent weather.
Please Log in or Create an account to join the conversation.
- David_Coleman
- [David_Coleman]
-
- Offline
- Junior Member
-
Less
More
- Posts: 93
- Thank you received: 0
05 Apr 2015 20:04 #224359
by David_Coleman
Replied by David_Coleman on topic Re: 2014-15 Snow Season Summary, April 2015
A fine read Amar. So it sounds like a trip south is in order for you? haha
Please Log in or Create an account to join the conversation.
- Amar Andalkar
- [andalkar]
-
Topic Author
- Offline
- Premium Member
-
Less
More
- Posts: 635
- Thank you received: 0
06 Apr 2015 19:08 - 07 Apr 2015 14:49 #224362
by Amar Andalkar
Replied by Amar Andalkar on topic Re: 2014-15 Snow Season Summary, April 2015
Thanks, Dave. I'll certainly be headed back to Shasta and Lassen again this spring, probably more than once, but I'm not sure how soon though. You should join me!
Expanded Table of Climatological Snowdepth Information for the West Coast, April 1, 2015:
One of the items that I intended to include in the original post above was an expanded version of the NWAC climatological snowdepth table, including a few more interesting sites in Washington, but mainly covering a much larger area extending north into southwestern BC and south through the rest of the Oregon and California Cascades. However, generating such a table involves a lot of effort, mainly to calculate normal values for sites which do not have snowdepth normals listed online, i.e. all of those run by BCRFC and CCSS. And everything needs to go into a spreadsheet, while ensuring that it's as error-free as possible. This takes several hours (many hours) even for only a few dozen sites, so I didn't get around to doing so until now. But the tables below give a much clearer picture of where, and above what elevation, a significant snowpack actually exists as of April 1 this year. It's interesting to see this bigger picture all in one place.
The graphics in the original post above show snowpack only in terms of snow-water-equivalent, which is perfectly fine when trying to get a regional overview of snow conditions, really even better than snowdepth for that purpose. But when looking at individual sites, the actual snowdepth is of most interest, as that is the number which is observed with the eye or the probe while out skiing, unlike SWE which is an abstract concept that is harder to understand. So a table of numbers such as this must include snowdepths (and not just SWE values) in order to have any meaning at all to most readers.
Most of the sites which actually have April 1 snowdepth data extending back more than 10-15 years (necessary to determine "normal" values) are manual monthly snow course sites, so that is what is mostly shown in the tables below. During the early decades of the SNOTEL program beginning in 1978, almost all SNOTEL sites were originally installed without snowdepth sensors, only snow-water-equivalent sensors (pressure-sensing pillows to weigh the snowpack from below). Therefore no snowdepth data was available for those sites until they were eventually retrofitted with snowdepth sensors starting in the mid-1990s to early 2000s, with all SNOTEL sites eventually snowdepth-equipped only by about 2010. So only a few important SNOTEL sites are included here.
Over 90 measurement sites are listed in the tables below, roughly in north-south and west-east order. The locations of the BCRFC sites can be viewed on the maps at bcrfc.env.gov.bc.ca/maps/. New record lows are marked with a *, tied record lows with a T:
=== British Columbia === Elev Apr1 Apr1 % of Thru 2014 Thru 2014 Start
Measurement Site (ft) Depth Norm Norm Max/Year Min/Year Year Notes
--- Coast Mountains ----
Tenquille Lake (BCRFC) 5480 86" 115" 75% 171"/1999 71"/1979 1953 norm/max/min from older snow course
Whistler Mountain 5450 71" 105" 68% 190"/1974 57"/1979 1973 snowfall: 236", 64% of normal
Callaghan Creek (BCRFC) 3310 * 2" 77" 2% 147"/1999 20"/1981 1976 snow course Mar30
Orchid Lake (BCRFC) 3870 * 10" 168" 6% 309"/1999 79"/2005 1972 snow course Mar27
Grouse Mountain (BCRFC) 3700 * 0" 115" 0% 284"/1946 4"/1981 1936 snow course Apr1
Dog Mountain (BCRFC) 3550 * 0" 117" 0% 228"/1999 4"/1981 1936 snow course Apr1
Palisade Lake (BCRFC) 2950 * 0" 138" 0% 301"/1946 31"/1992 1946 snow course Apr1
Nahatlatch River (BCRFC) 5020 * 42" 129" 33% 226"/1999 62"/2005 1968 snow course Mar27
Stave Lake (BCRFC) 3970 * 8" 144" 6% 258"/1999 53"/2005 1968 snow course Mar27
Dickson Lake (BCRFC) 3760 * 7" 137" 5% 261"/1999 54"/2005 1992 snow course Mar27
BC Cascades
Chilliwack River (BCRFC) 5320 53" 154" 34% insufficient data 1996 NE of Mt Baker, only 13 years data
Blackwall Peak (BCRFC) 6350 67" 84" 80% 122"/2012 61"/2005 2003 Manning Provincial Park
There are some more shocking numbers in the BC table, as in the NWAC tables shown earlier. The Orchid Lake monthly snow course site at 3870 ft in the Coast Mountains, 20 km SSE of Squamish and 28 km NNE of Vancouver, has the highest average snowdepth of any measurement site in Canada as far as I know. Its normal April 1 snowdepth of 168" is comparable to Mount Hood Timberline Lodge and just shy of the 175"+ normals for the Mount Baker Ski Area, Mount Rainier Paradise, and Lassen Peak Lake Helen sites. The 10" snowdepth measured there in the "April" snow survey on March 27 is only 6% of normal, and is 1/8 of the previous record low of 79" in 2005, with data extending back to 1972. So the Orchid Lake number is perhaps even more anomalous than that shown earlier in the NWAC table for Mount Baker!
All other snow course sites at the southern end of the Coast Mountains near Vancouver which are below 4000 ft (Grouse, Dog, Palisade, Stave, Dickson) have a similar exceptionally low snowpack, with current record-low snowdepths under 10" or even zero compared with very-large normal April 1 snowdepths of 110-150". In sharp contrast, most sites in the region above 5000 ft have snowdepths of 40-90" even though their normal depths are similar to those 5 lower sites, and are not at record lows. So 5000 ft clearly seems to have been the threshold elevation in southwestern BC this season for building and maintaining any significant lasting snowpack, which is roughly 3000 ft higher than in a typical good season.
Let's move on south into the States. For those wondering where some of these obscurely named sites are actually located, the new NRCS Interactive Map provides the best way to view the locations of all active NRCS snow course sites in Washington, Oregon, and California , with plenty of options to view SNOTEL sites and other types of sites too.
===== Washington ===== Elev Apr1 Apr1 % of Thru 2014 Thru 2014 Start
Measurement Site (ft) Depth Norm Norm Max/Year Min/Year Year Notes
-- Olympic Mountains ---
Hurricane Ridge 5250 * 12" 109" 11% 252"/1999 42"/2005 1979 NWAC CLISNO
Hurricane (NRCS) 5230 2" 46" 4% 149"/1956 1"/1992 1950 snow course Mar26
Cox Valley (NRCS) 4500 * 3" 91" 3" 252"/1999 34"/2005 1968 snow course Mar27
Deer Park (NRCS) 5350 * 3" 43" 7" 115"/1956 13"/2005 1949 snow course Mar26
---- Cascade Range
Mt Baker Ski Area 4200 * 17" 175" 10% 311"/1999 72"/1934 1926 NWAC CLISNO
Marten Lake (NRCS) 3600 * 12" 163" 7% 264"/1999 60"/1996 1959 snow course Apr5
Schreibers Meadow (NRCS) 3400 * 0" 102" 0% 209"/1974 36"/1996 1959 snow course Apr5
Dock Butte AM (NRCS) 3800 * 12" 127" 9% 241"/1974 44"/1996 1959 snow course Apr5
Watson Lakes (NRCS) 4500 * 12" 122" 10% 246"/1971 60"/1996 1959 snow course Apr5
Mount Blum AM (NRCS) 5800 66" 148" 45% 206"/2011 missing 1970 snow course Apr5
Easy Pass AM (NRCS) 5390 102" 160" 64% 272"/1976 missing 1959 snow course Apr5
Jasper Pass AM (NRCS) 5400 72" 172" 42% 295"/1967 missing 1959 snow course Apr5
Beaver Pass (NRCS) 3620 * 5" 69" 7% 148"/1999 17"/2005 1944 snow course Mar29
Brown Top SNOTEL 5830 98" 139" 70% 246"/1999 82"/2005 1971 norm/max/min from nearby snow course
Devils Park (NRCS) 5900 74" 101" 73% 163"/1972 64"/2005 1950 snow course Mar27
Harts Pass (NRCS) 6200 83" 102" 81% 166"/1956 53"/1941 1941 snow course Mar27
Granite Creek (NRCS) 3500 23" 42" 55% 85"/1976 9"/2005 1971 snow course Mar27
Rainy Pass (NRCS) 4780 68" 90" 76% 161"/1976 51"/2005 1930 snow course Mar27
Washington Pass 5450 47" 100" 47% normal values estimated roughly, max/min unknown
Lyman Lake SNOTEL 5980 98" 138" 71% 223"/1972 78"/1941 1928 norm/max/min from nearby snow course
Holden Village 3220 27" 44" 61% 81"/1999 12"/1977 1962 snowfall: 120", 48% of normal
Stevens Pass 3950 * 22" 102" 22% 192"/1956 24"/1941 1939 NWAC CLISNO
Snoqualmie Pass 3000 15" 86" 17% 170"/1956 2"/1992 1929 NWAC CLISNO
Mission Ridge 5160 * 0" 47" 0% 86"/1983 20"/1973 1970 NWAC CLISNO
Crystal Mtn Base 4570 * 6" 73" 8% 144"/1999 16"/1981 1967 NWAC CLISNO
Crystal Mtn Green Valley 6230 58" 121" 48% 165"/2012 68"/2005 2005 short time period, so not record low
Chinook Pass (NWAC) 5500 76" 175" 44% normal values estimated, similar to Paradise, max/min unknown
Mt Rainier, Sunrise 6400 59" 120" 50% normal values estimated roughly, max/min unknown
Mt Rainier, Paradise 5430 73" 176" 41% 327"/1956 66"/1941 1926 NWAC CLISNO
Mt Rainier, Longmire 2760 4" 23" 17% 85"/1917 0"/many 1909 fairly often 0" by April 1
White Pass 4500 2" 57" 4% 110"/1997 0"/1992 1976 NWAC CLISNO
White Pass Pigtail SNOTEL 5800 55" 134" 41% 195"/2012 70"/2005 1998 short time period, so not record low
MtAdams PotatoHill SNOTEL 4510 23" 91" 25% 130"/2012 <8"/2005 2007 SWE starts in 1984, was lowest in 2005
MtStH Swift Creek SNOTEL 4440 * 9" 140" 6% 190"/2012 75"/2005 2003 record low despite short time period
MtStH June Lake SNOTEL 3440 T 0" 95" 0% 134"/2012 0"/1992 2004 SWE starts in 1985, was 0" in 1992
With yesterday's monthly measurement of 102", it looks like the Easy Pass aerial-marker snow course site is the only site in the Cascades with over 100" of snowdepth currently, slightly ahead of both Lyman Lake and Brown Top SNOTEL sites, which have settled into the low-mid 90" range as of April 6. Unfortunately, the snowdepth sensor on the nearby Easy Pass SNOTEL site has been malfunctioning for a while, and is giving highly erroneous values when it reads at all, quite a shame since Easy Pass probably has the greatest average snow depth of any site in the entire SNOTEL network. (The Moss Peak and Noisy Basin SNOTEL sites in Montana are also back over 100" with renewed snowfall the last 2 days.)
The snowpack situation in Washington is quite complex, with no easily determined threshold elevation above which the snowpack is reasonable. Certainly in the Olympics, that threshold appears to be over 6000 ft, far above the highest measurement sites. In the North Cascades, there is a strong west-east gradient in the threshold elevation, being around 5000 ft on the west side near Mount Baker (similar to southwestern BC) and decreasing to below 3500 ft along the SR 20 corridor and on the east side, as even Granite Creek (3500 ft on SR 20) and Holden Village (3200 ft) are over half of normal, far better than most other sites. In the south Washington Cascades, it appears that the threshold may be around 5500 ft, as verified in the field on numerous ski trips, and by the near-zero snowpack at the Swift Creek and June Lake SNOTEL sites on Mount Saint Helens. Although many Washington sites are at new record lows, a fair number of sites are not currently record-low, even several at lower elevations.
In the Oregon Cascades, almost every measurement site at all elevations appears to be at new record lows as of April 1, with the tiny exception of higher elevations above 6500 ft at Crater Lake, which has the highest official snow measurement sites in the Oregon Cascades. The deepest snowdepth in Oregon is at the 7300 ft mid-mountain snow stake on Mount Bachelor, although that is not considered an official measurement site. The threshold for a reasonable snowpack is about 5500 ft near Mount Hood, increasing to over 6000 ft by central Oregon and 6500 ft by Crater Lake. In the Siskiyous near Mount Ashland, that line appears to be over 7000 ft.
======= Oregon ======= Elev Apr1 Apr1 % of Thru 2014 Thru 2014 Start
Measurement Site (ft) Depth Norm Norm Max/Year Min/Year Year Notes
---- Cascade Range
Mill Creek Meadow (NRCS) 4400 T 0" 27" 0% 57"/2008 0"/1992 1985 snow course Mar31
High Prairie (NRCS) 6080 * 24" 104" 23% 192"/1999 56"/2005 1984 snow course Mar27
Mt Hood Timberline Lodge 5880 * 57" 165" 35% 300"/1999 57"/1981 1973 NWAC CLISNO
Mt Hood SNOTEL 5370 * 39" 136" 29% 221"/1999 45"/1981 1973 norm/max/min from nearby snow course
Mt Hood Meadows Ski Area 5380 * 33" 129" 26% 199"/2008 49"/2005 1974 NWAC CLISNO
Bald Peter (NRCS) 5600 * 0" 75" 0% 140"/1975 31"/1981 1973 snow course Mar31
Dutchman Flat (NRCS) 6320 * 46" 110" 42% 216"/1999 56"/1992 1990 snow course Mar31
Mt Bachelor West Village 6300 * 43" normals and max/min unknown snowfall: 192", 55% of normal
Mt Bachelor Mid-Mountain 7300 93" normals and max/min unknown snowfall: 236", % of normal unknown
Tangent (NRCS) 5470 T 0" 44" 0% 105"/1999 0"/1992 1952 snow course Mar31
Crater Lake Rim 7050 60" 134" 45% 190"/2006 104"/2014 2006 short time period, so not record low
Crater Lake ParkHQ (NRCS) 6570 56" 136" 41% 242"/1974 55"/2001 1943 snow course Mar31
Crater Lake Park HQ 6470 * 31" 121" 26% 236"/1983 38"/2001 1919 snowfall: 169", 38% of normal
Beaver Dam Creek (NRCS) 5120 T 0" 20" 0% 67"/1975 0"/many 1960 snow course Mar31
-- Siskiyou Mountains --
Mt Ashland Caliban (NRCS) 6500 * 9" 78" 12% 160"/1983 32"/2001 1974 snow course Mar30
Mt Ashland Switch. (NRCS) 6430 * 4" 85" 5% 169"/1983 20"/2014 1966 snow course Mar30
Ski Bowl Road (NRCS) 6070 * 0" 67" 0% 147"/1983 11"/2014 1966 snow course Mar30
The final table below includes most of the snowpack measurement sites in the California Cascades, along with only a select few sites in the Klamath Mountains and Sierra Nevada which have some of the highest normal snowdepths in those ranges, and also the highest current snowdepths. The new interactive CDEC Station Locator Map is the best way to view the locations of these sites:
===== California ===== Elev Apr1 Apr1 % of Thru 2014 Thru 2014 Start
Measurement Site (ft) Depth Norm Norm Max/Year Min/Year Year Notes
---- Cascade Range
Little Shasta 6200 * 0" 50" 0% 96"/1975 8"/2014 1946 snow course Mar30
Medicine Lake 6700 * 8" 78" 10% 160"/1958 27"/1988 1940 snow course Apr2
Mt Shasta, Horse Camp 7900 121" 270"/1958 33"/1977 1930 snow course, no data yet
Mt Shasta, Old Ski Bowl 7600 73" 133" 55% 240"/2006 74"/2014 2003 short time period, so not record low
Mt Shasta, Sand Flat 6800 28" 100" 28% 218"/1958 26"/2014 1945 snow course Mar30
Mt Shasta, Brewer Creek 6250 * 0" 79" 0% 187"/1983 17"/2014 1945 snow course Mar30
Mt Shasta, Ash Creek 5000 T 0" 47" 0% 135"/2011 0"/1970 1945 snow course Mar30
Stouts Meadow 5400 * 0" 80" 0% 175"/1983 13"/2014 1945 snow course Mar26
Dead Horse Canyon 4500 T 0" 29" 0% 115"/1999 0"/many 1945 snow course Mar30
Snow Mountain 6050 * 3" 62" 5% 136"/2011 7"/1931 1930 snow course Mar25
Thousand Lakes 6500 * 0" 79" 0% 153"/1983 9"/1963 1946 snow course Mar30
Blacks Mountain 6700 T 0" 22" 0% 79"/2004 0"/3yrs 1945 snow course Mar26
Lassen, Manzanita Lake 5900 T 0" 21" 0% 57"/1952 0"/many 1950 snow course Mar27
Lassen Peak, Lake Helen 8250 92" 177" 52% 331"/1983 64"/1977 1930 snow course Mar26
Lassen, Harkness Flat 6200 * 1" 67" 1% 140"/1952 8"/1963 1930 snow course Mar26
Silver Lake Meadows 6450 * 0" 64" 0% 138"/1983 9"/2001 1940 snow course Mar31
Feather River Meadow 5400 * 0" 54" 0% 123"/1952 7"/1963 1930 snow course Mar26
Warner Creek 5100 T 0" 36" 0% 95"/2011 0"/3yrs 1930 snow course Mar26
Mount Stover 5600 * 0" 37" 0% 108"/1952 1"/1931 1930 snow course Mar26
-- Klamath Mountains ---
Mt Eddy, Deadfall Lakes 7200 * 27" 77" 35% 154"/1983 16"/2014 1946 snow course Mar27
Gray Rock Lakes 6200 * 11" 107" 10% 230"/1983 28"/2014 1941 snow course Apr2
Trinity Alps, Shimmy Lake 6400 * 11" 106" 10% 261"/1983 23"/2014 1947 snow course Mar27
---- Sierra Nevada
Meadow Lake 7200 * 16" 122" 13% 239"/1952 31"/1963 1920 snow course Mar25
Lake Lucille 8200 * 45" 144" 31% 267"/1983 59"/1988 1916 snow course Mar27
Leavitt Lake SNOTEL 9620 * 58" 120" 48% 206"/1983 60"/1988 1979 norm/max/min from older snow course
Gianelli Meadow 8400 * 16" 112" 14% 200"/1995 52"/1988 1984 snow course Mar31
Mammoth Pass 9300 * 4" 106" 4% 207"/1983 27"/1977 1931 snow course Mar31
The situation in California is as bad as Oregon, maybe worse, as almost all sites in the state are at record lows, with the exception of a few located high on Mount Shasta and Lassen Peak, and perhaps a few isolated sites at high elevations in the Sierra (none that I quickly checked though). Given that 2014 was pretty much tied for the worst snowpack year ever in California, many sites are now setting a new record low in 2 straight years, even sites which have over 70-80 years of data. The threshold elevation for having any significant snowpack is about 7000 ft in the California Cascades and Klamath Mountains, increasing to about 8000 ft in the northern and central Sierra, and over 9000 ft in the southern Sierra, although things have been so dry there that even the highest sites have minimal snowpack. The complete list of April 2015 CCSS snow course data shows the grim story of a statewide snowpack averaging 5% of normal, with the vast majority of sites sitting snowless at 0%.
But is there some relief on the way over the next couple of days? The weather forecast and models are definitely indicating so . . .
Please Log in or Create an account to join the conversation.
- David_Coleman
- [David_Coleman]
-
- Offline
- Junior Member
-
Less
More
- Posts: 93
- Thank you received: 0
06 Apr 2015 20:17 #224364
by David_Coleman
Replied by David_Coleman on topic Re: 2014-15 Snow Season Summary, April 2015
Awesome Amar; thanks for the more in-depth education. That effort would be deemed exemplary in my line of work. As for heading south, I may join you, depending on when. Trying to get things cleaned off the plate at work.
Please Log in or Create an account to join the conversation.
- Floater
- [Floater]
-
- Offline
- New Member
-

Less
More
- Posts: 23
- Thank you received: 0
07 Apr 2015 06:32 #224366
by Floater
Replied by Floater on topic Re: 2014-15 Snow Season Summary, April 2015
This is was an excellent and fair report with regards to the year I have dubbed the "Harbinger Pig". ???
Amar still tried to dress this pig by trying to put a belt on it by saying it was not the worst lift ski season, but it was. Even in the report he then says the other bad one in 2005 did have a decent spring ski season on the lifts, not this year. If you are a lifty then this was by far the worst. Luckily with this touring gear we can cheat go higher than most of the lift areas and yes the last four times out have been decent powder. Still the report of was of excellent quality. No wonder we found ourselves going big last Wednesday and he was even smart enough to stay at Rainier and go big Thursday where I was stupid and blew it off. So please listen to Amar and not to me.
I will be blunt in my 52 years nothing compares to the Harbinger Pig. This pig was also unusual and I believe is a predictor of what is to come. We will get more precipitation, but the killer will be the high FLs and it will fall as rain. One plus is we still will have moisture, but with the obvious results as far as snowpack. Saying this we still will have good years, but be prepared for ugly ones just like this. We will learn to really fear the word El Nino.
For the end of the year I see some decent skiing even this next weekend, but the huge problem is sun angle. At this point it can not change what is done. Due to the higher sun angle it cooks stuff quick and you are always trying to find that North aspect. Let us be honest way too little way too late! With our touring gear we can cheat a bit more out of this thing and also get some decent spring turns, but we all know the snowpack worth skiing is in a few tiny areas above 5k in elevation and the conditions are awful to work with.
Thanks Amar for a great report.
Please Log in or Create an account to join the conversation.
- Amar Andalkar
- [andalkar]
-
Topic Author
- Offline
- Premium Member
-
Less
More
- Posts: 635
- Thank you received: 0
07 Apr 2015 12:46 #224363
by Amar Andalkar
Thanks, Gordy. There's an old saying, "When life gives you pigs, it's time to make bacon!" And I've made some excellent bacon throughout this season, including some of my best bacon ever: deep powder on the Cowlitz a few days ago, and an epic February road trip with winter summits and ski descents of the 4 highest peaks in the California Cascades in 5 days, Mount Shasta, Shastina, Lassen Peak, and Brokeoff Mountain, in full sunshine and silky-smooth corn snow -- posted a Facebook micro-TR for that, but never got around to writing a full TR here yet, maybe someday. That trip alone was enough to make this a fine season for me.
I hope that others have been making some bacon this season too. It looks like there were lots of skiers making good bacon this weekend based on recent TRs.
We still might have a decent April lift-skiing season, based on current forecasts for heavy snowfall in the Washington and Oregon Cascades over the weekend and into early next week, with snow levels of 2000-3000 ft (see below). Assuming that local ski areas have the ability and desire to reopen for a few weeks if the snow does actually arrive as forecast, as most areas continue to insist on their websites that they are in standby and not closed for the season.
I can already hear the bacon sizzling this weekend and next week!
Updated Forecast Outlook, 07Apr2015:
For the big Oregon and California snowstorm which is currently underway, more recent model runs (since the last forecast update above 2 days ago) had shifted the timing of the maximum snowfall period about 12 hours later from Monday evening into Tuesday, and had decreased maximum total amounts somewhat into the 2-3 ft range near Mount Shasta, along with decreasing snowfall totals for the Oregon Cascades to 1-2 ft and less than 1 ft for the southern Washington Cascades.
Mount Hood has already picked up 7" new at Timberline Lodge and 5" at Meadows Ski Area in a quick burst Sunday evening as the upper low moved southward off the coast, while Mount Bachelor received 5-8" new and Crater Lake about 9-10" new at Park Headquarters and the Crater Rim the last 2 days. Additional snowfall of up to 1 ft is expected over the southern and Central Oregon Cascades on Tuesday through midday Wednesday, as seen in this plot of 48 hour snowfall through Thursday morning:
Only a few more inches are expected on Mount Hood and over very scattered parts of the Washington Cascades, mostly on Tuesday:
But fear not, much more snow is coming to Washington shortly, see below!
As of Tuesday morning April 7, heavy snowfall has been occurring on Mount Shasta since Monday evening, intensifying greatly after 2am with snowfall rates of 1-2" per hour into late morning. Storm-total snowfall has exceeded 18" already at both the 6750 ft Sand Flat and 7600 ft Old Ski Bowl telemetry sites on Mount Shasta, and heavy snowfall is moving into the Lassen Peak area and the Sierra Nevada for the rest of Tuesday through midday Wednesday, with 1-2 ft expected over much of that region:
Snow levels have plummeted early Tuesday morning to about 1500 ft with accumulating snowfall below 2000 ft along I-5 in the Sacramento River canyon, which carves its way south from Mount Shasta through a rugged eastward projection of the Klamath Mountains. That is even lower than forecast, due to strong evaporative cooling as the intense snow fell into a very dry air mass, a possibility that NWS forecast discussions had mentioned. Here are some views from Caltrans webcams along I-5 showing heavy snowfall extending below 2000 ft on Tuesday morning:
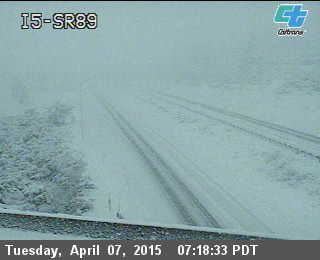
[size=small]I-5 Exit 743, Summit Drive, west flank of Mt Shasta, 3840 ft | I-5 Exit 736, SR 89, SW flank of Mt Shasta, 3530 ft[/size]
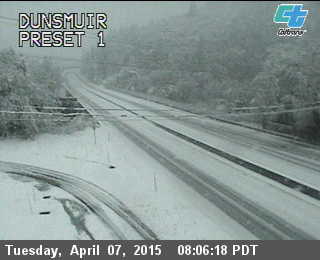
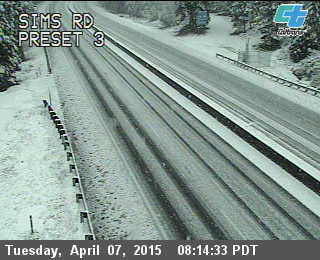
[size=small]I-5 Exit 730, Dunsmuir, SSW of Mt Shasta in Sacramento River canyon, 2420 ft | I-5 Exit 718, Sims Road, SSW of Mt Shasta in Sacramento River canyon, 1820 ft[/size]
But by Thursday, this storm system will be yesterday's news, and the BIG news is expected for this weekend. Here is the story from Tuesday morning's NWAC mountain weather forecast :
The UW model's Tuesday morning run is predicting snowfall amounts of 1-3 ft for the Washington Cascades and southwestern BC from the first system over the weekend, with several inches extending southward into the Oregon Cascades. Here is the 48-hour snowfall through Sunday evening:
The next system on Monday-Tuesday next week looks comparably strong as of now and aimed a bit farther south at Washington and Oregon, although that's still 6-7 days out and so specifics could possibly change significantly. Here is the snowfall over the subsequent 48-hour period through Tuesday evening April 14, with 1-2 ft for the Washington Cascades and southwestern BC, 1-3 ft for the Oregon Cascades, with several inches extending southward into the California Cascades:
A single 72-hour period can't span both of these systems (we need 96-hour cumulative snowfall graphics from the UW model!), but here is the maximum 72-hour snowfall period currently available through Tuesday evening, with amounts of 1-3 ft for southwestern BC, the Olympics, and the Washington and Oregon Cascades:
Model predictions of these upcoming cold and wet systems have been quite consistent over the last few days, so there is a strong likelihood of the heavy snowfall actually coming true!
Replied by Amar Andalkar on topic Re: 2014-15 Snow Season Summary, April 2015
This is was an excellent and fair report with regards to the year I have dubbed the "Harbinger Pig". ???
Thanks, Gordy. There's an old saying, "When life gives you pigs, it's time to make bacon!" And I've made some excellent bacon throughout this season, including some of my best bacon ever: deep powder on the Cowlitz a few days ago, and an epic February road trip with winter summits and ski descents of the 4 highest peaks in the California Cascades in 5 days, Mount Shasta, Shastina, Lassen Peak, and Brokeoff Mountain, in full sunshine and silky-smooth corn snow -- posted a Facebook micro-TR for that, but never got around to writing a full TR here yet, maybe someday. That trip alone was enough to make this a fine season for me.
I hope that others have been making some bacon this season too. It looks like there were lots of skiers making good bacon this weekend based on recent TRs.
Amar still tried to dress this pig by trying to put a belt on it by saying it was not the worst lift ski season, but it was. Even in the report he then says the other bad one in 2005 did have a decent spring ski season on the lifts, not this year.
We still might have a decent April lift-skiing season, based on current forecasts for heavy snowfall in the Washington and Oregon Cascades over the weekend and into early next week, with snow levels of 2000-3000 ft (see below). Assuming that local ski areas have the ability and desire to reopen for a few weeks if the snow does actually arrive as forecast, as most areas continue to insist on their websites that they are in standby and not closed for the season.
I can already hear the bacon sizzling this weekend and next week!
Updated Forecast Outlook, 07Apr2015:
For the big Oregon and California snowstorm which is currently underway, more recent model runs (since the last forecast update above 2 days ago) had shifted the timing of the maximum snowfall period about 12 hours later from Monday evening into Tuesday, and had decreased maximum total amounts somewhat into the 2-3 ft range near Mount Shasta, along with decreasing snowfall totals for the Oregon Cascades to 1-2 ft and less than 1 ft for the southern Washington Cascades.
Mount Hood has already picked up 7" new at Timberline Lodge and 5" at Meadows Ski Area in a quick burst Sunday evening as the upper low moved southward off the coast, while Mount Bachelor received 5-8" new and Crater Lake about 9-10" new at Park Headquarters and the Crater Rim the last 2 days. Additional snowfall of up to 1 ft is expected over the southern and Central Oregon Cascades on Tuesday through midday Wednesday, as seen in this plot of 48 hour snowfall through Thursday morning:
Only a few more inches are expected on Mount Hood and over very scattered parts of the Washington Cascades, mostly on Tuesday:
But fear not, much more snow is coming to Washington shortly, see below!
As of Tuesday morning April 7, heavy snowfall has been occurring on Mount Shasta since Monday evening, intensifying greatly after 2am with snowfall rates of 1-2" per hour into late morning. Storm-total snowfall has exceeded 18" already at both the 6750 ft Sand Flat and 7600 ft Old Ski Bowl telemetry sites on Mount Shasta, and heavy snowfall is moving into the Lassen Peak area and the Sierra Nevada for the rest of Tuesday through midday Wednesday, with 1-2 ft expected over much of that region:
Snow levels have plummeted early Tuesday morning to about 1500 ft with accumulating snowfall below 2000 ft along I-5 in the Sacramento River canyon, which carves its way south from Mount Shasta through a rugged eastward projection of the Klamath Mountains. That is even lower than forecast, due to strong evaporative cooling as the intense snow fell into a very dry air mass, a possibility that NWS forecast discussions had mentioned. Here are some views from Caltrans webcams along I-5 showing heavy snowfall extending below 2000 ft on Tuesday morning:
[size=small]I-5 Exit 743, Summit Drive, west flank of Mt Shasta, 3840 ft | I-5 Exit 736, SR 89, SW flank of Mt Shasta, 3530 ft[/size]
[size=small]I-5 Exit 730, Dunsmuir, SSW of Mt Shasta in Sacramento River canyon, 2420 ft | I-5 Exit 718, Sims Road, SSW of Mt Shasta in Sacramento River canyon, 1820 ft[/size]
But by Thursday, this storm system will be yesterday's news, and the BIG news is expected for this weekend. Here is the story from Tuesday morning's NWAC mountain weather forecast :
An upper ridge will begin to move across the area Thursday to maintain fair skies and further gradual warming.
An approaching upper trough offshore and an associated cold front should spread increasing clouds over the area by early Friday with precipitation spreading inland during the afternoon Friday. The moderately strong front, strong for this season, is expected to move quickly across the region Friday night, causing a period of moderate precipitation at rapidly lowering snow levels. Snow levels are expected to lower to near the 2000 foot mark by early Saturday.
Strong westerly flow behind the front should cause significant orographic snowfall along the west slope areas and volcanic peaks Saturday at low snow levels. Showers should continue Saturday night. This looks to be the strongest frontal and orographic combined system in quite some time!
Bonus coverage: Models are showing another relatively strong front with low snow levels for Monday as well.
The UW model's Tuesday morning run is predicting snowfall amounts of 1-3 ft for the Washington Cascades and southwestern BC from the first system over the weekend, with several inches extending southward into the Oregon Cascades. Here is the 48-hour snowfall through Sunday evening:
The next system on Monday-Tuesday next week looks comparably strong as of now and aimed a bit farther south at Washington and Oregon, although that's still 6-7 days out and so specifics could possibly change significantly. Here is the snowfall over the subsequent 48-hour period through Tuesday evening April 14, with 1-2 ft for the Washington Cascades and southwestern BC, 1-3 ft for the Oregon Cascades, with several inches extending southward into the California Cascades:
A single 72-hour period can't span both of these systems (we need 96-hour cumulative snowfall graphics from the UW model!), but here is the maximum 72-hour snowfall period currently available through Tuesday evening, with amounts of 1-3 ft for southwestern BC, the Olympics, and the Washington and Oregon Cascades:
Model predictions of these upcoming cold and wet systems have been quite consistent over the last few days, so there is a strong likelihood of the heavy snowfall actually coming true!
Please Log in or Create an account to join the conversation.
- Amar Andalkar
- [andalkar]
-
Topic Author
- Offline
- Premium Member
-
Less
More
- Posts: 635
- Thank you received: 0
07 Apr 2015 17:55 - 07 Apr 2015 18:45 #224369
by Amar Andalkar
Replied by Amar Andalkar on topic Re: 2014-15 Snow Season Summary, April 2015
Afternoon Forecast Outlook Addendum, 07Apr2015:
So it looks like the weather pattern is going to become cold and wet, and therefore very snowy by this weekend and into next week. I thought it might be of interest to some readers to see why this is predicted to happen, for really the first time in 2015 with this intensity, maybe in the entire 2014-15 season including the fall.
The current closed upper-level low bringing heavy snowfall to southern Oregon and northern California appears to have much to do with that pattern change, as I discovered while taking a more in-depth look through the UW model output now. Here is what yesterday's Monday evening model run showed that the low looked like as of 5pm Monday evening, which looks almost identical to the model prediction from 48 hours earlier (see the same graphic in Reply #1 above):
Here is what Tuesday morning's model run predicts that it will look like by 5pm Tuesday evening as it comes ashore on the Oregon-California border:
By Wednesday evening, the upper low has moved eastward into the Rockies and almost faded away (its remnant is that slightly-darker blue patch near the Utah-Wyoming-Colorado border). Meanwhile, far out in the Pacific a big lobe of cold upper-level air is sagging far southward, while a weak upper-level ridge aims into the BC coast across Vancouver Island:
And then the magic happens over the next few hours, as a portion of that lobe pinches off into a beautiful cutoff upper-level low, as seen on Thursday evening, with the weak upper-level ridge still aiming into the coast over the Olympics and towards the Canadian Rockies:
[size=small]Some helpful terminology: a closed upper-level low is a low pressure center with completely closed contour lines encircling it on the 500 mb chart, in contrast to an upper-level trough which is an elongated area of low pressure with no closed contour lines. A cutoff low is a closed low which is detached from the main westerly circulation, the path of the jet stream.[/size]
The cutoff low continues to move southeast on Friday, and meanwhile the weak weak upper-level ridge is vanishing, as seen on Friday evening as the first storm system arrives in the Northwest:
Unfortunately, this cutoff low is way too far off the coast to bring any precip to California, as seen on this 24-hour precip map through Friday evening, with a substantial blob of precip centered where the cutoff low is in the previous image:
But the magic of this low isn't that it brings water to the rapidly-expanding desert which is California. Its role is to completely eliminate the last chunk of the huge upper-level ridge which has dominated the West Coast's weather for the entire 2014-15 season, bringing untold misery to many Northwest skiers. Here's the GFS prediction of the jet stream at the same time on Friday evening, looking as favorable for Northwest snowfall at low snow levels as it has ever looked in the 2014-15 season:
By Saturday evening, the cutoff low is vanishing to the south, and there is sustained strong westerly and west-northwesterly flow from across the entire North Pacific:
And the jet stream at the same time on Saturday evening, looking even stronger than 24 hours earlier:
The sustained westerly flow (and Northwest snowfall) continues into Sunday evening, when just a hint of what's next can be seen as a small wave in the westerly flow well offshore near 140° W:
That wave is predicted to develop into a fairly strong upper-level trough which moves ashore on Monday, pulling in more cold air aloft and bringing heavy snowfall to Washington and Oregon. Here is the prediction for Monday evening:
Sustained heavy snowfall is predicted to continue into Tuesday, as the trough digs southeastward and upper-level flow becomes northwesterly:
Of course, the details are likely to shift a bit in the latter portion of those predictions 5-7 days out. But I thought it was really interesting how this all works and comes together to produce a major Northwest snowstorm cycle, and figured that it was worth posting about. The Earth's atmosphere and its circulation patterns are beautiful, whether looking at a satellite image or these colorful 500 mb plots.
Please Log in or Create an account to join the conversation.
- Floater
- [Floater]
-
- Offline
- New Member
-
Less
More
- Posts: 23
- Thank you received: 0
07 Apr 2015 19:12 #224370
by Floater
Replied by Floater on topic Re: 2014-15 Snow Season Summary, April 2015
Amar it is a bit far off, but like you I got my sights on some Sunday and possibly Monday/Tuesday action. What is great, now days you can watch those meters and then roll to the area where the snow will be most likely the best quality. However, I am not too excited until it materializes......we will see.
I have to admit with the touring gear this late surge in powder has helped us put the "belt" on the pig. One day of hat skiing plus some solid +7s in this year is not bad. Maybe the lifties will get some as well. We can only hope so for the sake of farmers and watersheds.
However, I want to see a string of years where in January everyone is wearing their heavy jackets and goggles due to big dumps rather than me seeing all these women skinning up in halter tops. I want that in April for sure, but not in January. I want winter and walls of snow in Greenwater, Skykomish and at Longmire. That will have me ;D.
Keep up the good work and if you keep working at you might become a ghost skier and that has always been hard to do in the PNW...LOL!
Please Log in or Create an account to join the conversation.
- Jason4
- [Jason4]
-
- Offline
- Junior Member
-
Less
More
- Posts: 178
- Thank you received: 0
08 Apr 2015 07:44 #224372
by Jason4
Replied by Jason4 on topic Re: 2014-15 Snow Season Summary, April 2015
Thank you Amar for the continual optimism and stream of interesting information! I hope I run into you in the mountains sometime to say so in person.
Please Log in or Create an account to join the conversation.
- flowing alpy
- [flowing alpy]
-
- Offline
- Platinum Member
-

Less
More
- Posts: 1272
- Thank you received: 0
10 Apr 2015 08:15 #224383
by flowing alpy
Replied by flowing alpy on topic Re: 2014-15 Snow Season Summary, April 2015
i'm ok if it fashionable for northern californians to want shasta and lassen be part of the cascade range, if they want.
Please Log in or Create an account to join the conversation.
- Amar Andalkar
- [andalkar]
-
Topic Author
- Offline
- Premium Member
-
Less
More
- Posts: 635
- Thank you received: 0
10 Apr 2015 18:02 - 11 Apr 2015 00:15 #224386
by Amar Andalkar
Replied by Amar Andalkar on topic Re: 2014-15 Snow Season Summary, April 2015
No weather updates the last 2 days, I was too busy out skiing powder, unexpectedly good new powder which was a by-product (and also after-effect) of the upper-level low which tracked into the Oregon-California border on Monday-Tuesday. Trip report:
April 8-9, 2015, Rainier, Muir Paradise POWDER x2!
Updated Forecast Outlook, 10Apr2015:
As of Friday afternoon, the very weak upper-level ridge of Wednesday-Thursday is gone, and the first of the two storm systems mentioned in the April 7 update above has reached the Northwest Coast and is pushing inland. The UW model's Friday morning run (72 hours and 6 model runs after the graphics shown above) remains quite consistent with previous runs over the last several days in its snowfall predictions for the Pacific Northwest. A fairly strong cold front will pass through overnight with heavy snowfall, followed by strong westerly flow aloft on Saturday bringing continued snowfall with snow levels in the 2-3000 ft range as predicted all along, lowering to under 2000 ft by Sunday morning as the snowfall ends.
Snowfall amounts of 1-3 ft are predicted to extend through much of southwestern BC, the Olympics, and the Washington Cascades, with lighter amounts of 1-2 ft in the northern Oregon Cascades and only several inches extending into the southern Oregon Cascades. Here is the 72-hour total snowfall through Monday morning April 13, which covers the entire first storm system:
Higher resolution version of that, showing the Pacific Northwest and also zoomed in on Washington and Oregon:
Maximum snowfall amounts of 2-3 ft are shown at higher elevations on Mounts Baker and Rainier, along with the SW slopes of the Olympics and a much larger area of the north-central Cascades including Glacier Peak and perhaps Stevens Pass, where precip will be enhanced by a strong Puget Sound Convergence Zone expected to develop on Saturday. The highest resolution view of this region even shows a maximum of 4+ ft (marked by white inside yellow) on Glacier Peak over the 48-hour period through Sunday morning:
The rest of Sunday will be a break between systems, followed by the next frontal system by midday Monday. Unlike the consistency shown with the first storm system, predictions for the second system have varied considerably in timing, track, and intensity over the last 3-5 days, but eventually seem to be settling somewhere close to what was shown above on April 7, although tracking a bit farther north and thus with less snowfall for the Cascades. Here is the total snowfall over the next 72-hour period through Thursday morning April 16, which covers the entire second storm system which will be over by Tuesday night:
By far the heaviest precip and snowfall from the second system is projected to be along the central BC Coast Mountains, where the snowfall will start earliest on Sunday and end the latest on Wednesday, with 2-4 ft totals shown. Lighter amounts of 1-2 ft are forecast to extend into southwestern BC and the North Cascades, with less than 1 ft farther south and only several inches extending into the Oregon Cascades. Another system aimed at the central BC Coast may bring more snowfall to southwestern BC and the North Cascades next Thursday, although that is too far off to have any confidence, especially with the 2 previous stronger systems yet to develop and pass through.
A ridge of high pressure may bring dry weather for the latter part of next week after that, although that is very uncertain. The extended GFS model out to 384 hours (16 days) shows continued systems and a fairly active weather pattern over the West Coast during the 10-16 day period through April 26, although not as stormy as it has been since March 31 and will be for the next few days. This is the predicted 24-hour precip throughout that period, click "Loop All" to see all the graphics (3 hour intervals up to 240 hours, 12 hour intervals beyond that):
GFS, North Pacific, 04/10/2015 18UTC, precip_p24
Please Log in or Create an account to join the conversation.
- Amar Andalkar
- [andalkar]
-
Topic Author
- Offline
- Premium Member
-
Less
More
- Posts: 635
- Thank you received: 0
13 Apr 2015 13:23 - 13 Apr 2015 15:57 #224396
by Amar Andalkar
Replied by Amar Andalkar on topic Re: 2014-15 Snow Season Summary, April 2015
The weekend snowstorm was great, continuing the fine powder conditions of the entire month of April 2015 thus far. Enjoyed excellent powder conditions especially on north-facing terrain near Chinook Pass on Sunday, where we took 2 morning laps on Naches Peak, and then unexpectedly at noon decided to head north to ski the entire traverse to Crystal. Skied 4 more north-facing runs of great powder along the traverse via upper Deadwood Lake and upper Crystal Lake, including skiing all the way out to the base of Crystal Mountain at 4400 ft on barely 4-8" of new snow atop what had been bare ground. We managed to ski and skin the entire route, skinning up on similar amounts of thin new snow atop recently-bare ground on several of the south-facing ascents of the traverse. Big day, and part of our group of 8 took an even bigger and longer variation. Not sure yet if I'll write a full TR.
Updated Forecast Outlook, 13Apr2015:
The first storm system of the new winter-like, westerly-flow pattern over the weekend brought snowfall amounts of 1-2 ft to favored areas of the Olympics and Washington Cascades, with lesser amounts well under 1 ft in the Oregon Cascades. That is well within the range of amounts expected from the forecasts, although perhaps below the middle of that range. Probably the largest new snow total at any telemetry site over the 2-day period was over 24" new (and a 5" increase in SWE!) at Easy Pass SNOTEL at 5270 ft in the North Cascades, although sadly the snowdepth sensor has been very flaky there, and is reading about 40" too low at this time as verified by manual measurement on April 5. Other large totals included over 20" new at Brown Top SNOTEL (5830 ft) and Mount Baker Ski Area (4200 ft), 19" at Mount Rainier Paradise (5400 ft), 18" at Stevens Pass (3950 ft), and over 16" new at Chinook Pass (5500 ft) and at Buckinghorse SNOTEL (4870 ft) in the Olympics.
Unfortunately there are no snow telemetry sites in the region north of Stevens Pass to Glacier Peak and west of the Crest, where the UW model indicated the maximum convergence-zone-enhanced snowfall amounts of 2-4 ft from this storm. Lyman Lake SNOTEL site (5980 ft) just east of the Crest at the north margin of the convergence region got about 1 ft. The storm was a real bust for Snoqualmie Pass which got almost no snow at pass level. During the early frontal part of the storm, precip amounts were fairly light at Snoqualmie but fell as rain there, while after snow levels dropped below 3000 ft in the post-frontal phase there was little precip directed there, and the convergence zone remained well to the north as forecast.
As of Monday morning, the 2nd storm system of this cycle has already reached the Washington Coast and is moving inland. Snowfall amounts of up to 1-2 ft are predicted to extend from southwestern BC through the length of the Washington and Oregon Cascades. Here is the 48-hour total snowfall through Wednesday morning April 15, which covers the entire 2nd storm system:
Higher resolution version of that, showing the Pacific Northwest and also zoomed in on Washington and Oregon:
The latest model runs have been leaning towards more snow in the Oregon Cascades than the Washington Cascades. Maximum snowfall amounts of 1.5-2 ft are shown at higher elevations on Mount Hood and the Three Sisters, with amounts over 1 ft predicted at a number of other locations including Mounts Rainier and Jefferson, and near Diamond Peak. The highest resolution view of western Washington even shows a maximum of 2 ft on the westerly slopes of Mount Rainier over that 48-hour period:
So the upcoming April 15 NWAC climatological snowdepth table should look quite a bit better than the April 1 version at almost all of its sites, except Snoqualmie and Mission Ridge.
High pressure builds on Wednesday, ending the nice westerly-flow pattern aimed straight across the North Pacific into the Northwest after less than a week. Great to see that pattern at least once in 2015, and sweet while it lasted. The next system is directed well to the north into southeast Alaska and the central BC coast, with dry conditions in Washington, Oregon, and California as seen in the precip map for the next 72-hour period through Saturday morning April 18:
A similar situation is expected through the weekend, with the next system heading even farther north into south-central Alaska as seen in the precip map through Monday evening:
The extended GFS model out to 384 hours (16 days) shows additional storm systems and a fairly active weather pattern over the West Coast during the 9-16 day period from Wednesday April 22 through April 29, although that's still a long way off and subject to major changes. This is the predicted 24-hour precip throughout that period, click "Loop All" to see all the graphics (3 hour intervals up to 240 hours, 12 hour intervals beyond that):
GFS, North Pacific, 04/13/2015 12UTC, precip_p24
Please Log in or Create an account to join the conversation.
- Floater
- [Floater]
-
- Offline
- New Member
-
Less
More
- Posts: 23
- Thank you received: 0
13 Apr 2015 19:44 #224400
by Floater
Replied by Floater on topic Re: 2014-15 Snow Season Summary, April 2015
Amar - We had an easier day of it one person with us was just learning the ropes. We had great pow in the morning and decent turns even in the after noon. Yes we were all smiling no halter tops!
Mike knows where to go to avoid the people. You just have to be willing to go out a bit further. Yes, those having backcountry equipment and not stuck in the resort are being able to get some decent pow here in April.
Tues/Wed are the next good days then it is warming up and a high is settling in. Do you have a bicycle? If you do give me a post on my email.
Please Log in or Create an account to join the conversation.
- DG
- [DG]
-
- Offline
- Junior Member
-
Less
More
- Posts: 150
- Thank you received: 0
14 Apr 2015 12:04 #224402
by DG
Replied by DG on topic Re: 2014-15 Snow Season Summary, April 2015
Thanks Amar for the stellar reporting, as always! Seems like the alpine snowpack is in place for a decent spring touring season in the Cascades.
Please Log in or Create an account to join the conversation.
- Floater
- [Floater]
-
- Offline
- New Member
-
Less
More
- Posts: 23
- Thank you received: 0
15 Apr 2015 21:17 #224414
by Floater
Replied by Floater on topic Re: 2014-15 Snow Season Summary, April 2015
Well Amar I think the big action of the Harbinger Pig is over. However, I have skied super pow on Cinco de Mayo. Paradise glacier was decent today, but that will all be cooked tomorrow.
It is great this touring gear. You can take the worst ski season on record and kick it up a few notches and get some pow. Yep dress that pig and that is what you and I did these last few days.
Why the word "harbinger". I think Cliff Mass says it all and there is not a lot of room on those high volcanoes for all of us. However today we were the only ones out on the Paradise GL. making lovely turns from the top of it to the bottom and out via Mazama Ridge.
cliffmass.blogspot.com/2015/02/the-winter-of-2070.html
No we are screwed, but I am 66 so I only need to milk about ten more years of decent action.
Oh and for the rest of the year go high and ski corn....
cliffmass.blogspot.com/
If you were a resort skier on average this was the worst with most Washington ski areas having snow depths at record lows or tied for record lows.
You do a good job reporting and also a great job trying to dress this pig, but remember you can't make a silk purse out of sow's ear.........
Please Log in or Create an account to join the conversation.