- Posts: 72
- Thank you received: 0
WSDOT - Only 80" of Snow at Snoq Pass this Winter
- jj
- [jj]
-
 Topic Author
- Offline
- Junior Member
-

Less
More
23 Mar 2015 22:49 #224270
by jj
WSDOT - Only 80" of Snow at Snoq Pass this Winter was created by jj
The last row of data in this table is depressing.
www.wsdot.com/winter/files/HistoricalSno...a1415season.pdf?v=11
www.wsdot.com/winter/files/HistoricalSno...a1415season.pdf?v=11
Please Log in or Create an account to join the conversation.
- Norseman
- [Norseman]
-
- Offline
- Junior Member
-
Less
More
- Posts: 55
- Thank you received: 0
24 Mar 2015 06:11 #224272
by Norseman
Replied by Norseman on topic Re: WSDOT - Only 80" of Snow at Snoq Pass this Winter
Holy hell... 828 inches in '55-'56.
Interesting to see the yearly average steadily drop.
Interesting to see the yearly average steadily drop.
Please Log in or Create an account to join the conversation.
- JPH
- [JPH]
-
- Offline
- Junior Member
-
Less
More
- Posts: 165
- Thank you received: 1
24 Mar 2015 07:53 #224273
by JPH
Replied by JPH on topic Re: WSDOT - Only 80" of Snow at Snoq Pass this Winter
Wow, ~18% of average and nearly 10 feet less than the former lowest snow year.
Please Log in or Create an account to join the conversation.
- Bronco
- [Bronco]
-
- Offline
- New Member
-

Less
More
- Posts: 18
- Thank you received: 0
24 Mar 2015 09:07 #224275
by Bronco
Replied by Bronco on topic Re: WSDOT - Only 80" of Snow at Snoq Pass this Winter
Actually 1976-77 only reported 79" though February. The total of 80" this year only includes snowfall through February so comparing this year to the the "season snowfall" for past years may not be accurate.
It'll be interesting to see what we end up with though May, it's snowing this morning.
It'll be interesting to see what we end up with though May, it's snowing this morning.
Please Log in or Create an account to join the conversation.
- JPH
- [JPH]
-
- Offline
- Junior Member
-
Less
More
- Posts: 165
- Thank you received: 1
24 Mar 2015 09:45 #224277
by JPH
Replied by JPH on topic Re: WSDOT - Only 80" of Snow at Snoq Pass this Winter
Some serious 37deg nukage going on up there! 76-77 picked up 112" in March, somehow I doubt we are hitting that this month...
I'm usually a pretty optimistic guy, but I've given up on a season saving (Snoqualmie Pass elevation) storm system to blow in. I'd take the under on 100" this season.
I'm usually a pretty optimistic guy, but I've given up on a season saving (Snoqualmie Pass elevation) storm system to blow in. I'd take the under on 100" this season.
Please Log in or Create an account to join the conversation.
- Stefan
- [Stefan]
-
- Offline
- Junior Member
-
Less
More
- Posts: 102
- Thank you received: 2
24 Mar 2015 09:58 #224278
by Stefan
Replied by Stefan on topic Re: WSDOT - Only 80" of Snow at Snoq Pass this Winter
It is interesting to see the steady decline at this particular location.
Please Log in or Create an account to join the conversation.
- TomK
- [TomK]
-
- Offline
- Junior Member
-
Less
More
- Posts: 116
- Thank you received: 0
24 Mar 2015 10:34 - 24 Mar 2015 10:38 #224280
by TomK
Replied by TomK on topic Re: WSDOT - Only 80" of Snow at Snoq Pass this Winter
Looking at rolling 3,4,& 5 year averages trend for a set of Hyak data going back to 1930, this current decade is still better than 1939-49 when every year was below average.
That said, his winter is shaping up to be a mirror of the big winter of 55/56, setting a record for the lowest snowfall.
Is this the ratchet effect, or a long term trend? We won't know for a few more winters.
That said, his winter is shaping up to be a mirror of the big winter of 55/56, setting a record for the lowest snowfall.
Is this the ratchet effect, or a long term trend? We won't know for a few more winters.
Please Log in or Create an account to join the conversation.
- flowing alpy
- [flowing alpy]
-
- Offline
- Platinum Member
-

Less
More
- Posts: 1272
- Thank you received: 0
24 Mar 2015 17:21 #224284
by flowing alpy
Replied by flowing alpy on topic Re: WSDOT - Only 80" of Snow at Snoq Pass this Winter
i got time to wait this one out. now silas, he's just doing his same old thing but with different chicks probably.
Please Log in or Create an account to join the conversation.
- Amar Andalkar
- [andalkar]
-
- Offline
- Premium Member
-

Less
More
- Posts: 635
- Thank you received: 0
24 Mar 2015 18:50 - 24 Mar 2015 23:24 #224285
by Amar Andalkar
Come on folks, it's well known by now that this is a completely artificial effect, which occurs because that set of data is cut-off at 1950. So it accidentally starts with a bunch of huge snowfall years during the fattest part of the Pacific Decadal Oscillation (PDO) cycle, and leaves out a bunch of terrible low-snowfall years right before 1950. Extending the data set back as far as it exists makes this artificial effect vanish. Here is a plot of all available snowfall data at Snoqualmie Pass back to 1910, with several running averages superimposed:
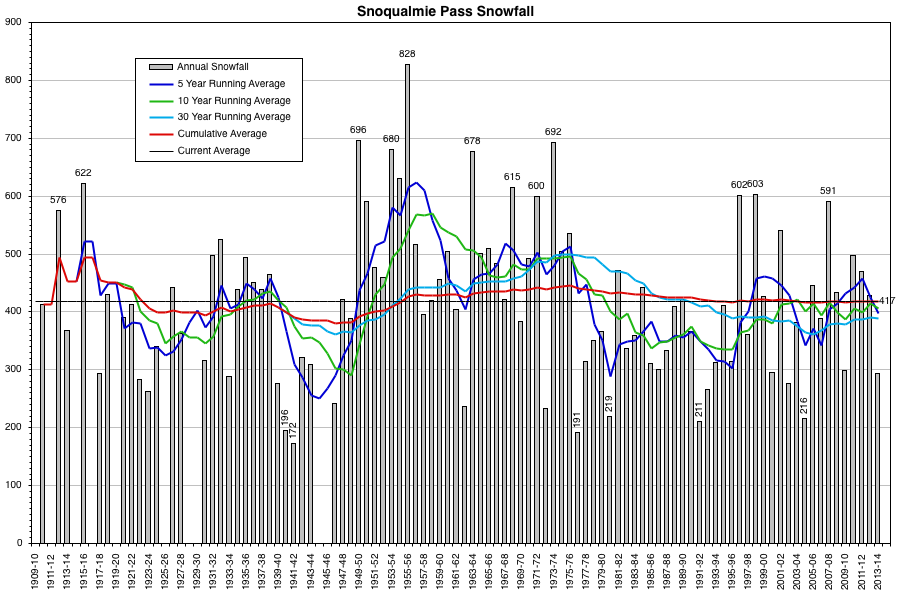
Clearly the full cumulative average (red line) shows no such steady decline! It trends downward throughout the 1920s, increases a bit in the 1930s, decreases sharply again in the 1940s, then increases over the next 25 years through the mid 1970s, then decreases again until the mid 1990s, and finally holds almost steady for the last 2 decades, with increases in big years offset by decreases in other years (the cumulative average is 417" as of 1996 and still 417" after 2014).
The other long-term running averages over 10 and 30 year periods also show no such decline. If you look at the average snowfall in each calendar decade, it is also clear that no steady decline has occurred:
1910-1920 450"
1920-1930 356"
1930-1940 419"
1940-1950 343"
1950-1960 545"
1960-1970 474"
1970-1980 428"
1980-1990 361"
1990-2000 388"
2000-2010 387"
Regarding the 10 missing years that are not shown in the plot: most of those years are missing only 1 or 2 months of data during the crucial November-April period when about 98% of the annual snowfall at this location occurs. However, it seems best not to include such years in order to avoid skewing the averages. Of the 10 years not shown on the graph, 4 of them are actually really bad snow years, even assuming normal or heavy snowfall during the 1-2 missing months (1914-15, 1925-26, 1944-45, and 1945-46), while only 2 are near-normal (1911-12 and 1916-17) and the other 4 of them are missing most of the data for the entire season (1909-10, 1919-20, 1928-29, 1929-30). Therefore including the 6 near-complete years would only further reinforce what the plot already shows, that snowfall was far less than the long-term average during the 1920s and 1940s.
The older Snoqualmie Pass data is available from the Western Regional Climate Center at www.wrcc.dri.edu/cgi-bin/cliMONtsnf.pl?wa7781. There are slight discrepancies from the WSDOT data during the period that they overlap, but in general it's a pretty good match within a few %, as good as can be expected in such snowfall data. Note that the listed annual totals in the original WRCC data have a major flaw: when any month is missing more than 5 days, they don't count it at all in annual totals, which undercounts the totals severely in many years. Although it is proper to leave out partial months when calculating monthly averages, it is erroneous to leave out partial months in sums such as annual totals for cumulative quantities like snowfall or precip, since leaving those out makes the listed annual totals more wrong than including them does. I'm not sure how WRCC could make such a significant mathematical blunder in all of their data for all sites, but it's been like that for as long as I've been looking at the WRCC data (over 10 years).
So my listed annual totals do include such partial months, although if too much is missing in any year especially in the important big-snowfall months, I leave the annual total blank as mentioned above. But I have not yet gone through the original daily snowfall records for Snoqualmie Pass from the National Climatic Data Center in order to manually clean up any other errors that might be found in the older data (I usually do this at some point for most sites that I track snowfall data for, but it's a big pain).
For those who wish to see the complete Snoqualmie Pass data set, for pure interest and also to verify that no chicanery or manipulation occurred in the graph above, here it is as a screen capture from my original spreadsheet (I'd prefer not to post the original Excel spreadsheet online):
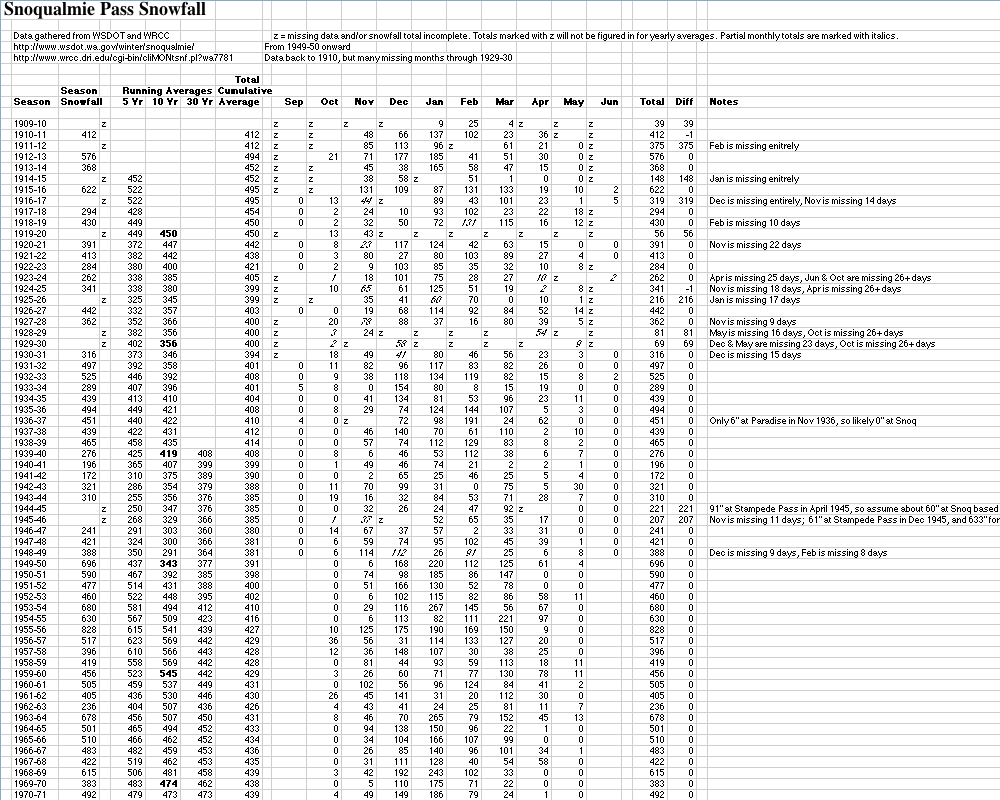
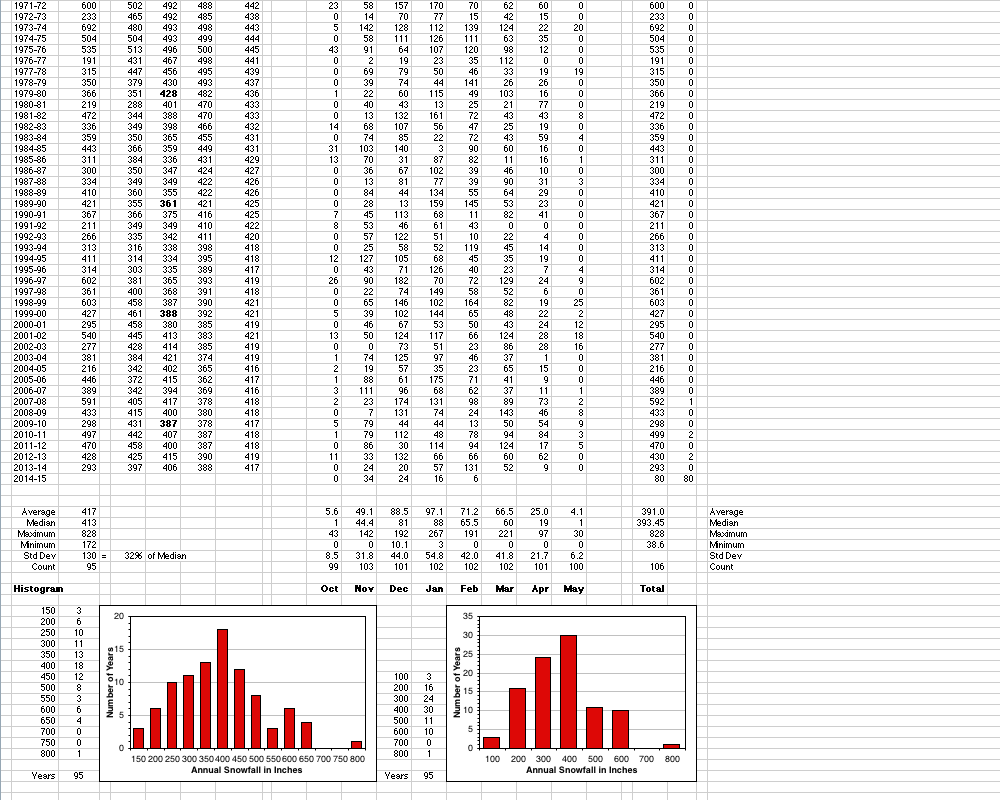
Note that all of this data (WSDOT and WRCC and TomK's data shown in a previous post) is from the summit of Snoqualmie Pass near 3000 ft (3010 or 3020 ft), none of it is from Hyak (2600 ft) despite what various files online may say. The confusion may arise because WSDOT has a maintenance / operations center at Hyak. However, snowfall at Hyak would be far less than at Snoqualmie Pass and the numbers in the data. Given the sharp decline in snowfall in that region both with decreasing elevation and increasing distance east of the Cascade Crest, although Hyak is only 2.5 miles east of the Crest, at 2600 ft it's likely to have at least 20-30% less snowfall than Snoqualmie Pass.
So what about the snowfall this year: obviously a freakish anomaly of the highest order, especially so at Snoqualmie Pass. With 1" of new snowfall recorded today (the first snowfall there in the entire month of March!?!), the total now stands at 81". How likely is significant additional snowfall? Current forecasts for the next week pretty much rule out additional snowfall this month at Snoqualmie, although heavy precip is certain for tomorrow, along with significant snowfall at higher elevations, and there may be a couple more systems on Friday and Monday which bring snow higher up. So on to April and May:
Average snowfall at Snoqualmie Pass in April and May is about 30" as shown in the data, but median snowfall is only 20" with a standard deviation of almost 30". The maximum April-May snowfall is 97" (in April 1955, followed by 0" that May), while the minimum April-May snowfall is 0" in several years. Which is to say, spring snowfall at Snoqualmie Pass is extremely fickle and variable, and quite likely to end up under 20". Since the median is 20", statistically there is only about a 50% chance of Snoqualmie breaking 100" this season. Given the lack of any indication from climate models of a cooler and wetter than normal April this year, the real chance is probably well under 50% at this point. And the likelihood of this year matching the previous record low of 172" is minuscule, statistically on the order of 1%, and realistically well under that.
Assuming it does end up under 100", how unusual, how statistically unlikely would such a total be? The previous record low in a complete season was 172" in 1941-42, trailed closely by 196" in 1940-41 and 191" in 1976-77. So a sub-100" snowfall would be a very extreme outlier at roughly half the previous low. Given the median snowfall of 413" over the full period of record with a standard deviation of 130", a total of 90" would be about 2.5 standard deviations below the median, which is in the 0.6 percentile, or roughly 1 in 160 years!!
That's all based on a normal distribution though, and annual snowfall totals are not "normally" distributed, but it's good enough for a rough approximation of how unlikely a sub-100" snowfall total would be. To verify that, let's see how many years fall under 220", which is 1.5 standard deviations below the median, or 6.7 percentile, roughly 1 in 15 years. Out of the 95 complete years, 6 of them are under 220", which matches the statistical expectation well. So this calculation method seems reasonable despite the snowfall totals not being normally distributed. And given that there are nearly 100 years of data, it's quite reasonable to encounter a 1 in 160 year event in such a data set.
Replied by Amar Andalkar on topic Re: WSDOT - Only 80" of Snow at Snoq Pass this Winter
Interesting to see the yearly average steadily drop.
It is interesting to see the steady decline at this particular location.
Come on folks, it's well known by now that this is a completely artificial effect, which occurs because that set of data is cut-off at 1950. So it accidentally starts with a bunch of huge snowfall years during the fattest part of the Pacific Decadal Oscillation (PDO) cycle, and leaves out a bunch of terrible low-snowfall years right before 1950. Extending the data set back as far as it exists makes this artificial effect vanish. Here is a plot of all available snowfall data at Snoqualmie Pass back to 1910, with several running averages superimposed:
Clearly the full cumulative average (red line) shows no such steady decline! It trends downward throughout the 1920s, increases a bit in the 1930s, decreases sharply again in the 1940s, then increases over the next 25 years through the mid 1970s, then decreases again until the mid 1990s, and finally holds almost steady for the last 2 decades, with increases in big years offset by decreases in other years (the cumulative average is 417" as of 1996 and still 417" after 2014).
The other long-term running averages over 10 and 30 year periods also show no such decline. If you look at the average snowfall in each calendar decade, it is also clear that no steady decline has occurred:
1910-1920 450"
1920-1930 356"
1930-1940 419"
1940-1950 343"
1950-1960 545"
1960-1970 474"
1970-1980 428"
1980-1990 361"
1990-2000 388"
2000-2010 387"
Regarding the 10 missing years that are not shown in the plot: most of those years are missing only 1 or 2 months of data during the crucial November-April period when about 98% of the annual snowfall at this location occurs. However, it seems best not to include such years in order to avoid skewing the averages. Of the 10 years not shown on the graph, 4 of them are actually really bad snow years, even assuming normal or heavy snowfall during the 1-2 missing months (1914-15, 1925-26, 1944-45, and 1945-46), while only 2 are near-normal (1911-12 and 1916-17) and the other 4 of them are missing most of the data for the entire season (1909-10, 1919-20, 1928-29, 1929-30). Therefore including the 6 near-complete years would only further reinforce what the plot already shows, that snowfall was far less than the long-term average during the 1920s and 1940s.
The older Snoqualmie Pass data is available from the Western Regional Climate Center at www.wrcc.dri.edu/cgi-bin/cliMONtsnf.pl?wa7781. There are slight discrepancies from the WSDOT data during the period that they overlap, but in general it's a pretty good match within a few %, as good as can be expected in such snowfall data. Note that the listed annual totals in the original WRCC data have a major flaw: when any month is missing more than 5 days, they don't count it at all in annual totals, which undercounts the totals severely in many years. Although it is proper to leave out partial months when calculating monthly averages, it is erroneous to leave out partial months in sums such as annual totals for cumulative quantities like snowfall or precip, since leaving those out makes the listed annual totals more wrong than including them does. I'm not sure how WRCC could make such a significant mathematical blunder in all of their data for all sites, but it's been like that for as long as I've been looking at the WRCC data (over 10 years).
So my listed annual totals do include such partial months, although if too much is missing in any year especially in the important big-snowfall months, I leave the annual total blank as mentioned above. But I have not yet gone through the original daily snowfall records for Snoqualmie Pass from the National Climatic Data Center in order to manually clean up any other errors that might be found in the older data (I usually do this at some point for most sites that I track snowfall data for, but it's a big pain).
For those who wish to see the complete Snoqualmie Pass data set, for pure interest and also to verify that no chicanery or manipulation occurred in the graph above, here it is as a screen capture from my original spreadsheet (I'd prefer not to post the original Excel spreadsheet online):
Note that all of this data (WSDOT and WRCC and TomK's data shown in a previous post) is from the summit of Snoqualmie Pass near 3000 ft (3010 or 3020 ft), none of it is from Hyak (2600 ft) despite what various files online may say. The confusion may arise because WSDOT has a maintenance / operations center at Hyak. However, snowfall at Hyak would be far less than at Snoqualmie Pass and the numbers in the data. Given the sharp decline in snowfall in that region both with decreasing elevation and increasing distance east of the Cascade Crest, although Hyak is only 2.5 miles east of the Crest, at 2600 ft it's likely to have at least 20-30% less snowfall than Snoqualmie Pass.
So what about the snowfall this year: obviously a freakish anomaly of the highest order, especially so at Snoqualmie Pass. With 1" of new snowfall recorded today (the first snowfall there in the entire month of March!?!), the total now stands at 81". How likely is significant additional snowfall? Current forecasts for the next week pretty much rule out additional snowfall this month at Snoqualmie, although heavy precip is certain for tomorrow, along with significant snowfall at higher elevations, and there may be a couple more systems on Friday and Monday which bring snow higher up. So on to April and May:
Average snowfall at Snoqualmie Pass in April and May is about 30" as shown in the data, but median snowfall is only 20" with a standard deviation of almost 30". The maximum April-May snowfall is 97" (in April 1955, followed by 0" that May), while the minimum April-May snowfall is 0" in several years. Which is to say, spring snowfall at Snoqualmie Pass is extremely fickle and variable, and quite likely to end up under 20". Since the median is 20", statistically there is only about a 50% chance of Snoqualmie breaking 100" this season. Given the lack of any indication from climate models of a cooler and wetter than normal April this year, the real chance is probably well under 50% at this point. And the likelihood of this year matching the previous record low of 172" is minuscule, statistically on the order of 1%, and realistically well under that.
Assuming it does end up under 100", how unusual, how statistically unlikely would such a total be? The previous record low in a complete season was 172" in 1941-42, trailed closely by 196" in 1940-41 and 191" in 1976-77. So a sub-100" snowfall would be a very extreme outlier at roughly half the previous low. Given the median snowfall of 413" over the full period of record with a standard deviation of 130", a total of 90" would be about 2.5 standard deviations below the median, which is in the 0.6 percentile, or roughly 1 in 160 years!!
That's all based on a normal distribution though, and annual snowfall totals are not "normally" distributed, but it's good enough for a rough approximation of how unlikely a sub-100" snowfall total would be. To verify that, let's see how many years fall under 220", which is 1.5 standard deviations below the median, or 6.7 percentile, roughly 1 in 15 years. Out of the 95 complete years, 6 of them are under 220", which matches the statistical expectation well. So this calculation method seems reasonable despite the snowfall totals not being normally distributed. And given that there are nearly 100 years of data, it's quite reasonable to encounter a 1 in 160 year event in such a data set.
Please Log in or Create an account to join the conversation.
- Norseman
- [Norseman]
-
- Offline
- Junior Member
-
Less
More
- Posts: 55
- Thank you received: 0
24 Mar 2015 19:28 - 24 Mar 2015 19:46 #224286
by Norseman
Replied by Norseman on topic Re: WSDOT - Only 80" of Snow at Snoq Pass this Winter
Hmm... internet trolling really does work! I thought for sure you'd merely point back to
your old thread of epic analytics
in order to set straight a dumb statement about statistical snowfall.
Is teasing allowed here? ;D
Anyway... mostly relevant to the above delving: Cliff Mass: Why has the weather been so unusual the past two winters?
Is teasing allowed here? ;D
Anyway... mostly relevant to the above delving: Cliff Mass: Why has the weather been so unusual the past two winters?
Please Log in or Create an account to join the conversation.
- Pete_H
- [Pete_H]
-
- Offline
- Junior Member
-
Less
More
- Posts: 140
- Thank you received: 0
25 Mar 2015 09:14 #224287
by Pete_H
Replied by Pete_H on topic Re: WSDOT - Only 80" of Snow at Snoq Pass this Winter
Unfortunately the blob has taken a liking to the west coast. Thing needs to be convinced Detroit or somewhere else is just as nice...
Please Log in or Create an account to join the conversation.
- Stefan
- [Stefan]
-
- Offline
- Junior Member
-
Less
More
- Posts: 102
- Thank you received: 2
25 Mar 2015 10:51 #224289
by Stefan
Replied by Stefan on topic Re: WSDOT - Only 80" of Snow at Snoq Pass this Winter
Amar,
So what has been the overall trend of snow since 1950 at Snoqualmie Pass?
I understand you want to take every year's worth of data. Understandable. You are also taking a set data limit based on the information available. What about what happened in the 1700's and 1800's. What if the periods in the 1940-1970's were anomolies compared to the long term trends in the 1700's and 1800's? We don't know that information. Not trying to start a flame war here, but I know very little about statistics.
My only question is, what has been the overall trend of snow since 1950 at Snoqualmie Pass. I think it is fairly narrow question. And yes it is a limited question. Does it answer all the questions? No. It my opinion, it would answer a short term question for snow at Snoqualmie Pass. In my opinion it would not answer a long term question for snow at Snoqualmie Pass.
Please Log in or Create an account to join the conversation.
- Pete_H
- [Pete_H]
-
- Offline
- Junior Member
-
Less
More
- Posts: 140
- Thank you received: 0
25 Mar 2015 12:12 #224292
by Pete_H
Replied by Pete_H on topic Re: WSDOT - Only 80" of Snow at Snoq Pass this Winter
I hear the skiing at Snoqualmie was just sick during the Pleistocene Epoch.
Please Log in or Create an account to join the conversation.
- Amar Andalkar
- [andalkar]
-
- Offline
- Premium Member
-
Less
More
- Posts: 635
- Thank you received: 0
25 Mar 2015 13:03 - 25 Mar 2015 13:10 #224294
by Amar Andalkar
The key issue is that your question is simply not a well-posed question for snow climatology in the Pacific Northwest: although it has an obvious answer, that answer is deceptive due to an inappropriate choice of starting point. It obscures the real trends, the real answers and insight into the behavior of the data that one is actually seeking. Because 1950 is the start of a period which is such an extreme positive relative to the overall longer-term averages, it just can't be the starting point for any fair and balanced snow climatology study in the Pacific Northwest, assuming one is actually looking for real answers, and not just trying to deceive oneself or the public and maybe push some sort of agenda (as several notoriously flawed studies have done).
Regarding statistics: Any cumulative average of any time-series data set which is cut off so that it starts with several values well-above the overall average will automatically have a downward trend, but that downward trend actually contains little or no useful information, since it primarily reflects the arbitrary choice of starting point. Cumulative averages are therefore always severely flawed because of this over-sensitivity to starting point. They really perhaps shouldn't be used at all, but it's a standard practice to calculate them.
Much better are running averages (such as the 5, 10, and 30 year averages shown on my plot above), which avoid that starting point issue, although they still have other artifacts. The cumulative average has been entirely downward for the data set cut-off to start in 1950 (showing a "steady decline"), but the running averages show that this has not been so at all, and reveal that snowfall in the past 2 decades has actually increased substantially over the previous 2 decades.
Fitted linear trend lines also have a similar false-impression issue to the cumulative average, although they do at least consider the entire data set at once unlike the cumulative average. When they start with several values well-above the overall average, they tend to artificially make things look like a "steady decline" when in fact the reality may be much more complicated, with substantial increases over various periods.
Overall, it's just far better to try to pick a "fair" starting point which better reflects the entire available data set. It is intuitively obvious by glancing at the Snoqualmie data (or the data for any other mountain site in the Pacific Northwest which extends back well past 1950) that 1910 or 1920 or 1930 are all MUCH better choices for a starting point than 1950. All the stuff about 1700s or 1800s is irrelevant, as no weather records exist in this part of the world. Although numerous studies have been done that far back and even farther, using various proxies for weather data such as dendrochronology (tree ring analysis), that's not even close to the same thing as actual real data. Since we do have good snowfall and snowpack data which extends back for about 100 years at a number of sites, we should use the entire data sets and not arbitrarily cut off at 1950 or any other year, with the caveat that if data quality is known to be worse prior to some date, then that could also set a reasonable starting point.
Did you ask Silas how it was??
Replied by Amar Andalkar on topic Re: WSDOT - Only 80" of Snow at Snoq Pass this Winter
So what has been the overall trend of snow since 1950 at Snoqualmie Pass?
I understand you want to take every year's worth of data. Understandable. You are also taking a set data limit based on the information available. What about what happened in the 1700's and 1800's. What if the periods in the 1940-1970's were anomolies compared to the long term trends in the 1700's and 1800's? We don't know that information. Not trying to start a flame war here, but I know very little about statistics.
My only question is, what has been the overall trend of snow since 1950 at Snoqualmie Pass. I think it is fairly narrow question. And yes it is a limited question. Does it answer all the questions? No. It my opinion, it would answer a short term question for snow at Snoqualmie Pass. In my opinion it would not answer a long term question for snow at Snoqualmie Pass.
The key issue is that your question is simply not a well-posed question for snow climatology in the Pacific Northwest: although it has an obvious answer, that answer is deceptive due to an inappropriate choice of starting point. It obscures the real trends, the real answers and insight into the behavior of the data that one is actually seeking. Because 1950 is the start of a period which is such an extreme positive relative to the overall longer-term averages, it just can't be the starting point for any fair and balanced snow climatology study in the Pacific Northwest, assuming one is actually looking for real answers, and not just trying to deceive oneself or the public and maybe push some sort of agenda (as several notoriously flawed studies have done).
Regarding statistics: Any cumulative average of any time-series data set which is cut off so that it starts with several values well-above the overall average will automatically have a downward trend, but that downward trend actually contains little or no useful information, since it primarily reflects the arbitrary choice of starting point. Cumulative averages are therefore always severely flawed because of this over-sensitivity to starting point. They really perhaps shouldn't be used at all, but it's a standard practice to calculate them.
Much better are running averages (such as the 5, 10, and 30 year averages shown on my plot above), which avoid that starting point issue, although they still have other artifacts. The cumulative average has been entirely downward for the data set cut-off to start in 1950 (showing a "steady decline"), but the running averages show that this has not been so at all, and reveal that snowfall in the past 2 decades has actually increased substantially over the previous 2 decades.
Fitted linear trend lines also have a similar false-impression issue to the cumulative average, although they do at least consider the entire data set at once unlike the cumulative average. When they start with several values well-above the overall average, they tend to artificially make things look like a "steady decline" when in fact the reality may be much more complicated, with substantial increases over various periods.
Overall, it's just far better to try to pick a "fair" starting point which better reflects the entire available data set. It is intuitively obvious by glancing at the Snoqualmie data (or the data for any other mountain site in the Pacific Northwest which extends back well past 1950) that 1910 or 1920 or 1930 are all MUCH better choices for a starting point than 1950. All the stuff about 1700s or 1800s is irrelevant, as no weather records exist in this part of the world. Although numerous studies have been done that far back and even farther, using various proxies for weather data such as dendrochronology (tree ring analysis), that's not even close to the same thing as actual real data. Since we do have good snowfall and snowpack data which extends back for about 100 years at a number of sites, we should use the entire data sets and not arbitrarily cut off at 1950 or any other year, with the caveat that if data quality is known to be worse prior to some date, then that could also set a reasonable starting point.
I hear the skiing at Snoqualmie was just sick during the Pleistocene Epoch.
Did you ask Silas how it was??
Please Log in or Create an account to join the conversation.
- MattT
- [MattT]
-
- Offline
- Junior Member
-
Less
More
- Posts: 62
- Thank you received: 0
25 Mar 2015 13:09 #224293
by MattT
So if annual snowfall doesn't fit a normal distribution (which I imagine has something to do with extreme high and low events not having the same probabilities, as well as low events being limited by 0, and high events technically not limited), what type of fit is more appropriate?
In the end, it probably doesn't matter much anyway. After busting out my old hydrology text books and doing some quick napkin math with other distributions, this year would be anywhere from a 1 in 150 year event, to a 1 in 170ish year event. So, we won't have another year this bad for 150+ years, right?! ;D
Replied by MattT on topic Re: WSDOT - Only 80" of Snow at Snoq Pass this Winter
That's all based on a normal distribution though, and annual snowfall totals are not "normally" distributed, but it's good enough for a rough approximation of how unlikely a sub-100" snowfall total would be.
So if annual snowfall doesn't fit a normal distribution (which I imagine has something to do with extreme high and low events not having the same probabilities, as well as low events being limited by 0, and high events technically not limited), what type of fit is more appropriate?
In the end, it probably doesn't matter much anyway. After busting out my old hydrology text books and doing some quick napkin math with other distributions, this year would be anywhere from a 1 in 150 year event, to a 1 in 170ish year event. So, we won't have another year this bad for 150+ years, right?! ;D
Please Log in or Create an account to join the conversation.
- Amar Andalkar
- [andalkar]
-
- Offline
- Premium Member
-
Less
More
- Posts: 635
- Thank you received: 0
25 Mar 2015 15:23 - 25 Mar 2015 15:35 #224298
by Amar Andalkar
Yeah, those are the main issues with the distribution deviating from normal.
It's actually not that bad to assume a normal distribution for annual snowfall at high-snowfall sites which are always reliably far above zero in every year (including Snoqualmie Pass, even this year!). It's also reasonably valid for April 1 snowdepth at most high-snowfall sites, as long as the snowdepth is always reliably far above zero in every year (not really the case at Snoqualmie Pass in any number of bad years). I don't know of any other distribution which fits better, and the calculational advantages of assuming a normal distribution are significant, while the flaws are unimportant for this type of rough calculation.
However, as annual snowfall decreases and variability increases, the normal distribution quickly becomes useless. One easy and instructive way to see this is to look at histograms of the annual snowfall versus histograms of the snowfall in a given month. Here it is for Snoqualmie Pass for annual, January, March, and April snowfall:
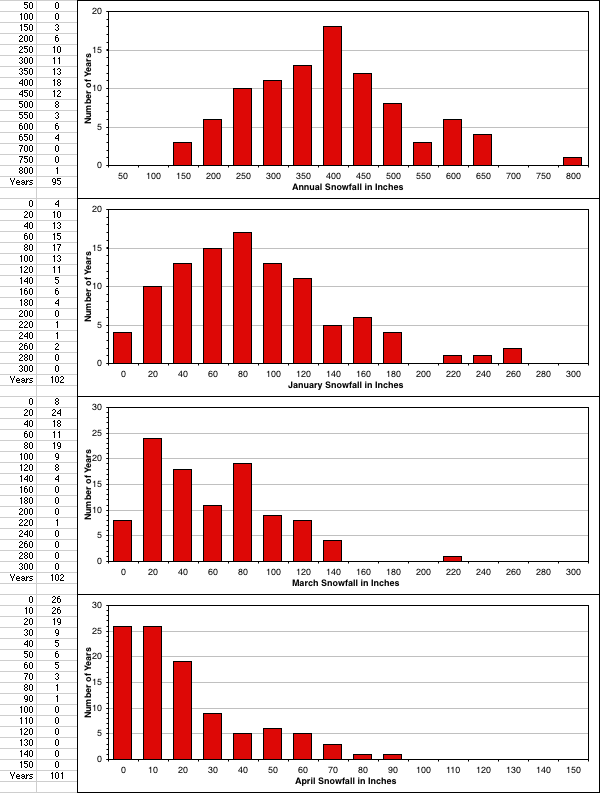
So the annual snowfall is a reasonable match to a normal distribution, as much as one could expect in this type of data. But January, the highest snowfall month there (average snowfall 97", median 88", standard deviation 55"), is showing a significant departure from normal as it runs too close to zero in a number of years and has a larger-than-expected number of high outliers, although it still has the basic normal shape.
Not so for March (average snowfall 67", median 60", standard deviation 42") or April (average snowfall 25", median 19", standard deviation 22"), which both clearly look nothing like a normal distribution. March is affected by very large scatter (manifesting itself as 2 peaks) and running close to zero in several years, while April is pretty much quashed up against zero in a large fraction of the years.
Replied by Amar Andalkar on topic Re: WSDOT - Only 80" of Snow at Snoq Pass this Winter
So if annual snowfall doesn't fit a normal distribution (which I imagine has something to do with extreme high and low events not having the same probabilities, as well as low events being limited by 0, and high events technically not limited), what type of fit is more appropriate?
Yeah, those are the main issues with the distribution deviating from normal.
It's actually not that bad to assume a normal distribution for annual snowfall at high-snowfall sites which are always reliably far above zero in every year (including Snoqualmie Pass, even this year!). It's also reasonably valid for April 1 snowdepth at most high-snowfall sites, as long as the snowdepth is always reliably far above zero in every year (not really the case at Snoqualmie Pass in any number of bad years). I don't know of any other distribution which fits better, and the calculational advantages of assuming a normal distribution are significant, while the flaws are unimportant for this type of rough calculation.
However, as annual snowfall decreases and variability increases, the normal distribution quickly becomes useless. One easy and instructive way to see this is to look at histograms of the annual snowfall versus histograms of the snowfall in a given month. Here it is for Snoqualmie Pass for annual, January, March, and April snowfall:
So the annual snowfall is a reasonable match to a normal distribution, as much as one could expect in this type of data. But January, the highest snowfall month there (average snowfall 97", median 88", standard deviation 55"), is showing a significant departure from normal as it runs too close to zero in a number of years and has a larger-than-expected number of high outliers, although it still has the basic normal shape.
Not so for March (average snowfall 67", median 60", standard deviation 42") or April (average snowfall 25", median 19", standard deviation 22"), which both clearly look nothing like a normal distribution. March is affected by very large scatter (manifesting itself as 2 peaks) and running close to zero in several years, while April is pretty much quashed up against zero in a large fraction of the years.
Please Log in or Create an account to join the conversation.
- kamtron
- [kamtron]
-
- Offline
- Senior Member
-

Less
More
- Posts: 269
- Thank you received: 8
25 Mar 2015 17:43 #224301
by kamtron
Replied by kamtron on topic Re: WSDOT - Only 80" of Snow at Snoq Pass this Winter
Gamma distribution!
Please Log in or Create an account to join the conversation.
- T. Eastman
- [T. Eastman]
-
- Offline
- Senior Member
-
Less
More
- Posts: 288
- Thank you received: 0
25 Mar 2015 21:21 #224303
by T. Eastman
Replied by T. Eastman on topic Re: WSDOT - Only 80" of Snow at Snoq Pass this Winter
Is the data making you a better skier?
Please Log in or Create an account to join the conversation.
- ski_photomatt
- [ski_photomatt]
-
- Offline
- Junior Member
-
Less
More
- Posts: 141
- Thank you received: 0
25 Mar 2015 21:32 #224304
by ski_photomatt
Replied by ski_photomatt on topic Re: WSDOT - Only 80" of Snow at Snoq Pass this Winter
One of the latest peer reviewed articles I could find on this subject, written by the most outspoken critics of the earlier "1950 - present" analysis by Mote et al (that Amar also heavily criticizes):
Mark T. Stoelinga, Mark D. Albright, and Clifford F. Mass, 2010: A New Look at Snowpack Trends in the Cascade Mountains. J. Climate, 23, 2473–2491.
journals.ametsoc.org/doi/abs/10.1175/2009JCLI2911.1
The abstract from the paper is quoted below. The full paper is also pretty decent if you want to dive deeper. The most interesting thing to me in this paper is that they removed the effect of Pacific variability and found that snowpacks have been declining about 2% / decade since 1930. To my mind, this is the central question in whether our snowpack has been declining long term, much more so then looking at any particular year.
This study examines the changes in Cascade Mountain spring snowpack since 1930. Three new time series facilitate this analysis: a water-balance estimate of Cascade snowpack from 1930 to 2007 that extends the observational record 20 years earlier than standard snowpack measurements; a radiosonde-based time series of lower-tropospheric temperature during onshore flow, to which Cascade snowpack is well correlated; and a new index of the North Pacific sea level pressure pattern that encapsulates modes of variability to which Cascade spring snowpack is particularly sensitive.
Cascade spring snowpack declined 23% during 1930–2007. This loss is nearly statistically significant at the 5% level. The snowpack increased 19% during the recent period of most rapid global warming (1976–2007), though this change is not statistically significant because of large annual variability. From 1950 to 1997, a large and statistically significant decline of 48% occurred. However, 80% of this decline is connected to changes in the circulation patterns over the North Pacific Ocean that vary naturally on annual to interdecadal time scales. The residual time series of Cascade snowpack after Pacific variability is removed displays a relatively steady loss rate of 2.0% decade−1, yielding a loss of 16% from 1930 to 2007. This loss is very nearly statistically significant and includes the possible impacts of anthropogenic global warming.
The dates of maximum snowpack and 90% melt out have shifted 5 days earlier since 1930. Both shifts are statistically insignificant. A new estimate of the sensitivity of Cascade spring snowpack to temperature of −11% per °C, when combined with climate model projections of 850-hPa temperatures offshore of the Pacific Northwest, yields a projected 9% loss of Cascade spring snowpack due to anthropogenic global warming between 1985 and 2025.
Please Log in or Create an account to join the conversation.
- hyak.net
- [hyak.net]
-
- Offline
- Premium Member
-
Less
More
- Posts: 601
- Thank you received: 0
26 Mar 2015 13:51 #224306
by hyak.net
Replied by hyak.net on topic Re: WSDOT - Only 80" of Snow at Snoq Pass this Winter
I have been keeping snow totals for the pass for many years and I found many inaccuracies with the DOT during this time. I would post the totals every snowfall and compare with the ski resort, DOT and my own findings. I find the DOT numerous times was way off, showing more then what actually fell. Especially on the days of freezing rain where no snow falls the DOT page would report sometimes 8-12" of snowfall. Early years our totals were fairly close with end of season totals sometimes within 10" or so, but starting in 2008/09 that all changed. Since then the DOT records snow depths far above what I show, 50-100" of difference. This made me think they might get snow removal funding based on the amount of snow and they might beef up the numbers?
All I know is something changed in 2008 for their snowfall recording and now lack of accuracy.
All I know is something changed in 2008 for their snowfall recording and now lack of accuracy.
Please Log in or Create an account to join the conversation.
- JPH
- [JPH]
-
- Offline
- Junior Member
-
Less
More
- Posts: 165
- Thank you received: 1
26 Mar 2015 15:22 #224307
by JPH
Replied by JPH on topic Re: WSDOT - Only 80" of Snow at Snoq Pass this Winter
Another snow measuring question - NWAC shows 23" at the base of Alpental (3100') and 14" at Hurricane Ridge (5250'). Webcams for both show completely bare ground, so where are the NWAC stations getting these measurements?
Since I'm sitting at home looking at the computer, I'm just curious. If I had driven somewhere expecting 2' of snow on the ground and it was dirt, I might be pissed.
Since I'm sitting at home looking at the computer, I'm just curious. If I had driven somewhere expecting 2' of snow on the ground and it was dirt, I might be pissed.
Please Log in or Create an account to join the conversation.
- Patarero
- [Patarero]
-
- Offline
- New Member
-
Less
More
- Posts: 38
- Thank you received: 0
27 Mar 2015 11:46 #224311
by Patarero
nerd
And therein lies the problem with analyzing and drawing conclusions from long term data sets for which meta-data or changes in data collection methods are not noted.
Replied by Patarero on topic Re: WSDOT - Only 80" of Snow at Snoq Pass this Winter
Gamma distribution!
nerd
I have been keeping snow totals for the pass for many years and I found many inaccuracies with the DOT during this time. I would post the totals every snowfall and compare with the ski resort, DOT and my own findings. I find the DOT numerous times was way off, showing more then what actually fell. Especially on the days of freezing rain where no snow falls the DOT page would report sometimes 8-12" of snowfall. Early years our totals were fairly close with end of season totals sometimes within 10" or so, but starting in 2008/09 that all changed. Since then the DOT records snow depths far above what I show, 50-100" of difference. This made me think they might get snow removal funding based on the amount of snow and they might beef up the numbers?
All I know is something changed in 2008 for their snowfall recording and now lack of accuracy.
And therein lies the problem with analyzing and drawing conclusions from long term data sets for which meta-data or changes in data collection methods are not noted.
Please Log in or Create an account to join the conversation.
- Lowell_Skoog
- [Lowell_Skoog]
-

- Offline
- Platinum Member
-
Less
More
- Posts: 1460
- Thank you received: 16
27 Mar 2015 12:57 #224312
by Lowell_Skoog
Replied by Lowell_Skoog on topic Re: WSDOT - Only 80" of Snow at Snoq Pass this Winter
Not directly related to Snoqualmie Pass, but my favorite benchmark to judge the decline of the Cascade snowpack is to look at the glaciers.
Statistics may lie, but glaciers don't.
Statistics may lie, but glaciers don't.
Please Log in or Create an account to join the conversation.
- Stimbuck
- [Stimbuck]
-
- Offline
- Junior Member
-
Less
More
- Posts: 125
- Thank you received: 0
28 Mar 2015 11:01 #224321
by Stimbuck
Many of the stations are located in sheltered sites on generally flat ground. These locations improve accuracy of snowfall/precipitation measurements, though they often hold snow a bit longer than exposed sites. The Alpental station is located behind the main lodge. If the site hasn't been recently maintained then we may be seeing interference from brush
Replied by Stimbuck on topic Re: WSDOT - Only 80" of Snow at Snoq Pass this Winter
Another snow measuring question - NWAC shows 23" at the base of Alpental (3100') and 14" at Hurricane Ridge (5250'). Webcams for both show completely bare ground, so where are the NWAC stations getting these measurements?
Many of the stations are located in sheltered sites on generally flat ground. These locations improve accuracy of snowfall/precipitation measurements, though they often hold snow a bit longer than exposed sites. The Alpental station is located behind the main lodge. If the site hasn't been recently maintained then we may be seeing interference from brush
Please Log in or Create an account to join the conversation.
- JPH
- [JPH]
-
- Offline
- Junior Member
-
Less
More
- Posts: 165
- Thank you received: 1
28 Mar 2015 21:00 #224324
by JPH
Thanks!
Replied by JPH on topic Re: WSDOT - Only 80" of Snow at Snoq Pass this Winter
Many of the stations are located in sheltered sites on generally flat ground. These locations improve accuracy of snowfall/precipitation measurements, though they often hold snow a bit longer than exposed sites. The Alpental station is located behind the main lodge. If the site hasn't been recently maintained then we may be seeing interference from brush
Thanks!
Please Log in or Create an account to join the conversation.
- Amar Andalkar
- [andalkar]
-
- Offline
- Premium Member
-
Less
More
- Posts: 635
- Thank you received: 0
13 Apr 2015 09:26 - 13 Apr 2015 10:27 #224395
by Amar Andalkar
So maybe statistics are pretty useful for this sort of thing?! The roughly 50% statistical chance of breaking 100" did in fact come true, despite all meteorological indications to the contrary. All it took was one strong convergence-zone snowstorm on the night of March 31 to April 1, with snowfall rates of 2-3" per hour for a few hours at its peak, and 15" new for the day. From www.wsdot.com/winter/snoqualmie/:
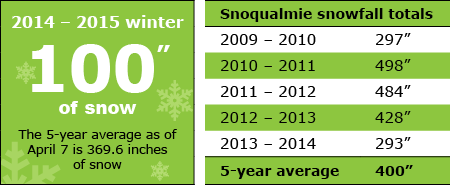
The current season total of 100" is still about 2.4 standard deviations below the median (413" over the full period of record with a standard deviation of 130"), which is in the 0.8 percentile, or roughly 1 in 120 years!
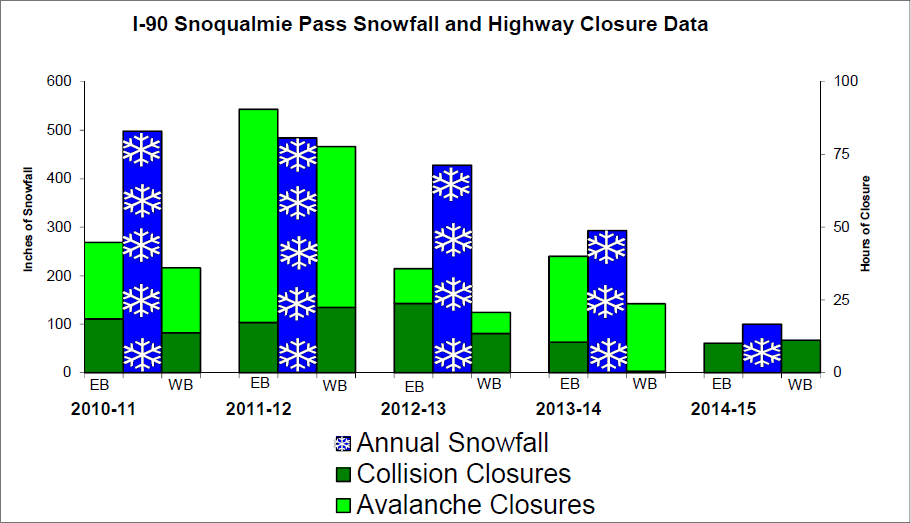
On a side note, it looks like Snoqualmie Pass will make it through this entire season with ZERO hours of avalanche-control closures:
Here's the recent daily snowfall from i90.atmos.washington.edu/roadview/avalanche/hyak.htm (note that it's not measured at Hyak, but at Snoqualmie Pass 3000 ft):
Snoqualmie Snowfall Report
Courtesy of WSDOT Hyak Operation Center
Date New Snow Snow Depth
Mon Apr 13 0 in 0 in
Sat Apr 11 0 in 0 in
Thu Apr 09 0 in 0 in
Wed Apr 08 0 in 0 in
Tue Apr 07 0 in 0 in
Mon Apr 06 0 in 0 in
Fri Apr 03 0 in 4 in
Thu Apr 02 1 in 9 in <<< Reaches 100" for season!
Wed Apr 01 15 in 15 in
Tue Mar 31 0 in 0 in
Fri Mar 27 0 in 0 in
Wed Mar 25 3 in 3 in
Tue Mar 24 1 in 1 in <<< First snowfall in March!
Mon Mar 23 0 in 0 in
Fri Mar 20 0 in 0 in
Thu Mar 19 0 in 0 in
Wed Mar 18 0 in 0 in
Tue Mar 17 0 in 0 in
Although the Puget Sound convergence zone was kind to Snoqualmie that time, this weekend it missed Snoqualmie entirely, staying farther north and dumping 16" new at Stevens Pass from midday on April 11 into April 12, with similar snowfall rates of 2-3" per hour at its peak. Snoqualmie got relatively little precip from the weekend storm, almost all of which fell as rain at pass level, with only trace amounts of snow.
And here's the NWAC telemetry at Snoqualmie and Alpental over the 2-day period of that March 31 to April 1 storm, saved for posterity:
Northwest Avalanche Center
Washington Department of Transportation
Snoqualmie Pass, Washington
3770' temp above Lake Keechelus snow shed
MM/DD Hour Temp Temp Temp RH Wind Wind Wind Hour Total 24 Hr Total Press
PST F F F % Avg Max Dir Prec. Prec. Snow Snow mb
3760' 3770' 3010' 3010' 3760' 3760' 3760' 3010' 3010' 3010' 3010' 3010'
3 31 500 35 34 36 94 21 37 262 .04 .04 0 0 1013
3 31 600 33 32 35 93 24 47 250 .01 .05 0 1 1014
3 31 700 32 31 35 96 15 28 247 .03 .08 0 0 1014
3 31 800 31 31 33 96 12 20 246 .05 .13 0 0 1015
3 31 900 30 31 33 95 18 27 250 .05 .18 0 0 1016
3 31 1000 31 32 37 92 13 24 257 0 .18 0 -0 1016
3 31 1100 31 33 35 93 10 15 250 .02 .2 0 0 1017
3 31 1200 31 34 34 96 8 13 249 .09 .29 0 1 1017
3 31 1300 32 34 37 94 6 14 256 .02 .31 0 0 1017
3 31 1400 32 31 33 96 14 45 -7999 .04 .35 0 1 1018
3 31 1500 31 30 32 97 14 23 280 .07 .42 0 1 1018
3 31 1600 32 31 32 97 12 19 272 .04 .46 0 0 1018
3 31 1700 31 31 32 97 9 18 249 .07 .53 0 0 1018
3 31 1800 30 31 32 98 5 15 246 .09 .62 0 0 1018
3 31 1900 29 30 31 98 8 19 -7999 .13 .75 2 4 1019
3 31 2000 30 30 31 98 5 13 -7999 .16 .91 2 4 1019
3 31 2100 30 30 32 98 7 16 309 .14 1.05 3 -165 1019
3 31 2200 30 30 31 98 9 20 286 .15 1.2 5 -165 1020
3 31 2300 29 30 31 98 11 18 270 .14 1.34 8 9 1020
4 1 0 30 30 31 98 8 17 -7999 .11 1.45 10 13 1020
4 1 100 30 29 31 98 15 24 253 .14 1.59 10 13 1020
4 1 200 30 29 30 98 14 31 259 .11 1.7 10 14 1021
4 1 300 29 29 31 98 9 15 257 .13 1.83 11 13 1021
4 1 400 28 29 30 98 11 16 254 .14 1.97 10 14 1021
4 1 500 29 29 30 98 7 16 252 .17 .17 0 14 1021
4 1 600 28 29 30 98 11 21 254 .08 .25 0 15 1022
4 1 700 29 29 32 97 7 12 253 .03 .28 0 14 1022
4 1 800 30 30 33 95 8 11 256 .06 .34 0 14 1022
4 1 900 30 33 36 86 10 17 250 .03 .37 0 13 1023
4 1 1000 31 34 37 87 11 19 248 0 .37 0 12 1023
4 1 1100 32 32 39 82 7 16 265 0 .37 0 13 1023
4 1 1200 32 34 38 83 3 8 -7999 0 .37 0 10 1023
4 1 1300 33 35 42 75 6 18 264 0 .37 -0 9 1022
4 1 1400 32 35 45 70 8 13 -7999 0 .37 0 8 1022
4 1 1500 33 35 39 82 12 22 249 0 .37 0 9 1022
4 1 1600 32 32 36 92 8 17 270 .01 .38 0 9 1022
4 1 1700 31 33 35 94 8 15 247 .03 .41 0 10 1022
4 1 1800 31 31 35 93 10 18 255 .02 .43 0 9 1022
4 1 1900 31 31 32 97 15 22 249 .01 .44 0 9 1023
4 1 2000 31 30 32 97 12 19 250 .03 .47 0 9 1023
4 1 2100 30 30 32 97 12 19 255 .02 .49 0 9 1023
4 1 2200 29 30 31 98 8 15 244 0 .49 0 9 1024
4 1 2300 30 29 31 98 9 15 258 0 .49 0 8 1024
4 2 0 29 29 31 98 7 13 253 0 .49 0 9 1024
4 2 100 29 29 32 98 9 13 246 0 .49 0 8 1024
4 2 200 29 29 32 98 8 15 242 0 .49 0 8 1024
4 2 300 29 30 32 98 7 11 243 0 .49 0 8 1024
4 2 400 29 29 31 98 8 12 235 0 .49 0 8 1024
Northwest Avalanche Center
Alpental Ski Area, Washington
Wind gages unheated and may rime
5470' Intermittent snow out
MM/DD Hour Temp Temp Temp RH RH Wind Wind Wind Hour Total 24 Hr Total 24 Hr Total Inter
PST F F F % % Avg Max Dir. Prec. Prec. Snow Snow Snow Snow Snow
5470' 4350' 3100' 3100' 5470' 5520' 5520' 5520' 3100' 3100' 3100' 3100' 4350' 4350' 5470'
3 31 500 28 33 37 96 100 26 45 235 .03 .03 0 13 0 25 39
3 31 600 26 32 36 97 99 20 37 235 .01 .04 0 13 0 24 37
3 31 700 26 32 35 98 100 19 32 234 .02 .06 0 14 0 21 39
3 31 800 27 31 33 99 99 14 24 234 .08 .14 0 14 1 21 39
3 31 900 27 31 34 99 98 18 31 234 .05 .19 0 14 2 22 38
3 31 1000 29 33 36 92 96 19 33 235 .01 .2 0 13 2 283 35
3 31 1100 28 33 35 96 97 15 27 236 .01 .21 0 13 2 283 29
3 31 1200 29 32 34 98 97 16 31 236 .09 .3 0 13 2 283 27
3 31 1300 27 34 36 96 98 20 36 235 .02 .32 0 13 2 23 17
3 31 1400 26 32 33 98 99 20 40 238 .05 .37 0 13 2 23 -27
3 31 1500 26 32 33 99 99 16 26 234 .06 .43 0 12 4 283 -170
3 31 1600 26 32 33 99 99 17 31 234 .04 .47 1 14 4 24 -224
3 31 1700 26 31 33 99 98 11 21 237 .09 .56 1 12 5 283 -132
3 31 1800 25 30 33 99 98 11 24 234 .12 .68 0 14 5 26 -74
3 31 1900 24 29 32 99 98 11 14 241 .13 .81 0 17 7 28 -39
3 31 2000 25 29 33 100 98 7 11 237 .15 .96 4 16 7 27 -18
3 31 2100 24 29 32 99 98 9 21 234 .12 1.08 4 18 8 32 -6
3 31 2200 24 29 33 100 99 11 16 235 .17 1.25 6 20 11 283 4
3 31 2300 24 29 32 100 99 10 20 232 .14 1.39 8 26 14 283 9
4 1 0 24 29 32 100 98 13 22 228 .12 1.51 8 29 16 39 10
4 1 100 24 29 32 100 99 15 27 235 .16 1.67 8 28 17 41 -51
4 1 200 24 28 32 100 99 16 28 234 .11 1.78 8 28 17 283 -31
4 1 300 24 28 32 100 99 15 32 233 .13 1.91 8 21 17 283 -16
4 1 400 23 28 31 100 98 14 26 234 .14 2.05 7 28 17 283 -6
4 1 500 23 28 32 99 98 11 19 234 .14 .14 8 28 18 283 1
4 1 600 24 28 31 100 98 11 28 234 .09 .23 0 28 18 283 7
4 1 700 24 28 33 98 99 12 23 233 .06 .29 0 31 18 41 11
4 1 800 26 29 33 95 99 10 20 234 .04 .33 0 33 18 283 13
4 1 900 31 32 34 95 99 10 17 233 .02 .35 0 32 18 283 12
4 1 1000 32 33 35 93 98 7 13 234 .02 .37 0 32 0 42 7
4 1 1100 34 35 39 85 98 11 20 234 .02 .39 -0 59 0 41 -20
4 1 1200 33 35 39 86 93 8 15 236 .01 .4 -0 66 0 36 -45
4 1 1300 34 36 39 88 91 10 19 237 0 .4 0 72 0 38 -32
4 1 1400 35 37 39 85 89 10 21 248 .01 .41 0 74 0 35 -26
4 1 1500 30 36 39 89 94 8 15 254 0 .41 0 74 0 38 -78
4 1 1600 28 34 35 94 97 11 20 250 .02 .43 0 75 0 36 -10
4 1 1700 29 33 34 95 95 11 18 235 .02 .45 0 75 0 283 2
4 1 1800 28 32 34 96 97 12 20 237 .03 .48 0 75 1 283 7
4 1 1900 26 31 33 98 98 13 22 232 .04 .52 0 75 0 283 -80
4 1 2000 26 31 33 98 99 14 26 247 .04 .56 0 75 2 283 -67
4 1 2100 25 30 33 99 98 16 27 291 .02 .58 0 72 2 283 -29
4 1 2200 24 29 32 99 97 16 28 345 0 .58 0 74 2 283 -13
4 1 2300 23 28 32 100 99 18 26 345 0 .58 0 74 2 41 -8
4 2 0 23 28 32 99 97 18 27 347 0 .58 0 74 2 42 -6
4 2 100 24 28 32 99 98 12 20 348 0 .58 0 74 2 41 -4
4 2 200 24 29 32 99 98 7 17 325 0 .58 0 74 2 41 -4
4 2 300 24 29 32 99 98 12 23 345 0 .58 0 74 2 38 -4
4 2 400 24 29 32 99 97 7 14 327 0 .58 0 74 2 38 -5
Glaciers may not lie, but they may instead be telling us something different than what we might initially assume.
Clearly glacial recession is proof of a significant decline in snowpack -- but snowpack on what date, and at what elevation? Glacier mass balance depends only on the snowpack remaining in the accumulation zone as of the end of summer, prior to start of the next season's snowfall. At elevations above 6500-8000 ft in the Cascades where the accumulation zones of all glaciers in the range sit, that date is sometime from about September to October in most years, and as late as November in rare years with extremely dry September-Octobers. Only the snowpack which exists in its accumulation zone matters to a glacier's health, while snowpack lower down on the glacier has almost no effect, and snowpack below or off the glacier none at all.
It is well known that glacial mass balance, and glacial recession or expansion, depend very strongly on summer temperatures and cloudiness. A very cool cloudy summer such as the one we had in 2010 following a fairly average snowpack season can result in significant positive mass balance. Much more so than other years like 2008 which by any measure was a huge snowpack year in the Northwest, especially so at low elevations, but with normal warm summer weather resulted in much less gains for the glaciers. An extended pattern of very cool and cloudy summers can result in significant glacial expansion, even with no increase in wintertime snowpack above average levels over that period, while a run of hot sunny dry summers will cause significant glacial recession even if the preceding winter snowpacks were all well above-normal.
So glacial mass balance and glacial recession really tell us nothing about the overall winter snowpack, or at most very little, and they tell us absolutely nothing about the low-elevation snowpack (roughly 1500-3500 ft in the WA Cascades) and even the mid-elevation snowpack (roughly 3500-5500 ft), which lie far below their accumulation zones. As we have seen so clearly during the 2014-15 season, the low-elevation snowpack (extremely below-normal this year) can be highly uncorrelated from the mid- and high-elevation snowpack (way closer to normal this year above 5000 ft), and that relative lack of correlation holds true in many other seasons too, albeit to a lesser degree than this freakish season.
Replied by Amar Andalkar on topic Re: WSDOT - Only 80" of Snow at Snoq Pass this Winter
...
So what about the snowfall this year: obviously a freakish anomaly of the highest order, especially so at Snoqualmie Pass. With 1" of new snowfall recorded today (the first snowfall there in the entire month of March!?!), the total now stands at 81". How likely is significant additional snowfall? Current forecasts for the next week pretty much rule out additional snowfall this month at Snoqualmie, although heavy precip is certain for tomorrow, along with significant snowfall at higher elevations, and there may be a couple more systems on Friday and Monday which bring snow higher up. So on to April and May:
Average snowfall at Snoqualmie Pass in April and May is about 30" as shown in the data, but median snowfall is only 20" with a standard deviation of almost 30". The maximum April-May snowfall is 97" (in April 1955, followed by 0" that May), while the minimum April-May snowfall is 0" in several years. Which is to say, spring snowfall at Snoqualmie Pass is extremely fickle and variable, and quite likely to end up under 20". Since the median is 20", statistically there is only about a 50% chance of Snoqualmie breaking 100" this season. Given the lack of any indication from climate models of a cooler and wetter than normal April this year, the real chance is probably well under 50% at this point. And the likelihood of this year matching the previous record low of 172" is minuscule, statistically on the order of 1%, and realistically well under that.
Assuming it does end up under 100", how unusual, how statistically unlikely would such a total be? The previous record low in a complete season was 172" in 1941-42, trailed closely by 196" in 1940-41 and 191" in 1976-77. So a sub-100" snowfall would be a very extreme outlier at roughly half the previous low. Given the median snowfall of 413" over the full period of record with a standard deviation of 130", a total of 90" would be about 2.5 standard deviations below the median, which is in the 0.6 percentile, or roughly 1 in 160 years!!
That's all based on a normal distribution though, and annual snowfall totals are not "normally" distributed, but it's good enough for a rough approximation of how unlikely a sub-100" snowfall total would be. To verify that, let's see how many years fall under 220", which is 1.5 standard deviations below the median, or 6.7 percentile, roughly 1 in 15 years. Out of the 95 complete years, 6 of them are under 220", which matches the statistical expectation well. So this calculation method seems reasonable despite the snowfall totals not being normally distributed. And given that there are nearly 100 years of data, it's quite reasonable to encounter a 1 in 160 year event in such a data set.
So maybe statistics are pretty useful for this sort of thing?! The roughly 50% statistical chance of breaking 100" did in fact come true, despite all meteorological indications to the contrary. All it took was one strong convergence-zone snowstorm on the night of March 31 to April 1, with snowfall rates of 2-3" per hour for a few hours at its peak, and 15" new for the day. From www.wsdot.com/winter/snoqualmie/:
The current season total of 100" is still about 2.4 standard deviations below the median (413" over the full period of record with a standard deviation of 130"), which is in the 0.8 percentile, or roughly 1 in 120 years!
On a side note, it looks like Snoqualmie Pass will make it through this entire season with ZERO hours of avalanche-control closures:
Here's the recent daily snowfall from i90.atmos.washington.edu/roadview/avalanche/hyak.htm (note that it's not measured at Hyak, but at Snoqualmie Pass 3000 ft):
Snoqualmie Snowfall Report
Courtesy of WSDOT Hyak Operation Center
Date New Snow Snow Depth
Mon Apr 13 0 in 0 in
Sat Apr 11 0 in 0 in
Thu Apr 09 0 in 0 in
Wed Apr 08 0 in 0 in
Tue Apr 07 0 in 0 in
Mon Apr 06 0 in 0 in
Fri Apr 03 0 in 4 in
Thu Apr 02 1 in 9 in <<< Reaches 100" for season!
Wed Apr 01 15 in 15 in
Tue Mar 31 0 in 0 in
Fri Mar 27 0 in 0 in
Wed Mar 25 3 in 3 in
Tue Mar 24 1 in 1 in <<< First snowfall in March!
Mon Mar 23 0 in 0 in
Fri Mar 20 0 in 0 in
Thu Mar 19 0 in 0 in
Wed Mar 18 0 in 0 in
Tue Mar 17 0 in 0 in
Although the Puget Sound convergence zone was kind to Snoqualmie that time, this weekend it missed Snoqualmie entirely, staying farther north and dumping 16" new at Stevens Pass from midday on April 11 into April 12, with similar snowfall rates of 2-3" per hour at its peak. Snoqualmie got relatively little precip from the weekend storm, almost all of which fell as rain at pass level, with only trace amounts of snow.
And here's the NWAC telemetry at Snoqualmie and Alpental over the 2-day period of that March 31 to April 1 storm, saved for posterity:
Northwest Avalanche Center
Washington Department of Transportation
Snoqualmie Pass, Washington
3770' temp above Lake Keechelus snow shed
MM/DD Hour Temp Temp Temp RH Wind Wind Wind Hour Total 24 Hr Total Press
PST F F F % Avg Max Dir Prec. Prec. Snow Snow mb
3760' 3770' 3010' 3010' 3760' 3760' 3760' 3010' 3010' 3010' 3010' 3010'
3 31 500 35 34 36 94 21 37 262 .04 .04 0 0 1013
3 31 600 33 32 35 93 24 47 250 .01 .05 0 1 1014
3 31 700 32 31 35 96 15 28 247 .03 .08 0 0 1014
3 31 800 31 31 33 96 12 20 246 .05 .13 0 0 1015
3 31 900 30 31 33 95 18 27 250 .05 .18 0 0 1016
3 31 1000 31 32 37 92 13 24 257 0 .18 0 -0 1016
3 31 1100 31 33 35 93 10 15 250 .02 .2 0 0 1017
3 31 1200 31 34 34 96 8 13 249 .09 .29 0 1 1017
3 31 1300 32 34 37 94 6 14 256 .02 .31 0 0 1017
3 31 1400 32 31 33 96 14 45 -7999 .04 .35 0 1 1018
3 31 1500 31 30 32 97 14 23 280 .07 .42 0 1 1018
3 31 1600 32 31 32 97 12 19 272 .04 .46 0 0 1018
3 31 1700 31 31 32 97 9 18 249 .07 .53 0 0 1018
3 31 1800 30 31 32 98 5 15 246 .09 .62 0 0 1018
3 31 1900 29 30 31 98 8 19 -7999 .13 .75 2 4 1019
3 31 2000 30 30 31 98 5 13 -7999 .16 .91 2 4 1019
3 31 2100 30 30 32 98 7 16 309 .14 1.05 3 -165 1019
3 31 2200 30 30 31 98 9 20 286 .15 1.2 5 -165 1020
3 31 2300 29 30 31 98 11 18 270 .14 1.34 8 9 1020
4 1 0 30 30 31 98 8 17 -7999 .11 1.45 10 13 1020
4 1 100 30 29 31 98 15 24 253 .14 1.59 10 13 1020
4 1 200 30 29 30 98 14 31 259 .11 1.7 10 14 1021
4 1 300 29 29 31 98 9 15 257 .13 1.83 11 13 1021
4 1 400 28 29 30 98 11 16 254 .14 1.97 10 14 1021
4 1 500 29 29 30 98 7 16 252 .17 .17 0 14 1021
4 1 600 28 29 30 98 11 21 254 .08 .25 0 15 1022
4 1 700 29 29 32 97 7 12 253 .03 .28 0 14 1022
4 1 800 30 30 33 95 8 11 256 .06 .34 0 14 1022
4 1 900 30 33 36 86 10 17 250 .03 .37 0 13 1023
4 1 1000 31 34 37 87 11 19 248 0 .37 0 12 1023
4 1 1100 32 32 39 82 7 16 265 0 .37 0 13 1023
4 1 1200 32 34 38 83 3 8 -7999 0 .37 0 10 1023
4 1 1300 33 35 42 75 6 18 264 0 .37 -0 9 1022
4 1 1400 32 35 45 70 8 13 -7999 0 .37 0 8 1022
4 1 1500 33 35 39 82 12 22 249 0 .37 0 9 1022
4 1 1600 32 32 36 92 8 17 270 .01 .38 0 9 1022
4 1 1700 31 33 35 94 8 15 247 .03 .41 0 10 1022
4 1 1800 31 31 35 93 10 18 255 .02 .43 0 9 1022
4 1 1900 31 31 32 97 15 22 249 .01 .44 0 9 1023
4 1 2000 31 30 32 97 12 19 250 .03 .47 0 9 1023
4 1 2100 30 30 32 97 12 19 255 .02 .49 0 9 1023
4 1 2200 29 30 31 98 8 15 244 0 .49 0 9 1024
4 1 2300 30 29 31 98 9 15 258 0 .49 0 8 1024
4 2 0 29 29 31 98 7 13 253 0 .49 0 9 1024
4 2 100 29 29 32 98 9 13 246 0 .49 0 8 1024
4 2 200 29 29 32 98 8 15 242 0 .49 0 8 1024
4 2 300 29 30 32 98 7 11 243 0 .49 0 8 1024
4 2 400 29 29 31 98 8 12 235 0 .49 0 8 1024
Northwest Avalanche Center
Alpental Ski Area, Washington
Wind gages unheated and may rime
5470' Intermittent snow out
MM/DD Hour Temp Temp Temp RH RH Wind Wind Wind Hour Total 24 Hr Total 24 Hr Total Inter
PST F F F % % Avg Max Dir. Prec. Prec. Snow Snow Snow Snow Snow
5470' 4350' 3100' 3100' 5470' 5520' 5520' 5520' 3100' 3100' 3100' 3100' 4350' 4350' 5470'
3 31 500 28 33 37 96 100 26 45 235 .03 .03 0 13 0 25 39
3 31 600 26 32 36 97 99 20 37 235 .01 .04 0 13 0 24 37
3 31 700 26 32 35 98 100 19 32 234 .02 .06 0 14 0 21 39
3 31 800 27 31 33 99 99 14 24 234 .08 .14 0 14 1 21 39
3 31 900 27 31 34 99 98 18 31 234 .05 .19 0 14 2 22 38
3 31 1000 29 33 36 92 96 19 33 235 .01 .2 0 13 2 283 35
3 31 1100 28 33 35 96 97 15 27 236 .01 .21 0 13 2 283 29
3 31 1200 29 32 34 98 97 16 31 236 .09 .3 0 13 2 283 27
3 31 1300 27 34 36 96 98 20 36 235 .02 .32 0 13 2 23 17
3 31 1400 26 32 33 98 99 20 40 238 .05 .37 0 13 2 23 -27
3 31 1500 26 32 33 99 99 16 26 234 .06 .43 0 12 4 283 -170
3 31 1600 26 32 33 99 99 17 31 234 .04 .47 1 14 4 24 -224
3 31 1700 26 31 33 99 98 11 21 237 .09 .56 1 12 5 283 -132
3 31 1800 25 30 33 99 98 11 24 234 .12 .68 0 14 5 26 -74
3 31 1900 24 29 32 99 98 11 14 241 .13 .81 0 17 7 28 -39
3 31 2000 25 29 33 100 98 7 11 237 .15 .96 4 16 7 27 -18
3 31 2100 24 29 32 99 98 9 21 234 .12 1.08 4 18 8 32 -6
3 31 2200 24 29 33 100 99 11 16 235 .17 1.25 6 20 11 283 4
3 31 2300 24 29 32 100 99 10 20 232 .14 1.39 8 26 14 283 9
4 1 0 24 29 32 100 98 13 22 228 .12 1.51 8 29 16 39 10
4 1 100 24 29 32 100 99 15 27 235 .16 1.67 8 28 17 41 -51
4 1 200 24 28 32 100 99 16 28 234 .11 1.78 8 28 17 283 -31
4 1 300 24 28 32 100 99 15 32 233 .13 1.91 8 21 17 283 -16
4 1 400 23 28 31 100 98 14 26 234 .14 2.05 7 28 17 283 -6
4 1 500 23 28 32 99 98 11 19 234 .14 .14 8 28 18 283 1
4 1 600 24 28 31 100 98 11 28 234 .09 .23 0 28 18 283 7
4 1 700 24 28 33 98 99 12 23 233 .06 .29 0 31 18 41 11
4 1 800 26 29 33 95 99 10 20 234 .04 .33 0 33 18 283 13
4 1 900 31 32 34 95 99 10 17 233 .02 .35 0 32 18 283 12
4 1 1000 32 33 35 93 98 7 13 234 .02 .37 0 32 0 42 7
4 1 1100 34 35 39 85 98 11 20 234 .02 .39 -0 59 0 41 -20
4 1 1200 33 35 39 86 93 8 15 236 .01 .4 -0 66 0 36 -45
4 1 1300 34 36 39 88 91 10 19 237 0 .4 0 72 0 38 -32
4 1 1400 35 37 39 85 89 10 21 248 .01 .41 0 74 0 35 -26
4 1 1500 30 36 39 89 94 8 15 254 0 .41 0 74 0 38 -78
4 1 1600 28 34 35 94 97 11 20 250 .02 .43 0 75 0 36 -10
4 1 1700 29 33 34 95 95 11 18 235 .02 .45 0 75 0 283 2
4 1 1800 28 32 34 96 97 12 20 237 .03 .48 0 75 1 283 7
4 1 1900 26 31 33 98 98 13 22 232 .04 .52 0 75 0 283 -80
4 1 2000 26 31 33 98 99 14 26 247 .04 .56 0 75 2 283 -67
4 1 2100 25 30 33 99 98 16 27 291 .02 .58 0 72 2 283 -29
4 1 2200 24 29 32 99 97 16 28 345 0 .58 0 74 2 283 -13
4 1 2300 23 28 32 100 99 18 26 345 0 .58 0 74 2 41 -8
4 2 0 23 28 32 99 97 18 27 347 0 .58 0 74 2 42 -6
4 2 100 24 28 32 99 98 12 20 348 0 .58 0 74 2 41 -4
4 2 200 24 29 32 99 98 7 17 325 0 .58 0 74 2 41 -4
4 2 300 24 29 32 99 98 12 23 345 0 .58 0 74 2 38 -4
4 2 400 24 29 32 99 97 7 14 327 0 .58 0 74 2 38 -5
Not directly related to Snoqualmie Pass, but my favorite benchmark to judge the decline of the Cascade snowpack is to look at the glaciers.
Statistics may lie, but glaciers don't.
Glaciers may not lie, but they may instead be telling us something different than what we might initially assume.
Clearly glacial recession is proof of a significant decline in snowpack -- but snowpack on what date, and at what elevation? Glacier mass balance depends only on the snowpack remaining in the accumulation zone as of the end of summer, prior to start of the next season's snowfall. At elevations above 6500-8000 ft in the Cascades where the accumulation zones of all glaciers in the range sit, that date is sometime from about September to October in most years, and as late as November in rare years with extremely dry September-Octobers. Only the snowpack which exists in its accumulation zone matters to a glacier's health, while snowpack lower down on the glacier has almost no effect, and snowpack below or off the glacier none at all.
It is well known that glacial mass balance, and glacial recession or expansion, depend very strongly on summer temperatures and cloudiness. A very cool cloudy summer such as the one we had in 2010 following a fairly average snowpack season can result in significant positive mass balance. Much more so than other years like 2008 which by any measure was a huge snowpack year in the Northwest, especially so at low elevations, but with normal warm summer weather resulted in much less gains for the glaciers. An extended pattern of very cool and cloudy summers can result in significant glacial expansion, even with no increase in wintertime snowpack above average levels over that period, while a run of hot sunny dry summers will cause significant glacial recession even if the preceding winter snowpacks were all well above-normal.
So glacial mass balance and glacial recession really tell us nothing about the overall winter snowpack, or at most very little, and they tell us absolutely nothing about the low-elevation snowpack (roughly 1500-3500 ft in the WA Cascades) and even the mid-elevation snowpack (roughly 3500-5500 ft), which lie far below their accumulation zones. As we have seen so clearly during the 2014-15 season, the low-elevation snowpack (extremely below-normal this year) can be highly uncorrelated from the mid- and high-elevation snowpack (way closer to normal this year above 5000 ft), and that relative lack of correlation holds true in many other seasons too, albeit to a lesser degree than this freakish season.
Please Log in or Create an account to join the conversation.
- Floater
- [Floater]
-
- Offline
- New Member
-
Less
More
- Posts: 23
- Thank you received: 0
17 Apr 2015 17:57 #224431
by Floater
Replied by Floater on topic Re: WSDOT - Only 80" of Snow at Snoq Pass this Winter
In a typical year the Snoq area used to be a goto place. Easy to get to, no gate issues, lots of choices as long as the snowpack is deep in the low elevations. This year I did not make one trip there. I hate tearing up my ski bases. The prior year I also found myself avoiding Snoq.
What has been happening at Snoq is quite disconcerting. Even the prior season skiing was limited for Snoq in the opportunities for decent skiing. In recent years January has been pathetic. Sadly I do not see this situation getting any better.
This year was a disaster and sadly some of the prognostications for next year are not very good. It might be in a decade Snoq will essentially be unskiable for a good portion of the ski season.
If people are not seeing this shift they are not being honest the times they are a changin.
Please Log in or Create an account to join the conversation.
- hyak.net
- [hyak.net]
-
- Offline
- Premium Member
-
Less
More
- Posts: 601
- Thank you received: 0
18 Apr 2015 09:43 #224438
by hyak.net
In 2008 Snoqualmie had over 600" and both 2010 and 2011 they opened in November with average (aprox 400") seasons. 2005 was horrible and the past 2 were poor but it was worse from 1977-1981 and the 1940's were even worse then that. Just keep the glass half full, it will be back again.
Replied by hyak.net on topic Re: WSDOT - Only 80" of Snow at Snoq Pass this Winter
In a typical year the Snoq area used to be a goto place. Easy to get to, no gate issues, lots of choices as long as the snowpack is deep in the low elevations. This year I did not make one trip there. I hate tearing up my ski bases. The prior year I also found myself avoiding Snoq.
What has been happening at Snoq is quite disconcerting. Even the prior season skiing was limited for Snoq in the opportunities for decent skiing. In recent years January has been pathetic. Sadly I do not see this situation getting any better.
This year was a disaster and sadly some of the prognostications for next year are not very good. It might be in a decade Snoq will essentially be unskiable for a good portion of the ski season.
If people are not seeing this shift they are not being honest the times they are a changin.
In 2008 Snoqualmie had over 600" and both 2010 and 2011 they opened in November with average (aprox 400") seasons. 2005 was horrible and the past 2 were poor but it was worse from 1977-1981 and the 1940's were even worse then that. Just keep the glass half full, it will be back again.
Please Log in or Create an account to join the conversation.
- Charlie Hagedorn
- [trumpetsailor]
-
- Offline
- Elite Member
-

Less
More
- Posts: 913
- Thank you received: 1
18 Apr 2015 20:10 - 18 Apr 2015 20:16 #224440
by Charlie Hagedorn
Replied by Charlie Hagedorn on topic Re: WSDOT - Only 80" of Snow at Snoq Pass this Winter
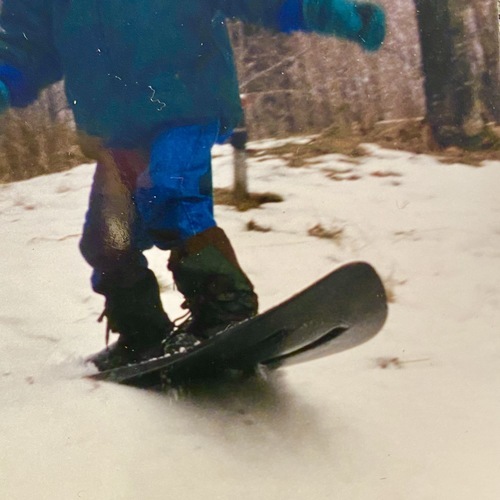
Snoqualmie will be deep again soon. 'Till then, there's a huge playground out there. (Photo Thursday evening).
Please Log in or Create an account to join the conversation.