- Posts: 635
- Thank you received: 0
HUGE storm cycle brings 4-14 ft snow Feb6-25,2014!
- Amar Andalkar
- [andalkar]
-
 Topic Author
- Offline
- Premium Member
-

Less
More
06 Feb 2014 15:09 - 21 Feb 2014 14:44 #220185
by Amar Andalkar
HUGE storm cycle brings 4-14 ft snow Feb6-25,2014! was created by Amar Andalkar
[size=small]Note: Original thread title: Next major storm to bring 4-6 ft snow this week!
Title edited on 02/07/14 to include dates: Next major storm brings 4-6 ft snow Feb 6-14,2014!
Title updated on 02/14/14 to better reflect how this storm cycle has evolved: HUGE storm cycle brings 4-12 ft snow Feb6-21,2014!
Title updated on 02/21/14 to reflect unexpected continuation of this storm cycle: HUGE storm cycle brings 4-14 ft snow Feb6-25,2014![/size]
Next major storm cycle to bring 4-6 ft of snow over the next week, primarily to Oregon and northern California, with 3-4 ft in Washington!
See also earlier threads:
First major storm cycle of the 2013-14 season brings 4-8 ft of snow (January 7-14, 2014)
Another major storm cycle brings 2-5 ft of snow this week (January 28-February 1, 2014)
During the past few days, weather models have started predicting another major change in the weather pattern over the West Coast during the rest of this week and throughout much of next week, to what appears to be a sustained period of typical wintertime weather: a series of storm systems driven by strong westerly flow over the North Pacific. The anomalously strong and persistent ridge of high pressure which has lingered just off the West Coast for much of the last 4 months is no longer a factor as of now, having retreated far to the south where it typically lies during the winter months. Model predictions were varying somewhat the past few days, but subsequent runs now appear to be trending towards greater precip and snowfall amounts, so the predicted large snowfall totals are more likely to actually occur.
The NWS's GFS model and their Quantitative Precipitation Forecasts are showing up to 8-12" of precip over the next week for the mountains of Oregon and northern California, with 3-4" extending north through Washington. Here is total precipitation in inches predicted over the next 7 days through the afternoon of February 13:
If those predictions verify, it would be by far the wettest storm cycle of this entire winter in southern Oregon and California. The first system in the storm cycle has already moved ashore into Oregon and northern California earlier this morning (February 6), with several inches of snow down to near sea level for parts of the Oregon Coast and the Willamette Valley due to the cold air already in place:
The high-resolution UW WRF-GFS model is showing total snowfall amounts up to 4-6 ft or more over the next week for the mountains of Oregon and northern California, with 3-4 ft in Washington. Snowfall during the first 3 days of the storm cycle through 4am Sunday is predicted to be 3-6 ft over the volcanic peaks of the southern Oregon Cascades and California Cascades, plus much of the Sierra Nevada as far south as Mammoth Mountain, and also most of the Wasatch Range in Utah:
Higher resolution version of that, showing the Pacific Northwest and also zoomed in on Oregon:
Maximum amounts of 4-6 ft (marked by white inside yellow) are shown in the Three Sisters region and much of the Cascade Crest from Willamette Pass south past Crater Lake, along with Mount Shasta and Lassen Peak in California.
The snowpack situation in southern Oregon is grim: Crater Lake is normally one of the snowiest locations in Oregon with over 520" of average annual snowfall at Park Headquarters (6470 ft), but as of today it has received only 75" this winter (26% of the normal of 296" by this date), while snowdepth is only 17" (18% of the normal depth of 95" on this date). The February 1 snowdepth of 15" was an all-time record low for the date (previous low was 16" in February 1977) and only 16% of the normal depth of 94", with records extending back to 1920.
Yet the situation is FAR WORSE on Mount Shasta, where there is ZERO snowpack at both the Sand Flat (6800 ft) and Horse Camp (7900 ft) monthly snow course sites as of the February 1 snow survey (measured on January 30 this year) -- easily an all-time record low for the date, the previous lowest amounts were 11" and 13" at the two sites in the February 1991 survey. The normal February 1 snowdepths are 74" at Sand Flat and 89" at Horse Camp, with records extending back to 1945 and 1930 respectively. The Old Ski Bowl telemetry site at 7600 ft on the south side of Shasta may have about 4" on the ground now, while its normal depth is about 90". On Lassen Peak, the snow course at 8250 ft near Lake Helen (by far the snowiest measurement site in California, with normal snowdepths roughly equal to Mount Rainier Paradise and Mount Baker Ski Area) has only 12" as of the January 28 survey, also a record low at only 10% of the normal of 122" (period of record back to 1930) and half the previous low of 24" in the February 1977 survey. These areas need 4-6 ft of new snowfall very badly, probably more than anyplace else in the world!
This loop shows how the model predictions for snowfall during the 3-day period through 4am Sunday have evolved between 10 subsequent runs over the last 5 days, known in the jargon as D(model)/D(t). Lots of major changes in everything during the early model runs several days ago, but then settling into a fairly consistent picture over the last 4 runs during the past 2 days:
www.atmos.washington.edu/~ovens/wxloop.c...2+v2014020912///+-st
There is a minor lull between systems predicted for Sunday, then the next system in the cycle is expected to move ashore into Monday, this time aiming farther north towards northern Oregon, Washington, and southwestern British Columbia. Snowfall during the 4-7 day period, the 3 days ending 4am next Thursday, is predicted to be 3-4 ft over the west slopes and volcanic peaks of the Washington and northern Oregon Cascades, with 3-5 ft in southwestern BC.
Please Log in or Create an account to join the conversation.
- bwalt822
- [bwalt822]
-
- Offline
- New Member
-

Less
More
- Posts: 48
- Thank you received: 0
07 Feb 2014 08:43 #220187
by bwalt822
Replied by bwalt822 on topic Re: Next major storm to bring 4-6 ft snow this week!
I really like these analyses, may I suggest putting the dates of the storm in the title of the thread similar to your links above? It will make it easier to distinguish them and to go back to them later. I.e. Next major storm to bring X to Y ft of snow Feb 9-13!
Please Log in or Create an account to join the conversation.
- flowing alpy
- [flowing alpy]
-
- Offline
- Platinum Member
-

Less
More
- Posts: 1272
- Thank you received: 0
07 Feb 2014 08:50 #220188
by flowing alpy
Replied by flowing alpy on topic Re: Next major storm to bring 4-6 ft snow this week!
pretty pics amar.
b
b
Please Log in or Create an account to join the conversation.
- Pete A
- [Bud]
-
- Offline
- Senior Member
-

Less
More
- Posts: 431
- Thank you received: 0
07 Feb 2014 09:38 #220189
by Pete A
Replied by Pete A on topic Re: Next major storm to bring 4-6 ft snow this week!
yeah! Amar the weather oracle brings good news ")
Please Log in or Create an account to join the conversation.
- Amar Andalkar
- [andalkar]
-
Topic Author
- Offline
- Premium Member
-
Less
More
- Posts: 635
- Thank you received: 0
07 Feb 2014 12:43 - 07 Feb 2014 16:06 #220190
by Amar Andalkar
Thanks, that's a good suggestion, although hard to implement within the TAY software's overly restrictive 50-character limit on topic titles. Especially when writing trip reports, I've so often wished that the limit were about 80 characters instead, which would give much more freedom and flexibility in titling posts. Anyway, I've taken your suggestion and edited the titles of all three threads to include the date as best possible within the limit. It would be nice to include the year also, but there appears to be no way to do so for some of the threads without removing important words from the title -- I re-edited this thread's title to do so.
Update #1 to be posted shortly, later today.
Replied by Amar Andalkar on topic Re: Next major storm to bring 4-6 ft of snow Feb 6-13!
I really like these analyses, may I suggest putting the dates of the storm in the title of the thread similar to your links above? It will make it easier to distinguish them and to go back to them later. I.e. Next major storm to bring X to Y ft of snow Feb 9-13!
Thanks, that's a good suggestion, although hard to implement within the TAY software's overly restrictive 50-character limit on topic titles. Especially when writing trip reports, I've so often wished that the limit were about 80 characters instead, which would give much more freedom and flexibility in titling posts. Anyway, I've taken your suggestion and edited the titles of all three threads to include the date as best possible within the limit. It would be nice to include the year also, but there appears to be no way to do so for some of the threads without removing important words from the title -- I re-edited this thread's title to do so.
Update #1 to be posted shortly, later today.
Please Log in or Create an account to join the conversation.
- Amar Andalkar
- [andalkar]
-
Topic Author
- Offline
- Premium Member
-
Less
More
- Posts: 635
- Thank you received: 0
07 Feb 2014 16:15 - 13 Feb 2014 12:45 #220191
by Amar Andalkar
Replied by Amar Andalkar on topic Re: Next major storm brings 4-6 ft snow Feb 6-14,2014!
Update: 24 hours later, models are still predicting 4-6 ft of snow over the next week for Oregon and northern California, but also now for Washington!
A day later, and 2 subsequent runs of the UW WRF-GFS model at 12-hour intervals continue to predict large snowfall amounts. The predicted amounts for both precip and snowfall have actually increased significantly, for both northern California and Oregon during the first part of the storm cycle over the next 2-3 days through Sunday, and for Washington during the second part over the subsequent 5 days through Friday, February 14.
The NWS's GFS model and their Quantitative Precipitation Forecasts are now showing up to 10-14" of precip over the next week for the mountains of northern California, with 6-8" in Oregon and even into Washington now. Here is total precipitation in inches predicted over the next 7 days through the afternoon of February 14:
As of Friday morning, February 7, up to 4-12" of new snow has already fallen since the storm cycle began 24 hours earlier, throughout the Oregon Cascades and into Washington as far north as Mount Rainier, even including many areas in the foothills and lowlands due to the cold air already in place. Up to 4-8" has also fallen in the California Cascades and the northern Sierra Nevada as far south as Mammoth Mountain.
The next part of this storm cycle is actually a major atmospheric river event, a "Pineapple Express" aimed at northern California. These type of events during wintertime provide the majority of California's annual precipitation, and 10-14" of precip will make a significant improvement to the currently unprecedented drought situation in northern California. This image shows the predicted plume of moisture streaming out of the subtropics near Hawaii towards northern California as of Saturday morning:
The current water vapor satellite image (see www.nrlmry.navy.mil/sat-bin/epac_westcoast.cgi) shows the plume already forming as of Friday afternoon:

Very heavy precipitation and snowfall above 4-5000 ft will begin overnight into Saturday morning for northern California and southern Oregon, and continue through Sunday, with snow levels rising by late Saturday to 6000 ft in southern Oregon and northernmost California, and 8000 ft farther south near Lake Tahoe. Additional snowfall during the next 3 days through 4am Monday is predicted to be 3-6 ft over the volcanic peaks of the southern Oregon Cascades and California Cascades, plus much of the Sierra Nevada as far south as Mammoth Mountain, and also most of the Wasatch Range in Utah:
Higher resolution version of that, showing the Pacific Northwest and also zoomed in on Oregon:
Maximum amounts of 4-6 ft (marked by white inside yellow) are shown on Mount Jefferson, the Three Sisters region, and parts of the Cascade Crest from Willamette Pass south past Crater Lake, along with Mount Shasta and Lassen Peak in California.
There is still a minor lull between systems predicted for late Sunday, then the next system in the cycle is expected to move ashore into Monday, this time aiming farther north towards northern Oregon, Washington, and southwestern British Columbia. The next much stronger system comes ashore in the same region Monday night into Tuesday, evolving into another atmospheric river event by Tuesday afternoon, aimed a few hundred miles farther north than the first. This image shows the predicted plume of moisture streaming out of the subtropics near Hawaii towards Oregon as of Tuesday afternoon:
Snowfall during the 3-6 day period, the 3 days ending 4am next Thursday, is predicted to be 3-5 ft over the west slopes and volcanic peaks of the Washington and northern Oregon Cascades, the Olympics, and southwestern BC.
Beyond that point, it appears that this storm cycle is likely to continue to bring additional systems ashore every 1-2 days, producing continued precip and heavy snowfall through next week. There is another partial lull on Wednesday, then the next system may arrive on Thursday. Additional snowfall during the 2 day period ending 4pm next Friday is predicted to be 2-3 ft over the west slopes and volcanic peaks of the Washington and Oregon Cascades plus southwestern BC.
Details may certainly change as that period draws closer, as it is currently 5-7 days out, near the limit of accurate numerical weather prediction.
A day later, and 2 subsequent runs of the UW WRF-GFS model at 12-hour intervals continue to predict large snowfall amounts. The predicted amounts for both precip and snowfall have actually increased significantly, for both northern California and Oregon during the first part of the storm cycle over the next 2-3 days through Sunday, and for Washington during the second part over the subsequent 5 days through Friday, February 14.
The NWS's GFS model and their Quantitative Precipitation Forecasts are now showing up to 10-14" of precip over the next week for the mountains of northern California, with 6-8" in Oregon and even into Washington now. Here is total precipitation in inches predicted over the next 7 days through the afternoon of February 14:
As of Friday morning, February 7, up to 4-12" of new snow has already fallen since the storm cycle began 24 hours earlier, throughout the Oregon Cascades and into Washington as far north as Mount Rainier, even including many areas in the foothills and lowlands due to the cold air already in place. Up to 4-8" has also fallen in the California Cascades and the northern Sierra Nevada as far south as Mammoth Mountain.
The next part of this storm cycle is actually a major atmospheric river event, a "Pineapple Express" aimed at northern California. These type of events during wintertime provide the majority of California's annual precipitation, and 10-14" of precip will make a significant improvement to the currently unprecedented drought situation in northern California. This image shows the predicted plume of moisture streaming out of the subtropics near Hawaii towards northern California as of Saturday morning:
The current water vapor satellite image (see www.nrlmry.navy.mil/sat-bin/epac_westcoast.cgi) shows the plume already forming as of Friday afternoon:
Very heavy precipitation and snowfall above 4-5000 ft will begin overnight into Saturday morning for northern California and southern Oregon, and continue through Sunday, with snow levels rising by late Saturday to 6000 ft in southern Oregon and northernmost California, and 8000 ft farther south near Lake Tahoe. Additional snowfall during the next 3 days through 4am Monday is predicted to be 3-6 ft over the volcanic peaks of the southern Oregon Cascades and California Cascades, plus much of the Sierra Nevada as far south as Mammoth Mountain, and also most of the Wasatch Range in Utah:
Higher resolution version of that, showing the Pacific Northwest and also zoomed in on Oregon:
Maximum amounts of 4-6 ft (marked by white inside yellow) are shown on Mount Jefferson, the Three Sisters region, and parts of the Cascade Crest from Willamette Pass south past Crater Lake, along with Mount Shasta and Lassen Peak in California.
There is still a minor lull between systems predicted for late Sunday, then the next system in the cycle is expected to move ashore into Monday, this time aiming farther north towards northern Oregon, Washington, and southwestern British Columbia. The next much stronger system comes ashore in the same region Monday night into Tuesday, evolving into another atmospheric river event by Tuesday afternoon, aimed a few hundred miles farther north than the first. This image shows the predicted plume of moisture streaming out of the subtropics near Hawaii towards Oregon as of Tuesday afternoon:
Snowfall during the 3-6 day period, the 3 days ending 4am next Thursday, is predicted to be 3-5 ft over the west slopes and volcanic peaks of the Washington and northern Oregon Cascades, the Olympics, and southwestern BC.
Beyond that point, it appears that this storm cycle is likely to continue to bring additional systems ashore every 1-2 days, producing continued precip and heavy snowfall through next week. There is another partial lull on Wednesday, then the next system may arrive on Thursday. Additional snowfall during the 2 day period ending 4pm next Friday is predicted to be 2-3 ft over the west slopes and volcanic peaks of the Washington and Oregon Cascades plus southwestern BC.
Details may certainly change as that period draws closer, as it is currently 5-7 days out, near the limit of accurate numerical weather prediction.
Please Log in or Create an account to join the conversation.
- filbo
- [filbo]
-
- Offline
- Junior Member
-

Less
More
- Posts: 184
- Thank you received: 0
07 Feb 2014 17:48 #220195
by filbo
Replied by filbo on topic Re: Next major storm brings 4-6 ft snow Feb 6-14,2014!
Amar your meterologic research and forecast reproductions are spot on.
Thanks for the time and effort to let us all know that it is time to ski.
White Pass Resort today was 5" of new and more in sheltered areas from the east winds, all hero snow and no body out. Skied the pow till after 2 and waiting for more. Will be touring all week as well as resort skiing if anyone wants to taste the goods of the northern rim of the goat rocks wilderness.
Please Log in or Create an account to join the conversation.
- Amar Andalkar
- [andalkar]
-
Topic Author
- Offline
- Premium Member
-
Less
More
- Posts: 635
- Thank you received: 0
08 Feb 2014 14:58 - 16 Feb 2014 16:53 #220200
by Amar Andalkar
Replied by Amar Andalkar on topic Re: Next major storm brings 4-6 ft snow Feb 6-14,2014!
Update #2: 48 hours after initial post, models are predicting an additional 4-6 ft of snow (or more) over the next week for Washington and Oregon!
Another day later, and 2 more subsequent runs of the UW WRF-GFS model at 12-hour intervals continue to predict large snowfall amounts. The predicted amounts for both precip and snowfall have actually increased significantly for Washington and Oregon during the second major part of the storm cycle over the 6 days from Monday through Saturday, February 15. Unfortunately, the one area where model predictions for snowfall have decreased significantly is in northernmost California, specifically the Trinity Alps and California Cascades including Mount Shasta and Lassen Peak, where total snowfall amounts are likely to be only 2-3 ft instead of 4-6 ft (perhaps Lassen still might come close to 4 ft). This long-suffering region has by far the least snowpack so far this winter as a percentage of normal of any mountain region in North America (generally 0-5% of normal as of February 1, at most 10% of normal at any site), and they can't seem to catch a break this time either.
The NWS's GFS model and their Quantitative Precipitation Forecasts are now showing up to 6-10" of precip over the next week for the mountains of Oregon and Washington, with an additional 3-7" yet to come for northern California mostly over the next 2 days. Here is total precipitation in inches predicted over the next 7 days through the afternoon of Saturday, February 15:
As of Saturday morning, February 8, another 8-20" of new snow has fallen over the previous 24 hours throughout the Oregon Cascades, California Cascades, and west slopes of the Sierra Nevada as far south as Mammoth Mountain, with lesser amounts of 4-6" into Washington as far north as Mount Rainier. The largest amounts over 1 ft were in Oregon from roughly Santiam Pass through the Three Sisters south to Willamette Pass, topped by 21" new at Mount Bachelor as of 9am with continued heavy snowfall bringing the 24-hour total there to 27" by early afternoon and the snowdepth at mid-mountain (7300 ft) to 105", exceeding that at Paradise and all other NWAC or SNOTEL telemetry sites along the West Coast. Storm totals since early on February 6 now range from about 1-3 ft at most mountain sites from Mount Rainier all the way south to Mammoth Mountain, a span of over 650 miles as the crow flies.
Very heavy precipitation and snowfall will continue through Sunday for northern California and to a lesser degree southern Oregon, with snow levels of 6000 ft in southern Oregon and northernmost California, and 8000 ft farther south near Lake Tahoe. Heavy snowfall will also continue in the northern Oregon and southern Washington Cascades overnight and on Sunday, along the boundary between the eroding Arctic air mass and much warmer air to the south. Additional snowfall during the next 2 days through 4am Monday is predicted to be 2-5 ft over the high Sierra Nevada, with 2-3 ft on Lassen Peak and 1-2 ft over the Oregon and southern Washington Cascades:
Higher resolution version of that, showing the Pacific Northwest:
There is still a minor lull between systems predicted for late Sunday, then the next system in the cycle is expected to move ashore into Monday, this time aiming farther north towards northern Oregon, Washington, and southwestern British Columbia. The next much stronger system comes ashore in the same region Monday night into Tuesday, evolving into another atmospheric river event by Tuesday afternoon, aimed a few hundred miles farther north than the first. Snowfall during the 2-5 day period, the 3 days ending 4am next Thursday, is predicted to be 3-6 ft over the west slopes and volcanic peaks of the Washington and northern Oregon Cascades, the Olympics, and southwestern BC.
This loop shows how the model predictions for snowfall during the 3-day period through 4am Thursday have evolved between 6 subsequent runs over the last 3 days, known in the jargon as D(model)/D(t). Very consistent in the overall picture throughout, with snowfall amounts for WA increasing over the most recent runs during the past 2 days:
www.atmos.washington.edu/~ovens/wxloop.c...2+v2014021312///+-st
This is a higher resolution version zoomed in on Washington, covering a 3 day period which overlaps parts of the previous two graphics, ending 4pm Tuesday. Sorry about the confusing overlap of time periods, but it's temporarily unavoidable given the UW model's running cycle at 4km resolution and the timing of incoming storm systems -- however, this graphic is simply too good to omit! Maximum snowfall amounts of 4-6 ft (marked by white inside yellow) are shown throughout the west slopes and volcanic peaks of the Olympics and Washington Cascades, plus Mount Hood:
Beyond that point, the model still predicts that this storm cycle is likely to continue to bring additional systems ashore every 1-2 days, producing continued precip and heavy snowfall through next week. There may be another partial lull on Wednesday, then the next system may arrive on Thursday. Additional snowfall during the 2 day period ending 4am next Saturday is predicted to be 2-3 ft over the west slopes and volcanic peaks of the Washington and Oregon Cascades plus southwestern BC.
Details may certainly change as that period draws closer, as it is still 5-7 days out, near the limit of accurate numerical weather prediction.
Please Log in or Create an account to join the conversation.
- Amar Andalkar
- [andalkar]
-
Topic Author
- Offline
- Premium Member
-
Less
More
- Posts: 635
- Thank you received: 0
09 Feb 2014 15:57 - 09 Feb 2014 19:58 #220221
by Amar Andalkar
Replied by Amar Andalkar on topic Re: Next major storm brings 4-6 ft snow Feb 6-14,2014!
Update #3: 72 hours after initial post, models are still predicting an additional 4-6 ft of snow (or more) over the next week for Washington and Oregon!
Another day later, and 2 more subsequent runs of the UW WRF-GFS model at 12-hour intervals continue to predict large snowfall amounts over the next week, in addition to 1-5 ft of snow which has already fallen over the past 3 days at most mountain sites from Mount Rainier all the way south to Mammoth Mountain, a span of over 650 miles as the crow flies. The predicted amounts for both precip and snowfall remain similar to those predicted 24 hours ago. Note that there is some sort of error with the UW model's 12 km and 36 km domains (which extend out to 180 hours) since partway through Saturday evening's run and including the entire Sunday morning run, so predictions and graphics from those runs are not available at this time.
The first stage of this storm cycle, aimed primarily at the Sierra Nevada (an atmospheric river) and also at Oregon and southern Washington (frontal snowfall along the boundary between a modified Arctic air mass and warmer air to the south), is nearing completion on Sunday. The next stage will begin by Monday morning and extend throughout the next week, featuring a series of fronts and systems every 1-2 days in strong westerly flow over the north Pacific, aimed primarily at northern Oregon, Washington, and southwestern British Columbia. The fire hose of the jet stream (see Days 1-5 Jet Stream Analysis & Forecasts ) will be aimed directly into the Pacific Northwest all week, perhaps peaking in intensity at well over 160 knots (over 190 mph) on Thursday, February 13 -- it's been a LONG time since the jet stream looked anything like this, although this is often a typical look during normal wintertime:
The NWS's GFS model and their Quantitative Precipitation Forecasts are now showing up to 8-11" of precip over the next week for the mountains of Oregon and Washington, with an additional 1-3" yet to come for northern California mostly over the next day. Here is total precipitation in inches predicted over the next 7 days through the morning of Sunday, February 16:

As of Sunday morning, February 9, another 6-15" of new snow has fallen over the previous 24 hours throughout the northern Oregon and southern Washington Cascades from Mount Bachelor north to Mount Rainier, with a few inches as far north as Stevens Pass and also in the southern Oregon Cascades. Note that snowfall in the North Cascades north of Stevens Pass and in southwest BC has been near-zero thus far during this storm cycle, with an Arctic air mass in place keeping skies mostly clear and temperatures well below normal -- although that is already changing quickly as of Sunday afternoon, with a few inches of new snow falling at Mount Baker. There was substantial lowland snow from the Columbia Gorge north to the Seattle-Everett area too during Saturday afternoon and evening, with 3-6" in much of southwest Washington. It was quite a surprise snowstorm for Seattle, as no forecasts had predicted any accumulating snow that far north -- but 2" accumulated on my deck at 100 ft above sea level in Seattle from 6-11pm on Saturday evening, with similar amounts for most of the city.
But the real jackpot for snowfall was in California as expected, with 1-3 ft falling in a 24-hour period from Lassen Peak south to Mammoth Mountain, with the highest amounts near Lake Tahoe at elevations above 7000 ft, where most of the ski areas were reporting 30-40" new at their upper stations with much lower amounts at their bases. Freakish snow differentials between lower and upper stations included 2-32" at Northstar's 6800 ft mid-mountain and 8600 ft summit, and 0.5-38" at Squaw Valley's 6200 ft base and 8200 ft upper basin, with Squaw closed for the day due to excessive heavy wet snow and avalanche hazard (as was Kirkwood). Storm totals at most of those ski area upper stations are now 4-5 ft, with perhaps 1-2 ft more possible by Monday morning.
Here is a humorous sequence of images captured by the Northstar Snow Stake Cam at 8300 ft over the past 36 hours, showing the snowfall accumulating to almost 30" deep in 24 hours just before the automated flipping mechanism attempts to clear the stake at 5:40am Sunday -- but the 180° flip fails to complete, and the snow stake sits helplessly ajar until mid-afternoon, when someone finally fixes it:
There is currently a partial lull between systems for the rest of Sunday, then the next system in the cycle will move ashore overnight into Monday, this time aiming farther north towards northern Oregon, Washington, and southwestern British Columbia. The next much stronger system comes ashore in the same region on Tuesday, evolving into another atmospheric river event aimed a few hundred miles farther north than the first.
Additional snowfall during the next 3 days through 4am Wednesday is predicted to be 3-6 ft over the west slopes and volcanic peaks of the Washington and northern Oregon Cascades, the Olympics, and southwestern BC, with 1-2 ft over the Sierra Nevada (all of that by Monday). Note that the first 12 km graphic here is taken from Saturday evening's partially completed 12 km model run:
Higher resolution version of that (from the current Sunday morning model run, through 4pm Wednesday), showing the Pacific Northwest and also zoomed in on Washington and Oregon:
Maximum snowfall amounts of 4-6 ft (marked by white inside yellow) are shown throughout the west slopes and volcanic peaks of the Olympics and Washington Cascades, parts of southwest BC, plus Mounts Hood, Jefferson, and the Three Sisters in Oregon.
Graphics beyond 84 hours are not available at this time due to the UW model run issues mentioned above.
Another day later, and 2 more subsequent runs of the UW WRF-GFS model at 12-hour intervals continue to predict large snowfall amounts over the next week, in addition to 1-5 ft of snow which has already fallen over the past 3 days at most mountain sites from Mount Rainier all the way south to Mammoth Mountain, a span of over 650 miles as the crow flies. The predicted amounts for both precip and snowfall remain similar to those predicted 24 hours ago. Note that there is some sort of error with the UW model's 12 km and 36 km domains (which extend out to 180 hours) since partway through Saturday evening's run and including the entire Sunday morning run, so predictions and graphics from those runs are not available at this time.
The first stage of this storm cycle, aimed primarily at the Sierra Nevada (an atmospheric river) and also at Oregon and southern Washington (frontal snowfall along the boundary between a modified Arctic air mass and warmer air to the south), is nearing completion on Sunday. The next stage will begin by Monday morning and extend throughout the next week, featuring a series of fronts and systems every 1-2 days in strong westerly flow over the north Pacific, aimed primarily at northern Oregon, Washington, and southwestern British Columbia. The fire hose of the jet stream (see Days 1-5 Jet Stream Analysis & Forecasts ) will be aimed directly into the Pacific Northwest all week, perhaps peaking in intensity at well over 160 knots (over 190 mph) on Thursday, February 13 -- it's been a LONG time since the jet stream looked anything like this, although this is often a typical look during normal wintertime:
The NWS's GFS model and their Quantitative Precipitation Forecasts are now showing up to 8-11" of precip over the next week for the mountains of Oregon and Washington, with an additional 1-3" yet to come for northern California mostly over the next day. Here is total precipitation in inches predicted over the next 7 days through the morning of Sunday, February 16:
As of Sunday morning, February 9, another 6-15" of new snow has fallen over the previous 24 hours throughout the northern Oregon and southern Washington Cascades from Mount Bachelor north to Mount Rainier, with a few inches as far north as Stevens Pass and also in the southern Oregon Cascades. Note that snowfall in the North Cascades north of Stevens Pass and in southwest BC has been near-zero thus far during this storm cycle, with an Arctic air mass in place keeping skies mostly clear and temperatures well below normal -- although that is already changing quickly as of Sunday afternoon, with a few inches of new snow falling at Mount Baker. There was substantial lowland snow from the Columbia Gorge north to the Seattle-Everett area too during Saturday afternoon and evening, with 3-6" in much of southwest Washington. It was quite a surprise snowstorm for Seattle, as no forecasts had predicted any accumulating snow that far north -- but 2" accumulated on my deck at 100 ft above sea level in Seattle from 6-11pm on Saturday evening, with similar amounts for most of the city.
But the real jackpot for snowfall was in California as expected, with 1-3 ft falling in a 24-hour period from Lassen Peak south to Mammoth Mountain, with the highest amounts near Lake Tahoe at elevations above 7000 ft, where most of the ski areas were reporting 30-40" new at their upper stations with much lower amounts at their bases. Freakish snow differentials between lower and upper stations included 2-32" at Northstar's 6800 ft mid-mountain and 8600 ft summit, and 0.5-38" at Squaw Valley's 6200 ft base and 8200 ft upper basin, with Squaw closed for the day due to excessive heavy wet snow and avalanche hazard (as was Kirkwood). Storm totals at most of those ski area upper stations are now 4-5 ft, with perhaps 1-2 ft more possible by Monday morning.
Here is a humorous sequence of images captured by the Northstar Snow Stake Cam at 8300 ft over the past 36 hours, showing the snowfall accumulating to almost 30" deep in 24 hours just before the automated flipping mechanism attempts to clear the stake at 5:40am Sunday -- but the 180° flip fails to complete, and the snow stake sits helplessly ajar until mid-afternoon, when someone finally fixes it:
There is currently a partial lull between systems for the rest of Sunday, then the next system in the cycle will move ashore overnight into Monday, this time aiming farther north towards northern Oregon, Washington, and southwestern British Columbia. The next much stronger system comes ashore in the same region on Tuesday, evolving into another atmospheric river event aimed a few hundred miles farther north than the first.
Additional snowfall during the next 3 days through 4am Wednesday is predicted to be 3-6 ft over the west slopes and volcanic peaks of the Washington and northern Oregon Cascades, the Olympics, and southwestern BC, with 1-2 ft over the Sierra Nevada (all of that by Monday). Note that the first 12 km graphic here is taken from Saturday evening's partially completed 12 km model run:
Higher resolution version of that (from the current Sunday morning model run, through 4pm Wednesday), showing the Pacific Northwest and also zoomed in on Washington and Oregon:
Maximum snowfall amounts of 4-6 ft (marked by white inside yellow) are shown throughout the west slopes and volcanic peaks of the Olympics and Washington Cascades, parts of southwest BC, plus Mounts Hood, Jefferson, and the Three Sisters in Oregon.
Graphics beyond 84 hours are not available at this time due to the UW model run issues mentioned above.
Please Log in or Create an account to join the conversation.
- filbo
- [filbo]
-
- Offline
- Junior Member
-
Less
More
- Posts: 184
- Thank you received: 0
09 Feb 2014 17:35 #220223
by filbo
Replied by filbo on topic Re: Next major storm brings 4-6 ft snow Feb 6-14,2014!
An unusual aspect reared its head this morning at white pass which is about 20 miles south east of Mt Rainier as the crow flies and that was a wierd inversion which produced a rain crust on all of the fresh overnite snow above 5000 ft and kept the powder skiable below. A bit of a drag but sometimes that is the deal in the pnw.
Please Log in or Create an account to join the conversation.
- Andrew Carey
- [acarey]
-
- Offline
- Elite Member
-

Less
More
- Posts: 912
- Thank you received: 0
09 Feb 2014 19:44 #220236
by Andrew Carey
Yes.
Replied by Andrew Carey on topic Re: Next major storm brings 4-6 ft snow Feb 6-14,2014!
An unusual aspect reared its head this morning at white pass which is about 20 miles south east of Mt Rainier as the crow flies and that was a wierd inversion which produced a rain crust on all of the fresh overnite snow above 5000 ft and kept the powder skiable below. A bit of a drag but sometimes that is the deal in the pnw.
Yes.
Please Log in or Create an account to join the conversation.
- Amar Andalkar
- [andalkar]
-
Topic Author
- Offline
- Premium Member
-
Less
More
- Posts: 635
- Thank you received: 0
10 Feb 2014 15:25 - 16 Feb 2014 16:54 #220257
by Amar Andalkar
Replied by Amar Andalkar on topic Re: Next major storm brings 4-6 ft snow Feb 6-14,2014!
Update #4: 96 hours after initial post, an additional 4-8 ft of snow (or more) is predicted over the next week for Washington and Oregon!
Another day later, and 2 more subsequent runs of the UW WRF-GFS model at 12-hour intervals continue to predict large snowfall amounts of 4-8 ft (and perhaps much more) over the next week for Washington and Oregon, in addition to 2-6 ft of snow which has already fallen over the past 4 days at most mountain sites from Mount Rainier all the way south to Mammoth Mountain, a span of over 650 miles as the crow flies. The predicted amounts for both precip and snowfall over the next week remain similar to those predicted 24 and 48 hours ago, a good sign of stability in the model's predictions, with a slight increase in overall totals as further storm systems come into view. (Note that the problem with the UW model's 12 km and 36 km domains has been fixed as of Monday morning, and the missing model runs since Sunday morning have been run retroactively.)
The first stage of this storm cycle, aimed primarily at the Sierra Nevada (an atmospheric river) and also at Oregon and southern Washington (frontal snowfall along the boundary between a modified Arctic air mass and warmer air to the south), is pretty much over as of Monday. The next stage has already begun early Monday morning and will extend throughout this week, featuring a series of fronts and systems every 1-2 days in strong westerly and southwesterly flow over the north Pacific, aimed primarily at northern Oregon, Washington, and southwestern British Columbia.
The NWS's GFS model and their Quantitative Precipitation Forecasts continue to show up to 8-11" of precip over the next week for the mountains of southwestern BC, Washington, Oregon, and northwestern California, with much smaller amounts of only a fraction of an inch farther south in the Sierra. Here is total precipitation in inches predicted over the next 7 days through the morning of Monday, February 17:
As of Monday morning, February 10, another 4-6" of new snow has fallen over the previous 24 hours throughout the Washington Cascades and in southernmost BC on the North Shore of Vancouver, with much lesser amounts of 1-2" farther south in the Oregon Cascades as freezing levels rose sharply on Sunday morning to 6000 ft or higher with cold air still trapped at lower elevations, producing rain crusts and freezing rain in some areas like Mount Hood and White Pass. Additional snowfall during the day Monday has already produced another 4-8" of new snow since this morning (as of 2pm) at many sites in the Washington Cascades, even on the east side of the range, with the snow level varying from 2000-5000 ft north to south (and depending on easterly pass flow), while the northern Oregon Cascades have again gotten a mix of precip with barely 1-2" of new snow and snow levels still near 6000 ft.
Once again the jackpot for 24-hour snowfall as of Monday morning was in California, with another 0.5-2 ft falling from Lassen Peak south to Mammoth Mountain, with the highest amounts near Lake Tahoe at elevations above 7000 ft, where most of the ski areas were reporting 12-24" new at their upper stations with much lower amounts of only a few inches at their bases just like the previous day. Final storm totals at many ski area upper stations near Lake Tahoe above 8000 ft are now 5-7 ft, with more like 1-2 ft total at the 6000 ft level. Areas farther south such as Yosemite and Mammoth received much less snowfall, only about 2-3 ft even at 9000 ft, and only 2" total at 9000 ft on June Mountain located just north of Mammoth in the rain shadow of the Sierra Crest. Little additional snowfall is currently expected over the next week for any part of the Sierra Nevada.
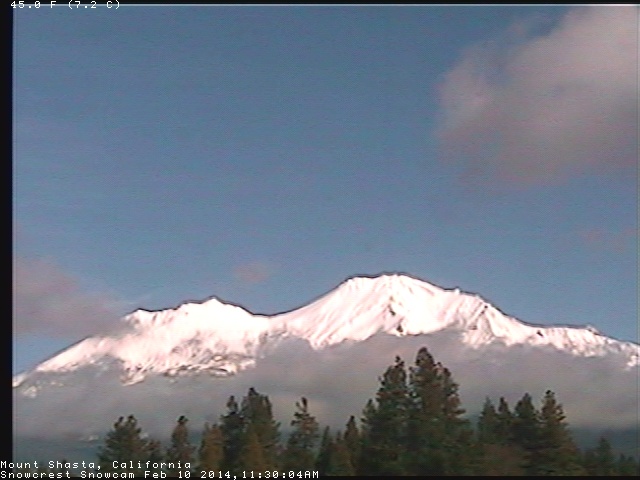
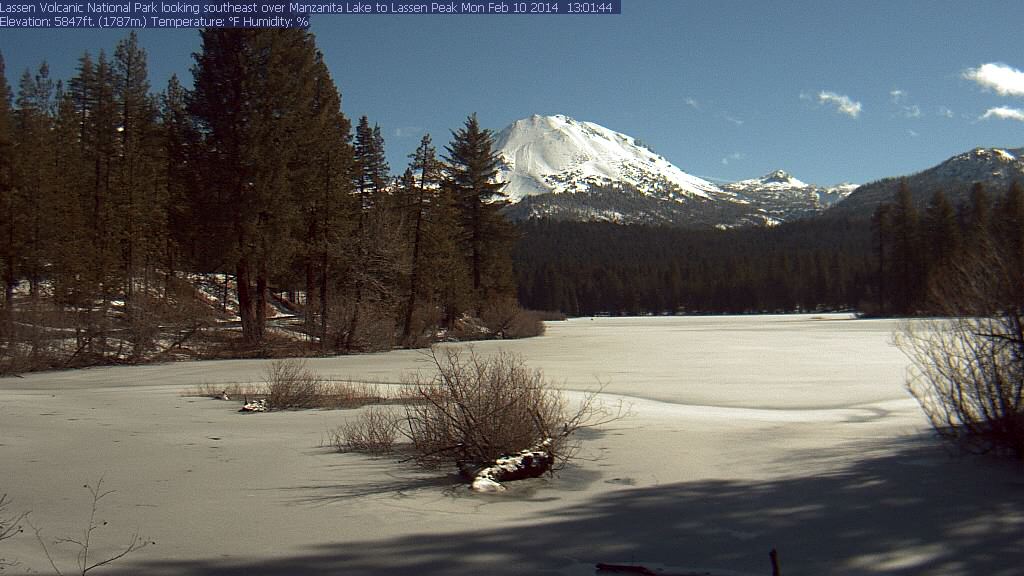
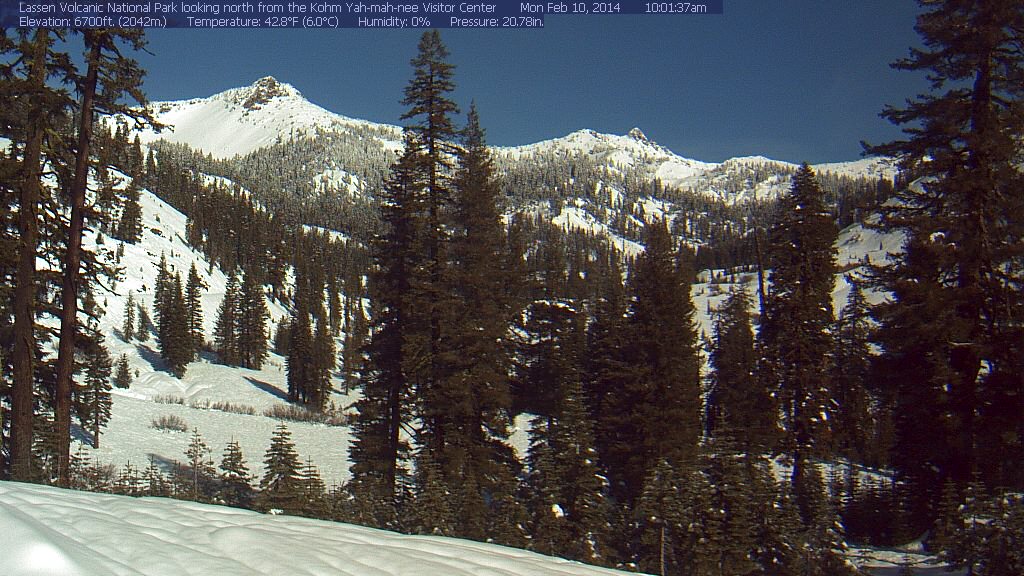
In the Cascade Range, snow totals thus far since the storm cycle began early on February 6 range from a few inches in the North Cascades and Mount Baker, to about 1 ft at Stevens and Snoqualmie Passes, 1.5 ft at Mount Rainier Paradise, 2.5 ft at White Pass and Mount Hood, 3.5 ft on Mount Bachelor, 2 ft at Willamette Pass and Crater Lake, and 1.5-2 ft on Mount Shasta. Snowfall totals on Lassen Peak are unknown due to a long-term outage at the 8250 ft Lake Helen telemetry site, but are probably about 3-4 ft at that elevation given about 2 ft near the park's southwest entrance at 6700 ft. It's nice to see Shasta and Lassen looking snowy and white once again today as they should be, since both were still almost entirely bare as of 2 weeks ago and had only a thin skift of snow prior to this storm cycle:
The first system of the second phase of this cycle has already come ashore Monday morning, this time aimed farther north towards northern Oregon, Washington, and southwestern British Columbia. The next much stronger system comes ashore in the same region on Tuesday afternoon, evolving into another atmospheric river event aimed a few hundred miles farther north than the first. This image shows the predicted plume of moisture streaming out of the subtropics near Hawaii towards Oregon as of Tuesday afternoon, which looks very similar to the same image in Update #1 above generated 3 days earlier, another good sign of stability in the model's predictions:
This atmospheric river is expected to stay in place for the next 3-4 days, weakening only slightly by Thursday afternoon and more significantly by Saturday afternoon before it finally fades away:
Snowfall during the next 3 days through 4am Thursday is predicted to be 3-6 ft over the west slopes and volcanic peaks of the Washington and northern Oregon Cascades, the Olympics, and southwestern BC:
Higher resolution version of that, showing the Pacific Northwest and also zoomed in on Washington and Oregon:
Maximum snowfall amounts of 4-6 ft (marked by white inside yellow) are shown throughout the west slopes and volcanic peaks of the Olympics and Washington Cascades, parts of southwest BC, plus Mounts Hood, Jefferson, and the Three Sisters in Oregon.
This loop shows how the model predictions for snowfall during the 3-day period through 4am Thursday have evolved between 9 subsequent runs (1 missing) over the last 5 days, known in the jargon as D(model)/D(t). Very consistent in the overall picture throughout, with snowfall amounts increasing and decreasing a bit, but no major changes except that the bit of snow predicted for the Sierra on some runs has now vanished:
www.atmos.washington.edu/~ovens/wxloop.c...2+v2014021312///+-st
Additional snowfall during the 3-6 day period, the 3 days ending 4am next Sunday, is predicted to be 2-3 ft over the west slopes and volcanic peaks of the Washington and northern Oregon Cascades, the Olympics, and southwestern BC.
If those model predictions verify, it would bring the snowpack to well above normal values at most sites above 4000-5000 ft in southwestern BC and the Washington and northern Oregon Cascades, and close to normal values in the Olympics and southern Oregon Cascades (above 6000 ft). The snowpack at low elevations (below 4000 ft in WA, 5-6000 ft in OR) may remain below normal however, as snow levels will fluctuate above those elevations at times throughout the upcoming week.
Beyond that point, it appears that this storm cycle is likely to continue to bring additional systems ashore every 1-2 days, producing continued precip and heavy snowfall through next weekend and perhaps beyond. Additional snowfall during the 2 day period ending 4pm next Monday (which overlaps the previous graphic by 12 hours) is predicted to be 2-5 ft over the west slopes and volcanic peaks of the Washington Cascades and Olympics plus southwestern BC, with about 1 ft for the Oregon Cascades.
Details may certainly change as that period draws closer, as it is currently 5-7 days out, near the limit of accurate numerical weather prediction. But it puts the predicted 7.5-day snowfall totals at roughly 6-12 ft (!!) over the west slopes and volcanic peaks of the Washington Cascades, the Olympics, and southwestern BC, with about 4-8 ft in the Oregon Cascades.
Another day later, and 2 more subsequent runs of the UW WRF-GFS model at 12-hour intervals continue to predict large snowfall amounts of 4-8 ft (and perhaps much more) over the next week for Washington and Oregon, in addition to 2-6 ft of snow which has already fallen over the past 4 days at most mountain sites from Mount Rainier all the way south to Mammoth Mountain, a span of over 650 miles as the crow flies. The predicted amounts for both precip and snowfall over the next week remain similar to those predicted 24 and 48 hours ago, a good sign of stability in the model's predictions, with a slight increase in overall totals as further storm systems come into view. (Note that the problem with the UW model's 12 km and 36 km domains has been fixed as of Monday morning, and the missing model runs since Sunday morning have been run retroactively.)
The first stage of this storm cycle, aimed primarily at the Sierra Nevada (an atmospheric river) and also at Oregon and southern Washington (frontal snowfall along the boundary between a modified Arctic air mass and warmer air to the south), is pretty much over as of Monday. The next stage has already begun early Monday morning and will extend throughout this week, featuring a series of fronts and systems every 1-2 days in strong westerly and southwesterly flow over the north Pacific, aimed primarily at northern Oregon, Washington, and southwestern British Columbia.
The NWS's GFS model and their Quantitative Precipitation Forecasts continue to show up to 8-11" of precip over the next week for the mountains of southwestern BC, Washington, Oregon, and northwestern California, with much smaller amounts of only a fraction of an inch farther south in the Sierra. Here is total precipitation in inches predicted over the next 7 days through the morning of Monday, February 17:
As of Monday morning, February 10, another 4-6" of new snow has fallen over the previous 24 hours throughout the Washington Cascades and in southernmost BC on the North Shore of Vancouver, with much lesser amounts of 1-2" farther south in the Oregon Cascades as freezing levels rose sharply on Sunday morning to 6000 ft or higher with cold air still trapped at lower elevations, producing rain crusts and freezing rain in some areas like Mount Hood and White Pass. Additional snowfall during the day Monday has already produced another 4-8" of new snow since this morning (as of 2pm) at many sites in the Washington Cascades, even on the east side of the range, with the snow level varying from 2000-5000 ft north to south (and depending on easterly pass flow), while the northern Oregon Cascades have again gotten a mix of precip with barely 1-2" of new snow and snow levels still near 6000 ft.
Once again the jackpot for 24-hour snowfall as of Monday morning was in California, with another 0.5-2 ft falling from Lassen Peak south to Mammoth Mountain, with the highest amounts near Lake Tahoe at elevations above 7000 ft, where most of the ski areas were reporting 12-24" new at their upper stations with much lower amounts of only a few inches at their bases just like the previous day. Final storm totals at many ski area upper stations near Lake Tahoe above 8000 ft are now 5-7 ft, with more like 1-2 ft total at the 6000 ft level. Areas farther south such as Yosemite and Mammoth received much less snowfall, only about 2-3 ft even at 9000 ft, and only 2" total at 9000 ft on June Mountain located just north of Mammoth in the rain shadow of the Sierra Crest. Little additional snowfall is currently expected over the next week for any part of the Sierra Nevada.
In the Cascade Range, snow totals thus far since the storm cycle began early on February 6 range from a few inches in the North Cascades and Mount Baker, to about 1 ft at Stevens and Snoqualmie Passes, 1.5 ft at Mount Rainier Paradise, 2.5 ft at White Pass and Mount Hood, 3.5 ft on Mount Bachelor, 2 ft at Willamette Pass and Crater Lake, and 1.5-2 ft on Mount Shasta. Snowfall totals on Lassen Peak are unknown due to a long-term outage at the 8250 ft Lake Helen telemetry site, but are probably about 3-4 ft at that elevation given about 2 ft near the park's southwest entrance at 6700 ft. It's nice to see Shasta and Lassen looking snowy and white once again today as they should be, since both were still almost entirely bare as of 2 weeks ago and had only a thin skift of snow prior to this storm cycle:
The first system of the second phase of this cycle has already come ashore Monday morning, this time aimed farther north towards northern Oregon, Washington, and southwestern British Columbia. The next much stronger system comes ashore in the same region on Tuesday afternoon, evolving into another atmospheric river event aimed a few hundred miles farther north than the first. This image shows the predicted plume of moisture streaming out of the subtropics near Hawaii towards Oregon as of Tuesday afternoon, which looks very similar to the same image in Update #1 above generated 3 days earlier, another good sign of stability in the model's predictions:
This atmospheric river is expected to stay in place for the next 3-4 days, weakening only slightly by Thursday afternoon and more significantly by Saturday afternoon before it finally fades away:
Snowfall during the next 3 days through 4am Thursday is predicted to be 3-6 ft over the west slopes and volcanic peaks of the Washington and northern Oregon Cascades, the Olympics, and southwestern BC:
Higher resolution version of that, showing the Pacific Northwest and also zoomed in on Washington and Oregon:
Maximum snowfall amounts of 4-6 ft (marked by white inside yellow) are shown throughout the west slopes and volcanic peaks of the Olympics and Washington Cascades, parts of southwest BC, plus Mounts Hood, Jefferson, and the Three Sisters in Oregon.
This loop shows how the model predictions for snowfall during the 3-day period through 4am Thursday have evolved between 9 subsequent runs (1 missing) over the last 5 days, known in the jargon as D(model)/D(t). Very consistent in the overall picture throughout, with snowfall amounts increasing and decreasing a bit, but no major changes except that the bit of snow predicted for the Sierra on some runs has now vanished:
www.atmos.washington.edu/~ovens/wxloop.c...2+v2014021312///+-st
Additional snowfall during the 3-6 day period, the 3 days ending 4am next Sunday, is predicted to be 2-3 ft over the west slopes and volcanic peaks of the Washington and northern Oregon Cascades, the Olympics, and southwestern BC.
If those model predictions verify, it would bring the snowpack to well above normal values at most sites above 4000-5000 ft in southwestern BC and the Washington and northern Oregon Cascades, and close to normal values in the Olympics and southern Oregon Cascades (above 6000 ft). The snowpack at low elevations (below 4000 ft in WA, 5-6000 ft in OR) may remain below normal however, as snow levels will fluctuate above those elevations at times throughout the upcoming week.
Beyond that point, it appears that this storm cycle is likely to continue to bring additional systems ashore every 1-2 days, producing continued precip and heavy snowfall through next weekend and perhaps beyond. Additional snowfall during the 2 day period ending 4pm next Monday (which overlaps the previous graphic by 12 hours) is predicted to be 2-5 ft over the west slopes and volcanic peaks of the Washington Cascades and Olympics plus southwestern BC, with about 1 ft for the Oregon Cascades.
Details may certainly change as that period draws closer, as it is currently 5-7 days out, near the limit of accurate numerical weather prediction. But it puts the predicted 7.5-day snowfall totals at roughly 6-12 ft (!!) over the west slopes and volcanic peaks of the Washington Cascades, the Olympics, and southwestern BC, with about 4-8 ft in the Oregon Cascades.
Please Log in or Create an account to join the conversation.
- andybrnr
- [andybrnr]
-
- Offline
- New Member
-
Less
More
- Posts: 25
- Thank you received: 0
10 Feb 2014 17:04 #220262
by andybrnr
Replied by andybrnr on topic Re: Next major storm brings 4-6 ft snow Feb 6-14,2014!
Looking at the evolution of a single deterministic model run over several days lets us build what is called a "lagged ensemble", where each model run samples possible future states of the atmosphere. Variability from run to run reflects both model errors and uncertainty in initial conditions. While more recent runs in principle should receive more weight (they reflect more up-to-date initial conditions and shorter model integration to a specific future point in time), prior runs do help us understand how stable the solution is (more stable -> greater confidence that the forecast will verify), and in certain cases give a better idea of possible scenarios when the forecast is quite sensitive to small changes and there is great variability even at short lead times.
One step better, though, is to take advantage of calibrated ensemble forecasts, such as those available from the NAEFS. This approach uses 42 individual forecasts (20 from the NCEP GFS ensemble forecast, 20 from the Canadian ensemble system, plus a control run from each), that includes slight changes in model physics and initial conditions. By looking at the evolution of these runs from the same start time, we get a better sense of what the underlying uncertainty is. Let's look at the EPSgram for Seattle produced in the latest available forecast:

We have a depiction of predicted ranges during successive 12 hour periods for temperature, precip, wind, and cloud cover. The yellow bars give the range included within the middle quartiles of the distribution (25%-75%), whiskers give the most extreme members, and the black bar within the yellow is the median value. This isn't a perfect way to represent the ensemble forecast, as the interquartile spread and median are only really useful for a distribution of possibilities that is smooth with a single peak (unimodal), whereas the real distribution of outcomes at a point may look more bi-modal (a storm does or does not form/hit that point)... that said, it intuitively gives us a better appreciation of the range of possible outcomes. It also gives us a sense of the uncertainty of the forecast in the future based on how quickly the range within the whiskers/25-75% quartiles grows. While the details of a single deterministic forecast are almost certain to be wrong beyond 5 days or so, qualitative shifts in the ensemble forecast (e.g. wet to dry, warm to cold, etc.), which reflect changes in the large scale pattern, have shown pretty good skill at week or so long lead times in certain situations, such as major shifts in the location of the Pacific high and associated offshore ridge. Based on the above plot, it seems that the next week is quite likely to remain in a relatively stormy pattern. Freezing level fluctuations will be important in terms of figuring out exactly how well we do in improving the regional snowpack, but the temperatures don't look overly warm (correlating SEA surface temp with FRZ level is not the perfect way to do this, but it's a good zeroth order approach). Link to this tool is here .

Another nice way to view ensemble output is to look at probability of event occurrence on a map, where the event can be "temperature below freezing", "rain accumulation greater than X", etc., which is derived from the number of ensemble members for which the event is true at each location within a set time interval. The above map shows the probability of more than 1cm of accumulated precip (liquid water equivalent) over the 24 hour period from Feb. 12-13. If we increase the threshold to 2.5cm (an inch of liquid water equiv), we get this

high probabilities of decent precip. But what about the snowline?

For the same period, we see that the odds of surface temps along the mountains being significantly below freezing are marginal, so it's likely some portion of this precip will fall as rain at the passes. The model resolution for the ensemble is somewhat low, so mountainous terrain is not all that well resolved and thus this picture just reflects a somewhat higher freezing level. Link to the page for generating these figures is here .
Another output that's quite nice, recently added to the 4km UW WRF-GFS output, is the 3hr snow and rain imagery , which gives a sense of where snow line will be as the storms progress. Looks like the model trend has been towards higher snow levels over the last three or four runs based on D(model)/Dt, agreeing with the probability of freezing output from the ensemble shown above, but we will see. NAEFS shows the later systems trend colder, which the extended WRF-GFS 12km run agrees with, as well.
Andy
One step better, though, is to take advantage of calibrated ensemble forecasts, such as those available from the NAEFS. This approach uses 42 individual forecasts (20 from the NCEP GFS ensemble forecast, 20 from the Canadian ensemble system, plus a control run from each), that includes slight changes in model physics and initial conditions. By looking at the evolution of these runs from the same start time, we get a better sense of what the underlying uncertainty is. Let's look at the EPSgram for Seattle produced in the latest available forecast:
We have a depiction of predicted ranges during successive 12 hour periods for temperature, precip, wind, and cloud cover. The yellow bars give the range included within the middle quartiles of the distribution (25%-75%), whiskers give the most extreme members, and the black bar within the yellow is the median value. This isn't a perfect way to represent the ensemble forecast, as the interquartile spread and median are only really useful for a distribution of possibilities that is smooth with a single peak (unimodal), whereas the real distribution of outcomes at a point may look more bi-modal (a storm does or does not form/hit that point)... that said, it intuitively gives us a better appreciation of the range of possible outcomes. It also gives us a sense of the uncertainty of the forecast in the future based on how quickly the range within the whiskers/25-75% quartiles grows. While the details of a single deterministic forecast are almost certain to be wrong beyond 5 days or so, qualitative shifts in the ensemble forecast (e.g. wet to dry, warm to cold, etc.), which reflect changes in the large scale pattern, have shown pretty good skill at week or so long lead times in certain situations, such as major shifts in the location of the Pacific high and associated offshore ridge. Based on the above plot, it seems that the next week is quite likely to remain in a relatively stormy pattern. Freezing level fluctuations will be important in terms of figuring out exactly how well we do in improving the regional snowpack, but the temperatures don't look overly warm (correlating SEA surface temp with FRZ level is not the perfect way to do this, but it's a good zeroth order approach). Link to this tool is here .
Another nice way to view ensemble output is to look at probability of event occurrence on a map, where the event can be "temperature below freezing", "rain accumulation greater than X", etc., which is derived from the number of ensemble members for which the event is true at each location within a set time interval. The above map shows the probability of more than 1cm of accumulated precip (liquid water equivalent) over the 24 hour period from Feb. 12-13. If we increase the threshold to 2.5cm (an inch of liquid water equiv), we get this
high probabilities of decent precip. But what about the snowline?
For the same period, we see that the odds of surface temps along the mountains being significantly below freezing are marginal, so it's likely some portion of this precip will fall as rain at the passes. The model resolution for the ensemble is somewhat low, so mountainous terrain is not all that well resolved and thus this picture just reflects a somewhat higher freezing level. Link to the page for generating these figures is here .
Another output that's quite nice, recently added to the 4km UW WRF-GFS output, is the 3hr snow and rain imagery , which gives a sense of where snow line will be as the storms progress. Looks like the model trend has been towards higher snow levels over the last three or four runs based on D(model)/Dt, agreeing with the probability of freezing output from the ensemble shown above, but we will see. NAEFS shows the later systems trend colder, which the extended WRF-GFS 12km run agrees with, as well.
Andy
Please Log in or Create an account to join the conversation.
- Amar Andalkar
- [andalkar]
-
Topic Author
- Offline
- Premium Member
-
Less
More
- Posts: 635
- Thank you received: 0
11 Feb 2014 11:55 - 11 Feb 2014 13:40 #220284
by Amar Andalkar
Replied by Amar Andalkar on topic Re: Next major storm brings 4-6 ft snow Feb 6-14,2014!
Thanks for the info Andy, those ensemble predictions are interesting, and not something I've previously paid much attention too.
I have really liked the 3hr snow and rain imagery since it was added (it's also available on the 1 1/3 km domain too) and look at it every time, that's a very useful tool during fluctuating snow levels like those over the next few days.
By the way, since you're a UW Atmos insider: is there some way you could ask them to generate the 12 km 700 mb temp-winds-heights graphics out to 180 hours instead of just 84? Most of the other 12 km graphics are generated out to 180 hours, but not that one. The 12 km 700 mb temp-winds-heights is by far the most useful tool I've found for predicting freezing levels and winds (especially their spatial and temporal variation) on the volcanoes during sunny periods when it's time to go big, and having to use the 36 km 700 mb temp-winds-heights graphics from 84-180 hours is not nearly as good. I tried sending a very nice email to David Ovens requesting that change (and also that the snowfall graphics be generated during June and September at least if not the whole summer, as they are currently turned off for several months), but have not heard back since that was sent in late November. Maybe he's really busy, I'm terrible at replying to email too.
Please Log in or Create an account to join the conversation.
- Amar Andalkar
- [andalkar]
-
Topic Author
- Offline
- Premium Member
-
Less
More
- Posts: 635
- Thank you received: 0
11 Feb 2014 12:18 - 16 Feb 2014 16:55 #220285
by Amar Andalkar
Replied by Amar Andalkar on topic Re: Next major storm brings 4-6 ft snow Feb 6-14,2014!
Update #5: 120 hours after initial post, 2-6 ft has already fallen in Washington, Oregon, and California,
with an additional 4-8 ft of snow (or more) predicted over the next week for WA, OR, and southwest BC!
[size=small]Missed a decent powder day (with sunshine too!) at Crystal Mountain today -- the UW model's morning and evening runs yesterday predicted barely a couple inches new snowfall overnight at that location (it's in the rain shadow of Rainier), and only 1-2" had fallen by 10pm last night. Then awoke at 6:30am to shockingly see 6-8" new on the telemetry and webcam, a clear miss for the model at least on that fine scale -- but 6:30am is far too late to start getting ready and then leave Seattle on a Crystal powder day, it's best to be on the road no later than 6am. And I couldn't bring myself to try out the 17" new atop Alpental given the steady dose of rain and freezing rain on the lower elevations there. I guess on some days like this, it's fortunate that I can find intellectual pleasure in collecting snowfall data and analyzing snowfall forecasts, even when I miss out on actually skiing the new snow, and it's also nice to realize that I'll be happily skiing some of this same snow well into midsummer. But I'm having a hard time coming close to breaking even on my Crystal season pass again this year, given that I mostly tour instead of riding the lifts, and that lift-served conditions there were rarely worth the cost of gas from Seattle for the first 2 months of the season. Oh well, anyway, on to the update:[/size]
Another day later, and 2 more subsequent runs of the UW WRF-GFS model at 12-hour intervals continue to predict large snowfall amounts of 4-8 ft (and perhaps much more) over the next week for Washington and Oregon, in addition to 2-6 ft of snow which has already fallen over the past 5 days at most mountain sites from Mount Baker all the way south to Mammoth Mountain, a span of about 800 miles as the crow flies. The predicted amounts for both precip and snowfall over the next week remain similar to those predicted during the last 3 days, a good sign of stability in the model's predictions, with a continuing increase in overall totals as further storm systems come into view this weekend and into next week. If these predictions verify and the storm cycle continues as expected for another week or more, this will end up solidly in the HUGE storm cycle category with 10-day snowfall totals exceeding 10 ft at many sites especially above 4000-5000 ft in the Washington and northern Oregon Cascades plus southwestern BC.
The first stage of this storm cycle, aimed primarily at the Sierra Nevada (an atmospheric river) and also at Oregon and southern Washington (frontal snowfall along the boundary between a modified Arctic air mass and warmer air to the south), began early on Thursday, February 6, and ended during the day Monday, February 10. The next stage started early Monday morning and will extend throughout this week into the weekend, featuring a series of fronts and systems every 1-2 days in strong westerly and southwesterly flow over the north Pacific, aimed primarily at northern Oregon, Washington, and southwestern British Columbia.
The NWS's GFS model and their Quantitative Precipitation Forecasts continue to show up to 8-12" of precip over the next week for the mountains of southwestern BC, Washington, Oregon, and northwestern California, with much smaller amounts of only a fraction of an inch farther south in the Sierra. Here is total precipitation in inches predicted over the next 7 days through the morning of Tuesday, February 18:
The fire hose of the jet stream (see Days 1-5 Jet Stream Analysis & Forecasts ) will be aimed directly into the Pacific Northwest all week, perhaps peaking in intensity at almost 200 knots (about 230 mph) on Thursday afternoon, February 13, a significant increase in intensity from earlier predictions:
By Sunday the jet stream pattern is expected to have evolved and shifted, now approaching directly from the west -- a much better direction for large snowfall totals at much lower snow levels:
As of Tuesday morning, February 11, another 6-20" of new snow has fallen over the previous 24 hours throughout the Washington Cascades (even on the east side of the range), southwestern BC, and Mount Hood, with much lesser amounts of 1-2" farther south in the Oregon Cascades to Mount Bachelor. Snow levels varied from 2000-5000 ft north to south (and strongly depended on easterly pass flow until that diminished on Monday afternoon), and were initially about 6000 ft on Mount Hood before dropping to 5000 ft after the cold front passed through. This time the jackpot was solidly in the North Cascades, with over 20" new at Washington Pass and 12-18" new at the Chilliwack River BCRFC site (in the BC Cascades just north of the US border), Mount Baker, Mazama, Stevens Pass, Lake Wenatchee, and the top of Alpental, along with many SNOTEL sites throughout the North Cascades including Brown Top , Harts Pass , Rainy Pass , Park Creek Ridge , Lyman Lake , Trinity , etc. Farther north and south of the jackpot region, amounts were in the 6-10" range at Whistler, Hurricane Ridge, Crystal Mountain, Mount Rainier Paradise, White Pass, and Mount Hood. Throughout the Cascade Range, snow totals thus far since the storm cycle began early on February 6 range from 1.5 ft in the North Cascades and Mount Baker, 2 ft at Stevens Pass, 1.5 ft at Snoqualmie Pass (with 2.5 ft atop Alpental) and at Crystal, 2 ft at Mount Rainier Paradise, 3 ft at White Pass and Mount Hood, 3.5 ft on Mount Bachelor, 2 ft at Willamette Pass and Crater Lake, 1.5-2 ft on Mount Shasta, and roughly 2-4 ft on Lassen Peak (actual totals there are unknown due to a long-term outage at the 8250 ft Lake Helen telemetry site, plus the complete wintertime closure of the visitor center at the park's 6700 ft southwest entrance due to budget concerns, where daily snowfall measurements are normally taken).
[size=small]Sunrise glow on Mount Baker and Twin Sisters Mountain after a night of heavy snowfall, as seen on the visibility camera from Ferndale .[/size]
There is a minor lull between systems during the day Tuesday, then the next much stronger and somewhat warmer system arrives later this afternoon and overnight through Wednesday. Another weaker system arrives Wednesday evening overnight into Thursday, followed by another lull and then a stronger system on Friday. Snowfall during the next 3 days through 4pm Friday is predicted to be 3-6 ft over the west slopes and volcanic peaks of the Washington and northern Oregon Cascades, the Olympics, and southwestern BC:
Higher resolution version of that, showing the Pacific Northwest and also zoomed in on Washington and Oregon:
Maximum snowfall amounts of 4-6 ft (marked by white inside yellow) are shown throughout the west slopes and volcanic peaks of the Olympics and Washington Cascades, parts of southwest BC, plus Mounts Hood, Jefferson, the Three Sisters, and even Newberry Volcano (shocking given that it's 30 miles east of the Cascade Crest and normally quite rain-shadowed) in Oregon. Some major volcanoes have been labeled on the last graphic for clarity.
This loop shows how the model predictions for snowfall during the 3-day period through 4pm Friday have evolved between 7 subsequent runs (2 missing) over the last 5 days, the D(model)/D(t). Very consistent in the overall picture throughout, with snowfall amounts increasing and decreasing a bit, but no major changes except that the bit of snow predicted for the Sierra on some runs has now vanished:
www.atmos.washington.edu/~ovens/wxloop.c...2+v2014021500///+-st
Additional snowfall during the subsequent 3 days ending 4pm next Monday is predicted to be another 3-6 ft over the west slopes and volcanic peaks of the Washington Cascades, Olympics, and southwestern BC, with 2-3 ft in the Oregon Cascades and perhaps several inches extending into the California Cascades and northern Sierra Nevada.
Beyond that point, it appears that this storm cycle is likely to continue to bring additional systems ashore every 1-2 days, producing continued precip and heavy snowfall into the start of next week and perhaps beyond. Additional snowfall during the 1 day period ending 4pm next Tuesday is predicted to be 2-3 ft over the Oregon and California Cascades, with 1-2 ft in the Washington Cascades and Olympics plus southwestern BC.
Details may certainly change as that period draws closer, as it is currently 6-7 days out, near the limit of accurate numerical weather prediction. But it puts the predicted 7.5-day snowfall totals at roughly 7-14 ft (!!) over the west slopes and volcanic peaks of the Washington Cascades, the Olympics, and southwestern BC, with about 5-12 ft in the Oregon Cascades and perhaps 2-4 ft in the California Cascades, all of that on top of the 2-6 ft that have already fallen. Awesome!
with an additional 4-8 ft of snow (or more) predicted over the next week for WA, OR, and southwest BC!
[size=small]Missed a decent powder day (with sunshine too!) at Crystal Mountain today -- the UW model's morning and evening runs yesterday predicted barely a couple inches new snowfall overnight at that location (it's in the rain shadow of Rainier), and only 1-2" had fallen by 10pm last night. Then awoke at 6:30am to shockingly see 6-8" new on the telemetry and webcam, a clear miss for the model at least on that fine scale -- but 6:30am is far too late to start getting ready and then leave Seattle on a Crystal powder day, it's best to be on the road no later than 6am. And I couldn't bring myself to try out the 17" new atop Alpental given the steady dose of rain and freezing rain on the lower elevations there. I guess on some days like this, it's fortunate that I can find intellectual pleasure in collecting snowfall data and analyzing snowfall forecasts, even when I miss out on actually skiing the new snow, and it's also nice to realize that I'll be happily skiing some of this same snow well into midsummer. But I'm having a hard time coming close to breaking even on my Crystal season pass again this year, given that I mostly tour instead of riding the lifts, and that lift-served conditions there were rarely worth the cost of gas from Seattle for the first 2 months of the season. Oh well, anyway, on to the update:[/size]
Another day later, and 2 more subsequent runs of the UW WRF-GFS model at 12-hour intervals continue to predict large snowfall amounts of 4-8 ft (and perhaps much more) over the next week for Washington and Oregon, in addition to 2-6 ft of snow which has already fallen over the past 5 days at most mountain sites from Mount Baker all the way south to Mammoth Mountain, a span of about 800 miles as the crow flies. The predicted amounts for both precip and snowfall over the next week remain similar to those predicted during the last 3 days, a good sign of stability in the model's predictions, with a continuing increase in overall totals as further storm systems come into view this weekend and into next week. If these predictions verify and the storm cycle continues as expected for another week or more, this will end up solidly in the HUGE storm cycle category with 10-day snowfall totals exceeding 10 ft at many sites especially above 4000-5000 ft in the Washington and northern Oregon Cascades plus southwestern BC.
The first stage of this storm cycle, aimed primarily at the Sierra Nevada (an atmospheric river) and also at Oregon and southern Washington (frontal snowfall along the boundary between a modified Arctic air mass and warmer air to the south), began early on Thursday, February 6, and ended during the day Monday, February 10. The next stage started early Monday morning and will extend throughout this week into the weekend, featuring a series of fronts and systems every 1-2 days in strong westerly and southwesterly flow over the north Pacific, aimed primarily at northern Oregon, Washington, and southwestern British Columbia.
The NWS's GFS model and their Quantitative Precipitation Forecasts continue to show up to 8-12" of precip over the next week for the mountains of southwestern BC, Washington, Oregon, and northwestern California, with much smaller amounts of only a fraction of an inch farther south in the Sierra. Here is total precipitation in inches predicted over the next 7 days through the morning of Tuesday, February 18:
The fire hose of the jet stream (see Days 1-5 Jet Stream Analysis & Forecasts ) will be aimed directly into the Pacific Northwest all week, perhaps peaking in intensity at almost 200 knots (about 230 mph) on Thursday afternoon, February 13, a significant increase in intensity from earlier predictions:
By Sunday the jet stream pattern is expected to have evolved and shifted, now approaching directly from the west -- a much better direction for large snowfall totals at much lower snow levels:
As of Tuesday morning, February 11, another 6-20" of new snow has fallen over the previous 24 hours throughout the Washington Cascades (even on the east side of the range), southwestern BC, and Mount Hood, with much lesser amounts of 1-2" farther south in the Oregon Cascades to Mount Bachelor. Snow levels varied from 2000-5000 ft north to south (and strongly depended on easterly pass flow until that diminished on Monday afternoon), and were initially about 6000 ft on Mount Hood before dropping to 5000 ft after the cold front passed through. This time the jackpot was solidly in the North Cascades, with over 20" new at Washington Pass and 12-18" new at the Chilliwack River BCRFC site (in the BC Cascades just north of the US border), Mount Baker, Mazama, Stevens Pass, Lake Wenatchee, and the top of Alpental, along with many SNOTEL sites throughout the North Cascades including Brown Top , Harts Pass , Rainy Pass , Park Creek Ridge , Lyman Lake , Trinity , etc. Farther north and south of the jackpot region, amounts were in the 6-10" range at Whistler, Hurricane Ridge, Crystal Mountain, Mount Rainier Paradise, White Pass, and Mount Hood. Throughout the Cascade Range, snow totals thus far since the storm cycle began early on February 6 range from 1.5 ft in the North Cascades and Mount Baker, 2 ft at Stevens Pass, 1.5 ft at Snoqualmie Pass (with 2.5 ft atop Alpental) and at Crystal, 2 ft at Mount Rainier Paradise, 3 ft at White Pass and Mount Hood, 3.5 ft on Mount Bachelor, 2 ft at Willamette Pass and Crater Lake, 1.5-2 ft on Mount Shasta, and roughly 2-4 ft on Lassen Peak (actual totals there are unknown due to a long-term outage at the 8250 ft Lake Helen telemetry site, plus the complete wintertime closure of the visitor center at the park's 6700 ft southwest entrance due to budget concerns, where daily snowfall measurements are normally taken).
[size=small]Sunrise glow on Mount Baker and Twin Sisters Mountain after a night of heavy snowfall, as seen on the visibility camera from Ferndale .[/size]
There is a minor lull between systems during the day Tuesday, then the next much stronger and somewhat warmer system arrives later this afternoon and overnight through Wednesday. Another weaker system arrives Wednesday evening overnight into Thursday, followed by another lull and then a stronger system on Friday. Snowfall during the next 3 days through 4pm Friday is predicted to be 3-6 ft over the west slopes and volcanic peaks of the Washington and northern Oregon Cascades, the Olympics, and southwestern BC:
Higher resolution version of that, showing the Pacific Northwest and also zoomed in on Washington and Oregon:
Maximum snowfall amounts of 4-6 ft (marked by white inside yellow) are shown throughout the west slopes and volcanic peaks of the Olympics and Washington Cascades, parts of southwest BC, plus Mounts Hood, Jefferson, the Three Sisters, and even Newberry Volcano (shocking given that it's 30 miles east of the Cascade Crest and normally quite rain-shadowed) in Oregon. Some major volcanoes have been labeled on the last graphic for clarity.
This loop shows how the model predictions for snowfall during the 3-day period through 4pm Friday have evolved between 7 subsequent runs (2 missing) over the last 5 days, the D(model)/D(t). Very consistent in the overall picture throughout, with snowfall amounts increasing and decreasing a bit, but no major changes except that the bit of snow predicted for the Sierra on some runs has now vanished:
www.atmos.washington.edu/~ovens/wxloop.c...2+v2014021500///+-st
Additional snowfall during the subsequent 3 days ending 4pm next Monday is predicted to be another 3-6 ft over the west slopes and volcanic peaks of the Washington Cascades, Olympics, and southwestern BC, with 2-3 ft in the Oregon Cascades and perhaps several inches extending into the California Cascades and northern Sierra Nevada.
Beyond that point, it appears that this storm cycle is likely to continue to bring additional systems ashore every 1-2 days, producing continued precip and heavy snowfall into the start of next week and perhaps beyond. Additional snowfall during the 1 day period ending 4pm next Tuesday is predicted to be 2-3 ft over the Oregon and California Cascades, with 1-2 ft in the Washington Cascades and Olympics plus southwestern BC.
Details may certainly change as that period draws closer, as it is currently 6-7 days out, near the limit of accurate numerical weather prediction. But it puts the predicted 7.5-day snowfall totals at roughly 7-14 ft (!!) over the west slopes and volcanic peaks of the Washington Cascades, the Olympics, and southwestern BC, with about 5-12 ft in the Oregon Cascades and perhaps 2-4 ft in the California Cascades, all of that on top of the 2-6 ft that have already fallen. Awesome!
Please Log in or Create an account to join the conversation.
- andybrnr
- [andybrnr]
-
- Offline
- New Member
-
Less
More
- Posts: 25
- Thank you received: 0
11 Feb 2014 13:00 #220286
by andybrnr
Replied by andybrnr on topic Re: Next major storm brings 4-6 ft snow Feb 6-14,2014!
I'll walk next door and ask him. I also nudged him on trying to find a better color scale for the 850mb temps, but he tossed that back to me as a project and I haven't gotten around to it. Just extending how far forward they're generated should be a trivial change, though. Cliff Mass keeps him pretty busy, so your e-mail probably just got buried under his to-do list. I also would like to keep the snow product around for a few extra months, I'll ask if we can keep it for June/Sept, at least.
The ensemble stuff is the way all weather forecasting will move in the future. It's an interesting research problem to figure out how to make all the data that comes out most useful/easily processed.
The ensemble stuff is the way all weather forecasting will move in the future. It's an interesting research problem to figure out how to make all the data that comes out most useful/easily processed.
Please Log in or Create an account to join the conversation.
- Amar Andalkar
- [andalkar]
-
Topic Author
- Offline
- Premium Member
-
Less
More
- Posts: 635
- Thank you received: 0
12 Feb 2014 14:54 - 16 Feb 2014 16:55 #220334
by Amar Andalkar
Replied by Amar Andalkar on topic Re: Next major storm brings 4-6 ft snow Feb 6-14,2014!
Update #6: 144 hours after initial post, 2-6 ft has already fallen in southwest BC, Washington, Oregon, and California,
with an additional 4-8 ft of snow (or more) predicted over the next week for WA, OR, and southwest BC!
Another day later, and 2 more subsequent runs of the UW WRF-GFS model at 12-hour intervals continue to predict large snowfall amounts of 4-8 ft (and perhaps much more) over the next week for Washington, Oregon, and southwest BC, along with about 3-5 ft in northern California. This is in addition to 2-6 ft of snow which has already fallen over the past 6 days at most mountain sites from Bella Coola, BC, all the way south to Mammoth Mountain, a span of about 1100 miles as the crow flies (and well over 1500 miles by car). The predicted amounts for both precip and snowfall over the next week remain similar to those predicted during the last 3-4 days, a good sign of stability in the model's predictions, with a continuing increase in overall totals as further storm systems come into view this weekend and into next week. If these predictions verify and the storm cycle continues as expected for another week or more, this will end up solidly in the HUGE storm cycle category with 10-day snowfall totals exceeding 10 ft at many sites especially above 4000-5000 ft in the Washington and northern Oregon Cascades plus southwestern BC.
The first stage of this storm cycle, aimed primarily at the Sierra Nevada (an atmospheric river) and also at Oregon and southern Washington (frontal snowfall along the boundary between a modified Arctic air mass and warmer air to the south), began early on Thursday, February 6, and ended during the day Monday, February 10. The second stage of this storm cycle started early Monday morning and will extend throughout this week into the weekend, featuring a series of fronts and systems every 1-2 days in strong westerly and southwesterly flow over the north Pacific, aimed primarily at Oregon, Washington, and southwestern British Columbia. The first system of the second stage came ashore Monday morning, and the next much stronger system arrived in the same region on Tuesday afternoon, including another atmospheric river event aimed at Oregon, a few hundred miles farther north than the first atmospheric river aimed at the central Sierra Nevada. The water vapor satellite image from Wednesday morning (see www.nrlmry.navy.mil/sat-bin/epac_westcoast.cgi) shows the plume of moisture aimed at northern Oregon:
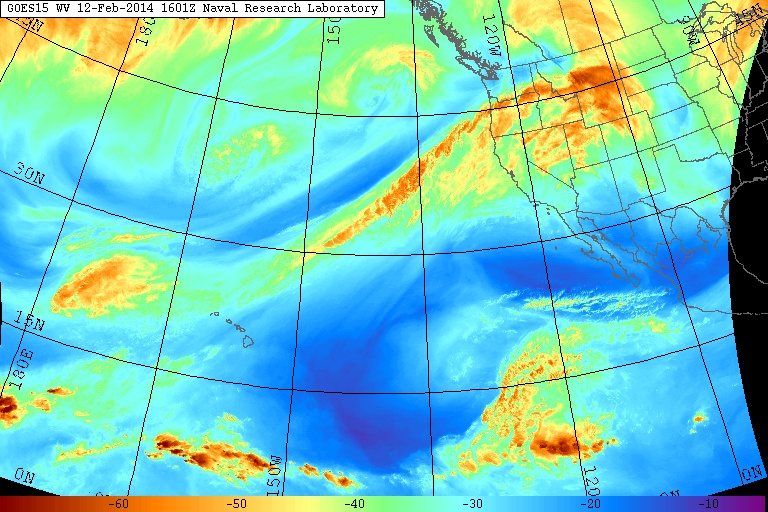
This atmospheric river is expected to stay in place for the next 3-4 days while slowly shifting southward, weakening slightly by Thursday afternoon and more significantly by Saturday afternoon before it finally fades away on Sunday. Compare these graphics with the same ones in Update #4 above generated 2 days earlier, things look very similar to earlier predictions with only slight changes in the position and strength of the atmospheric river, eventually shifting a couple hundred miles farther south into northern California, which will bring some more precipitation to that area over the weekend:
The NWS's GFS model and their Quantitative Precipitation Forecasts continue to show up to 8-14" of precip over the next week for the mountains of southwestern BC, Washington, Oregon, and northwestern California, with much smaller amounts of only 1-3" extending farther south into the northern Sierra. Here is total precipitation in inches predicted over the next 7 days through the afternoon of Wednesday, February 19:
As of Wednesday morning, February 12, another 6-28" of new snow has fallen over the previous 24 hours at higher elevations throughout the Washington and Oregon Cascades, Olympics, and southwestern BC as far north as Bella Coola. Snow levels rose overnight and early Wednesday to about 2000 ft near Bella Coola, 4000 ft near Whistler, 5000 ft in the North Cascades, 6000 ft from Snoqualmie Pass south to White Pass, and 7000 ft throughout the Oregon Cascades, but were already beginning to drop quickly by Wednesday mid-morning from north to south as the ill-defined trailing cold front of this storm system passed through. This time the snowfall jackpot was in southwestern BC, with a claimed 28" new at Mount Washington (4500 ft) on Vancouver Island (which will reopen Thursday after being closed for the past 2 weeks due to insufficient snowpack), over 18" new at the Squamish River BCRFC site (4550 ft, west of Whistler), 16" at Spuzzum Creek BCRFC site (3950 ft, east of Harrison Lake), and 14" Whistler Mountain (5400 ft). In Washington and Oregon, the largest amounts were over 12" at Buckinghorse SNOTEL in the Olympics, 13" at Mount Baker Ski Area (4200 ft), 12" atop Alpental, 9-13" at Mount Bachelor (6300 and 7300 ft), and 10" at Crater Lake Rim (7050 ft). Mount Hood (and also Saint Helens) received over 3" of precipitation with about 6-8" new snow at Timberline at 5900 ft, but snowfall amounts of 2-3 ft were likely above 7000 ft.
Throughout the Cascade Range, Olympics, and southwestern BC, snow totals thus far since the storm cycle began early on February 6 range from 2 ft at the Burnt Bridge Creek (4400 ft, east of Bella Coola) and Squamish River BCRFC sites , 1.5 ft at Whistler, 1 ft at Hurricane Ridge, 2 ft at Buckinghorse SNOTEL , 2.5 ft at Mount Baker, 2 ft in much of the North Cascades, 2.5 ft at Stevens Pass, 2 ft at Snoqualmie Pass (with 3.5 ft atop Alpental), 1 ft at Mission Ridge, 2 ft at Crystal, 2.5 ft at Mount Rainier Paradise, 3.5 ft at White Pass and Mount Hood (with perhaps 5 ft above 7000 ft), 2.5 ft at Santiam Pass, 4.5 ft on Mount Bachelor, 2 ft at Willamette Pass, 2.5-3 ft at Crater Lake, 1.5-2 ft on Mount Shasta, and roughly 2-4 ft on Lassen Peak (actual totals there are unknown due to a long-term outage at the 8250 ft Lake Helen telemetry site, plus the complete wintertime closure of the visitor center at the park's 6700 ft southwest entrance due to budget concerns, where daily snowfall measurements are normally taken).
The strong system Tuesday night also featured very high winds, with maximum gusts of over 100 mph at Mission Ridge, Crystal Mountain, White Pass, and Mt Hood Meadows (Top of Cascade Express), with winds over 90 mph atop Alpental and at Camp Muir.
[size=small]The Mountain comes out on Wednesday afternoon during a lull between systems, capped by a lenticular cloud revealing the strong westerly winds aloft.[/size]
There is another minor lull between systems during the day Wednesday in Washington (not much of a lull in Oregon), then the next somewhat cooler system arrives later Wednesday evening and overnight through Thursday. Another lull on Thursday afternoon and evening, then the next stronger system arrives by midnight and continues through Friday. Yet another system is in the pipeline for Saturday. Snowfall during the next 3 days through 4pm Saturday is predicted to be 3-5 ft over the west slopes and volcanic peaks of the Washington and northern Oregon Cascades, the Olympics, and southwestern BC, with perhaps up to 1 ft extending into the California Cascades on Saturday:
Higher resolution version of that, showing the Pacific Northwest and also zoomed in on Washington and Oregon:
Maximum snowfall amounts of 4-5 ft (marked by white inside yellow) are shown along the west slopes of the Olympics and the volcanic peaks of the Washington and Oregon Cascades. In Oregon, even Newberry Volcano and Yamsay Mountain (another large shield volcano east of Crater Lake, the highest volcano in the eastern Cascade chain at 8196 ft) are shown with 3-4 ft expected, shocking given that both are 30 miles east of the Cascade Crest and normally quite rain-shadowed! Some major volcanoes have been labeled on the last graphic for clarity.
This loop shows how the model predictions for snowfall during the 3-day period through 4pm Saturday have evolved between 7 subsequent runs (2 missing) over the last 5 days, the D(model)/D(t). Very consistent in the overall picture throughout, with snowfall amounts increasing and decreasing a bit, but no major changes except for a trend towards more snowfall in the California Cascades on the latest runs:
www.atmos.washington.edu/~ovens/wxloop.c...2+v2014021600///+-st
Additional snowfall during the subsequent 3 days ending 4pm next Tuesday is predicted to be another 3-6 ft over the west slopes and volcanic peaks of the Washington and Oregon Cascades, Olympics, and southwestern BC, with 2-3 ft now extending into the California Cascades, Trinity Alps, and northern Sierra Nevada. These systems over the weekend are also likely to feature somewhat lower snow levels than the systems thus far this week.
Beyond that point, it appears that this storm cycle is likely to continue to bring additional systems ashore every 1-2 days, producing continued precip and heavy snowfall into the middle of next week and perhaps beyond. Additional snowfall during the 1 day period ending 4pm next Wednesday is predicted to be 1-2 ft over the Washington, Oregon, and California Cascades, along with the Klamath Mountains and much of the Sierra Nevada.
Details may certainly change as that period draws closer, as it is currently 6-7 days out, near the limit of accurate numerical weather prediction. But it puts the predicted 7.5-day snowfall totals (once again!) at roughly 7-14 ft (!!) over the west slopes and volcanic peaks of the Washington and Oregon Cascades, with about 5-12 ft in the Olympics and southwestern BC, and perhaps 3-5 ft in the California Cascades and northern Sierra Nevada, all of that on top of the 2-6 ft that have already fallen. Outstanding!
What about the longer term? A definite end to this storm cycle is not yet in sight. The extended GFS model out to 384 hours (16 days) shows additional storm systems throughout the 8-16 day period. This is the predicted 24-hour precip, click "Loop All" to see all the graphics (3 hour intervals up to 192 hours, 12 hour intervals beyond that):
GFS, North Pacific, 02/12/2014 18UTC, precip_p24
The Climate Prediction Center's 6-10 and 8-14 Day Outlooks also look promising, with a high likelihood for continued above normal precipitation at below normal temperatures in the Pacific Northwest, while the extreme cold in the eastern US looks to be over soon:
with an additional 4-8 ft of snow (or more) predicted over the next week for WA, OR, and southwest BC!
Another day later, and 2 more subsequent runs of the UW WRF-GFS model at 12-hour intervals continue to predict large snowfall amounts of 4-8 ft (and perhaps much more) over the next week for Washington, Oregon, and southwest BC, along with about 3-5 ft in northern California. This is in addition to 2-6 ft of snow which has already fallen over the past 6 days at most mountain sites from Bella Coola, BC, all the way south to Mammoth Mountain, a span of about 1100 miles as the crow flies (and well over 1500 miles by car). The predicted amounts for both precip and snowfall over the next week remain similar to those predicted during the last 3-4 days, a good sign of stability in the model's predictions, with a continuing increase in overall totals as further storm systems come into view this weekend and into next week. If these predictions verify and the storm cycle continues as expected for another week or more, this will end up solidly in the HUGE storm cycle category with 10-day snowfall totals exceeding 10 ft at many sites especially above 4000-5000 ft in the Washington and northern Oregon Cascades plus southwestern BC.
The first stage of this storm cycle, aimed primarily at the Sierra Nevada (an atmospheric river) and also at Oregon and southern Washington (frontal snowfall along the boundary between a modified Arctic air mass and warmer air to the south), began early on Thursday, February 6, and ended during the day Monday, February 10. The second stage of this storm cycle started early Monday morning and will extend throughout this week into the weekend, featuring a series of fronts and systems every 1-2 days in strong westerly and southwesterly flow over the north Pacific, aimed primarily at Oregon, Washington, and southwestern British Columbia. The first system of the second stage came ashore Monday morning, and the next much stronger system arrived in the same region on Tuesday afternoon, including another atmospheric river event aimed at Oregon, a few hundred miles farther north than the first atmospheric river aimed at the central Sierra Nevada. The water vapor satellite image from Wednesday morning (see www.nrlmry.navy.mil/sat-bin/epac_westcoast.cgi) shows the plume of moisture aimed at northern Oregon:
This atmospheric river is expected to stay in place for the next 3-4 days while slowly shifting southward, weakening slightly by Thursday afternoon and more significantly by Saturday afternoon before it finally fades away on Sunday. Compare these graphics with the same ones in Update #4 above generated 2 days earlier, things look very similar to earlier predictions with only slight changes in the position and strength of the atmospheric river, eventually shifting a couple hundred miles farther south into northern California, which will bring some more precipitation to that area over the weekend:
The NWS's GFS model and their Quantitative Precipitation Forecasts continue to show up to 8-14" of precip over the next week for the mountains of southwestern BC, Washington, Oregon, and northwestern California, with much smaller amounts of only 1-3" extending farther south into the northern Sierra. Here is total precipitation in inches predicted over the next 7 days through the afternoon of Wednesday, February 19:
As of Wednesday morning, February 12, another 6-28" of new snow has fallen over the previous 24 hours at higher elevations throughout the Washington and Oregon Cascades, Olympics, and southwestern BC as far north as Bella Coola. Snow levels rose overnight and early Wednesday to about 2000 ft near Bella Coola, 4000 ft near Whistler, 5000 ft in the North Cascades, 6000 ft from Snoqualmie Pass south to White Pass, and 7000 ft throughout the Oregon Cascades, but were already beginning to drop quickly by Wednesday mid-morning from north to south as the ill-defined trailing cold front of this storm system passed through. This time the snowfall jackpot was in southwestern BC, with a claimed 28" new at Mount Washington (4500 ft) on Vancouver Island (which will reopen Thursday after being closed for the past 2 weeks due to insufficient snowpack), over 18" new at the Squamish River BCRFC site (4550 ft, west of Whistler), 16" at Spuzzum Creek BCRFC site (3950 ft, east of Harrison Lake), and 14" Whistler Mountain (5400 ft). In Washington and Oregon, the largest amounts were over 12" at Buckinghorse SNOTEL in the Olympics, 13" at Mount Baker Ski Area (4200 ft), 12" atop Alpental, 9-13" at Mount Bachelor (6300 and 7300 ft), and 10" at Crater Lake Rim (7050 ft). Mount Hood (and also Saint Helens) received over 3" of precipitation with about 6-8" new snow at Timberline at 5900 ft, but snowfall amounts of 2-3 ft were likely above 7000 ft.
Throughout the Cascade Range, Olympics, and southwestern BC, snow totals thus far since the storm cycle began early on February 6 range from 2 ft at the Burnt Bridge Creek (4400 ft, east of Bella Coola) and Squamish River BCRFC sites , 1.5 ft at Whistler, 1 ft at Hurricane Ridge, 2 ft at Buckinghorse SNOTEL , 2.5 ft at Mount Baker, 2 ft in much of the North Cascades, 2.5 ft at Stevens Pass, 2 ft at Snoqualmie Pass (with 3.5 ft atop Alpental), 1 ft at Mission Ridge, 2 ft at Crystal, 2.5 ft at Mount Rainier Paradise, 3.5 ft at White Pass and Mount Hood (with perhaps 5 ft above 7000 ft), 2.5 ft at Santiam Pass, 4.5 ft on Mount Bachelor, 2 ft at Willamette Pass, 2.5-3 ft at Crater Lake, 1.5-2 ft on Mount Shasta, and roughly 2-4 ft on Lassen Peak (actual totals there are unknown due to a long-term outage at the 8250 ft Lake Helen telemetry site, plus the complete wintertime closure of the visitor center at the park's 6700 ft southwest entrance due to budget concerns, where daily snowfall measurements are normally taken).
The strong system Tuesday night also featured very high winds, with maximum gusts of over 100 mph at Mission Ridge, Crystal Mountain, White Pass, and Mt Hood Meadows (Top of Cascade Express), with winds over 90 mph atop Alpental and at Camp Muir.
[size=small]The Mountain comes out on Wednesday afternoon during a lull between systems, capped by a lenticular cloud revealing the strong westerly winds aloft.[/size]
There is another minor lull between systems during the day Wednesday in Washington (not much of a lull in Oregon), then the next somewhat cooler system arrives later Wednesday evening and overnight through Thursday. Another lull on Thursday afternoon and evening, then the next stronger system arrives by midnight and continues through Friday. Yet another system is in the pipeline for Saturday. Snowfall during the next 3 days through 4pm Saturday is predicted to be 3-5 ft over the west slopes and volcanic peaks of the Washington and northern Oregon Cascades, the Olympics, and southwestern BC, with perhaps up to 1 ft extending into the California Cascades on Saturday:
Higher resolution version of that, showing the Pacific Northwest and also zoomed in on Washington and Oregon:
Maximum snowfall amounts of 4-5 ft (marked by white inside yellow) are shown along the west slopes of the Olympics and the volcanic peaks of the Washington and Oregon Cascades. In Oregon, even Newberry Volcano and Yamsay Mountain (another large shield volcano east of Crater Lake, the highest volcano in the eastern Cascade chain at 8196 ft) are shown with 3-4 ft expected, shocking given that both are 30 miles east of the Cascade Crest and normally quite rain-shadowed! Some major volcanoes have been labeled on the last graphic for clarity.
This loop shows how the model predictions for snowfall during the 3-day period through 4pm Saturday have evolved between 7 subsequent runs (2 missing) over the last 5 days, the D(model)/D(t). Very consistent in the overall picture throughout, with snowfall amounts increasing and decreasing a bit, but no major changes except for a trend towards more snowfall in the California Cascades on the latest runs:
www.atmos.washington.edu/~ovens/wxloop.c...2+v2014021600///+-st
Additional snowfall during the subsequent 3 days ending 4pm next Tuesday is predicted to be another 3-6 ft over the west slopes and volcanic peaks of the Washington and Oregon Cascades, Olympics, and southwestern BC, with 2-3 ft now extending into the California Cascades, Trinity Alps, and northern Sierra Nevada. These systems over the weekend are also likely to feature somewhat lower snow levels than the systems thus far this week.
Beyond that point, it appears that this storm cycle is likely to continue to bring additional systems ashore every 1-2 days, producing continued precip and heavy snowfall into the middle of next week and perhaps beyond. Additional snowfall during the 1 day period ending 4pm next Wednesday is predicted to be 1-2 ft over the Washington, Oregon, and California Cascades, along with the Klamath Mountains and much of the Sierra Nevada.
Details may certainly change as that period draws closer, as it is currently 6-7 days out, near the limit of accurate numerical weather prediction. But it puts the predicted 7.5-day snowfall totals (once again!) at roughly 7-14 ft (!!) over the west slopes and volcanic peaks of the Washington and Oregon Cascades, with about 5-12 ft in the Olympics and southwestern BC, and perhaps 3-5 ft in the California Cascades and northern Sierra Nevada, all of that on top of the 2-6 ft that have already fallen. Outstanding!
What about the longer term? A definite end to this storm cycle is not yet in sight. The extended GFS model out to 384 hours (16 days) shows additional storm systems throughout the 8-16 day period. This is the predicted 24-hour precip, click "Loop All" to see all the graphics (3 hour intervals up to 192 hours, 12 hour intervals beyond that):
GFS, North Pacific, 02/12/2014 18UTC, precip_p24
The Climate Prediction Center's 6-10 and 8-14 Day Outlooks also look promising, with a high likelihood for continued above normal precipitation at below normal temperatures in the Pacific Northwest, while the extreme cold in the eastern US looks to be over soon:
Please Log in or Create an account to join the conversation.
- Amar Andalkar
- [andalkar]
-
Topic Author
- Offline
- Premium Member
-
Less
More
- Posts: 635
- Thank you received: 0
13 Feb 2014 07:13 #220345
by Amar Andalkar
Yeah, I've often lamented the 850 mb color scale, and why it was the same as the 700 mb -- which leaves the higher-res, zoomed-in 850 mb plots awash in a sea of similar-looking yellows and oranges much of the time under typical Northwest conditions. Since the color scale shifts by +27 °C from 300 mb to 500 mb, and by what appears to be roughly +12 to +21°C (with a slope change) going to 700 mb, I think another shift going to 850 mb would be appropriate. It appears that the 700 mb scale "works" the best of all those scales, because temps that are warm perceptually in the mountains look "warm" color-wise on the plot, and temps that are cold look "cold". The 850 mb scale falls short for the same reason, but fixing it may be as easy as a +9°C (or +10 °C) shift in scale. This is also the right amount of shift given the standard lapse rate of about 2 °C per 300 m, and the roughly 1500 m difference in normal 700 and 850 mb levels. There may be a better more complex fix than that, but the simple shift would help a lot.
Replied by Amar Andalkar on topic Re: Next major storm brings 4-6 ft snow Feb 6-14,2014!
I'll walk next door and ask him. I also nudged him on trying to find a better color scale for the 850mb temps, but he tossed that back to me as a project and I haven't gotten around to it. Just extending how far forward they're generated should be a trivial change, though. Cliff Mass keeps him pretty busy, so your e-mail probably just got buried under his to-do list. I also would like to keep the snow product around for a few extra months, I'll ask if we can keep it for June/Sept, at least.
The ensemble stuff is the way all weather forecasting will move in the future. It's an interesting research problem to figure out how to make all the data that comes out most useful/easily processed.
Yeah, I've often lamented the 850 mb color scale, and why it was the same as the 700 mb -- which leaves the higher-res, zoomed-in 850 mb plots awash in a sea of similar-looking yellows and oranges much of the time under typical Northwest conditions. Since the color scale shifts by +27 °C from 300 mb to 500 mb, and by what appears to be roughly +12 to +21°C (with a slope change) going to 700 mb, I think another shift going to 850 mb would be appropriate. It appears that the 700 mb scale "works" the best of all those scales, because temps that are warm perceptually in the mountains look "warm" color-wise on the plot, and temps that are cold look "cold". The 850 mb scale falls short for the same reason, but fixing it may be as easy as a +9°C (or +10 °C) shift in scale. This is also the right amount of shift given the standard lapse rate of about 2 °C per 300 m, and the roughly 1500 m difference in normal 700 and 850 mb levels. There may be a better more complex fix than that, but the simple shift would help a lot.
Please Log in or Create an account to join the conversation.
- andybrnr
- [andybrnr]
-
- Offline
- New Member
-
Less
More
- Posts: 25
- Thank you received: 0
13 Feb 2014 11:49 #220349
by andybrnr
Replied by andybrnr on topic Re: Next major storm brings 4-6 ft snow Feb 6-14,2014!
Just chatted with David, the snow products will now only be offline between June 30th and September 1st. The 700mb temps/winds/heights should be plotted out to 180 hours for the extended forecasts starting with the next run.
Please Log in or Create an account to join the conversation.
- Amar Andalkar
- [andalkar]
-
Topic Author
- Offline
- Premium Member
-
Less
More
- Posts: 635
- Thank you received: 0
13 Feb 2014 11:58 #220350
by Amar Andalkar
Replied by Amar Andalkar on topic Re: Next major storm brings 4-6 ft snow Feb 6-14,2014!
Excellent! Thanks.
Please Log in or Create an account to join the conversation.
- Amar Andalkar
- [andalkar]
-
Topic Author
- Offline
- Premium Member
-
Less
More
- Posts: 635
- Thank you received: 0
13 Feb 2014 13:12 - 18 Feb 2014 11:28 #219924
by Amar Andalkar
Replied by Amar Andalkar on topic Re: Next major storm brings 4-6 ft snow Feb 6-14,2014!
Update #7: 168 hours after initial post, 2-6 ft has already fallen in southwest BC, Washington, Oregon, and California,
with an additional 4-8 ft of snow (or more) predicted over the next week for WA, OR, and southwest BC!
Another day later, and 2 more subsequent runs of the UW WRF-GFS model at 12-hour intervals continue to predict large snowfall amounts of 4-8 ft (and perhaps much more) over the next week for Washington, Oregon, and southwest BC, along with about 3-5 ft in northern California. This is in addition to 2-6 ft of snow which has already fallen over the past 7 days at most mountain sites from Bella Coola, BC, all the way south to Mammoth Mountain, a span of about 1100 miles as the crow flies (and well over 1500 miles by car). The predicted amounts for both precip and snowfall over the next week remain similar to those predicted during the last 3-5 days, a good sign of stability in the model's predictions, with a continuing increase in overall totals as further storm systems come into view this weekend and into next week. If these predictions verify and the storm cycle continues as expected for another week, this will end up solidly in the HUGE storm cycle category with 10-day snowfall totals exceeding 10 ft at many sites especially above 4000-5000 ft in the Washington and northern Oregon Cascades plus southwestern BC.
The first stage of this storm cycle, aimed primarily at the Sierra Nevada (an atmospheric river) and also at Oregon and southern Washington (frontal snowfall along the boundary between a modified Arctic air mass and warmer air to the south), began early on Thursday, February 6, and ended during the day Monday, February 10. The second stage of this storm cycle started early Monday morning and will extend throughout this weekend into next week, featuring a series of fronts and systems every 1-2 days in strong westerly and southwesterly flow over the north Pacific, aimed primarily at Oregon, Washington, and southwestern British Columbia. The first system of the second stage came ashore Monday morning, and the next much stronger system arrived in the same region on Tuesday afternoon, including another atmospheric river event aimed at Oregon, a few hundred miles farther north than the first atmospheric river aimed at the central Sierra Nevada. This atmospheric river is expected to stay in place for another 2-3 days while slowly shifting southward, weakening slightly today and more significantly by Saturday afternoon as it eventually shifts a couple hundred miles farther south into northern California, which will bring some more precipitation to that area over the weekend, before it finally fades away on Sunday.
The NWS's GFS model and their Quantitative Precipitation Forecasts continue to show up to 8-16" of precip over the next week for the mountains of southwestern BC, Washington, Oregon, and northwestern California, with much smaller amounts of only 1-3" extending farther south into the northern Sierra. Here is total precipitation in inches predicted over the next 7 days through the afternoon of Thursday, February 20:

The fire hose of the jet stream (see Days 1-5 Jet Stream Analysis & Forecasts ) will be aimed directly into the Pacific Northwest the rest of this week and into the middle of next week, still peaking in intensity at almost 190 knots (about 220 mph) today. Here is the jet stream for 4pm Thursday afternoon:
By Sunday the jet stream pattern is expected to have evolved and shifted, now approaching directly from the west, and remain that way through Tuesday, February 18 -- a much better direction for large snowfall totals at much lower snow levels:

Following a minor lull between systems during the day Wednesday in Washington (not much of a lull in Oregon), the next slightly cooler system arrived later Wednesday evening and overnight through Thursday. The system Wednesday night again featured very high winds, with maximum gusts of over 100 mph at Mission Ridge, White Pass, and Mt Hood Meadows (Top of Cascade Express), and over 90 mph atop Alpental.
As of Thursday morning, February 13, another 3-12" of new snow has fallen over the previous 24 hours at higher elevations throughout the Washington and northern Oregon Cascades, Olympics, and southwestern BC extending north past Whistler. Snow levels overnight into early Thursday were about 3000 ft near Whistler, 4000 ft in the North Cascades, 4500 ft near Stevens and Snoqualmie Passes, 5000 ft from Crystal and Mount Rainier south to White Pass, 6000 ft in the northern Oregon Cascades, and 7000 ft in the southern Oregon Cascades, but were already beginning to drop quickly by Thursday morning. This time the largest snowfall amounts were about 12" new at Brown Top SNOTEL (North Cascades) and Washington Pass, 10" in Mazama, about 9-12" at the Squamish River (4550 ft, west of Whistler), Spuzzum Creek (3950 ft, east of Harrison Lake), and Chilliwack River (5300 ft in the BC Cascades just north of the US border) BCRFC sites, 9" at Mount Washington (4500 ft) on Vancouver Island (which reopens today after being closed for the past 2 weeks due to insufficient snowpack), over 10" atop Alpental, and 9-11" at Mount Bachelor (6300 and 7300 ft). Mount Hood received over 2" of precipitation with about 3" new snow at Timberline at 5900 ft, but snowfall amounts of 1-1.5 ft were likely above 6500 ft.
Throughout the Cascade Range, Olympics, and southwestern BC, snow totals thus far since the storm cycle began early on February 6 range from 2 ft at the Burnt Bridge Creek BCRFC site (4400 ft, east of Bella Coola), 3 ft at Squamish River , 2 ft at Whistler, 3.5 ft at Spuzzum Creek , 3 ft at Mount Washington on Vancouver Island, 1.5 ft at Hurricane Ridge and 2.5 ft at Buckinghorse SNOTEL in the Olympics, 3 ft at Mount Baker, 3.5 ft at Brown Top SNOTEL and Washington Pass, 2-3 ft in much of the North Cascades, 3 ft at Stevens Pass, 2 ft at Snoqualmie Pass (with 4 ft atop Alpental), 1.5 ft at Mission Ridge, 2-2.5 ft at Crystal, 3 ft at Mount Rainier Paradise, 3.5 ft at White Pass, 4 ft at Mount Hood (with perhaps 6 ft above 7000 ft), 2.5 ft at Santiam Pass, 5-5.5 ft on Mount Bachelor, 3 ft at Willamette Pass, 2.5-3 ft at Crater Lake, 1.5-2.5 ft on Mount Shasta, and roughly 2-4 ft on Lassen Peak (actual totals there are unknown due to a long-term outage at the 8250 ft Lake Helen telemetry site, plus the complete wintertime closure of the visitor center at the park's 6700 ft southwest entrance due to budget concerns, where daily snowfall measurements are normally taken). In the Sierra Nevada, snowfall totals as of the end of the first stage of this storm cycle on February 10 were about 5-7 ft at many ski area upper stations near Lake Tahoe above 8000 ft, with more like 1-2 ft total at the 6000 ft level. Areas farther south such as Yosemite and Mammoth received much less snowfall, only about 2-3 ft even at 9000 ft, and only 2" total at 9000 ft on June Mountain located just north of Mammoth in the rain shadow of the Sierra Crest. See the table in the next post below for more complete snow and precip totals at over 180 measurement sites.
[size=small]The Mountain comes out AGAIN on Thursday afternoon during a lull between systems, but no lenticular this time unlike yesterday.[/size]
There is another minor lull between systems on Thursday afternoon and evening, then the next stronger system arrives by midnight and continues through Friday. Yet more systems are in the pipeline for Saturday afternoon and Sunday afternoon. The current stage of this storm cycle is also producing heavy snowfall in southeast Alaska, today and again over the weekend, all due to various low-pressure systems spawned from the same parent low in the Gulf of Alaska which has been associated with this entire storm cycle. Here is a wider view from the 36km resolution, showing several feet of snowfall in southeast Alaska through Sunday:
[size=small](This is actually model snow precip and not snowfall, but that distinction is unimportant for this image.)[/size]
Snowfall during the next 3 days through 4pm Sunday is predicted to be 3-5 ft over the west slopes and volcanic peaks of the Washington and northern Oregon Cascades, the Olympics, and southwestern BC, with perhaps up to 1 ft extending into the California Cascades and northern Sierra Nevada on Saturday and Sunday:
Higher resolution version of that, showing the Pacific Northwest and also zoomed in on Washington and Oregon:
Maximum snowfall amounts of 4-5 ft (marked by white inside yellow) are shown along the west slopes of the Olympics and the volcanic peaks of the Washington and Oregon Cascades. In Oregon, even Newberry Volcano and Yamsay Mountain (another large shield volcano east of Crater Lake, the highest volcano in the eastern Cascade chain at 8196 ft) are shown with 3-4 ft expected, shocking given that both are 30 miles east of the Cascade Crest and normally quite rain-shadowed! Some major volcanoes have been labeled on the last graphic for clarity.
This loop shows how the model predictions for snowfall during the 3-day period through 4pm Sunday have evolved between 8 subsequent runs over the last 4 days, the D(model)/D(t). Very consistent in the overall picture throughout, with snowfall amounts increasing and decreasing a bit, but no major changes except for a trend towards more snowfall in the California Cascades on the latest runs:
www.atmos.washington.edu/~ovens/wxloop.c...2+v2014021700///+-st
Additional snowfall during the subsequent 3 days ending 4pm next Wednesday is predicted to be another 3-6 ft over the west slopes and volcanic peaks of the Washington and Oregon Cascades plus the Olympics, with 2-3 ft extending north into southwestern BC and south into the California Cascades and Trinity Alps. These systems from Sunday through early next week are also likely to feature somewhat lower snow levels than the systems thus far this week.
Beyond that point, it appears that this storm cycle is likely to continue to bring additional systems ashore every 1-2 days through next Thursday or Friday. Additional snowfall during the 1 day period ending 4pm next Thursday is predicted to be 1-2 ft over the Washington, Oregon, and California Cascades, along with the Klamath Mountains and much of the Sierra Nevada.
Details may certainly change as that period draws closer, as it is currently 6-7 days out, near the limit of accurate numerical weather prediction. But it puts the predicted 7.5-day snowfall totals (once again!) at roughly 7-14 ft (!!) over the west slopes and volcanic peaks of the Washington and Oregon Cascades, with about 5-10 ft in the Olympics, 4-8 ft in southwestern BC, and perhaps 3-5 ft in the California Cascades and northern Sierra Nevada, all of that on top of the 2-6 ft that have already fallen. Tremendous!
What about the longer term? A definite end to this storm cycle is not yet certain, but it appears likely that the parent low in the Gulf of Alaska may fade away by next Thursday, replaced by a ridge of high pressure building far out there over the North Pacific. That would bring the daily parade of storm systems to an end along with the heavy snowfall. It's easiest to see this process in the 36 km, 500 mb temp-winds-heights loop (www.atmos.washington.edu/~ovens/wxloop.c..._500t+2014021312///3). These three frames from that loop show the current upper low in the Gulf of Alaska, a still-active and strong low 4 days from now on Monday, and then the low completely vanished 7 days from now next Thursday, replaced by an upper-level ridge:
But unlike after the first major storm cycle of the 2013-14 season (January 7-14, 2014) , there are no indications of a sustained period of high pressure and fair weather over the entire West Coast after this much-larger storm cycle. The extended GFS model out to 384 hours (16 days) shows additional weaker storm systems throughout the 8-16 day period. This is the predicted 24-hour precip throughout that period, click "Loop All" to see all the graphics (3 hour intervals up to 192 hours, 12 hour intervals beyond that):
GFS, North Pacific, 02/13/2014 12UTC, precip_p24
Primary data sources for the table below (numerous sites):
USDA NRCS SNOTEL (easily view data: SNOTEL Data Viewer Script )
Northwest Avalanche Center (easily view data: NWAC Data Viewer Script )
California Cooperative Snow Surveys
British Columbia River Forecast Centre (easily view data: British Columbia Snow Telemetry )
National Climatic Data Center
Environment Canada Climate Data
Supplementary data sources (one or a few sites):
Whistler Blackcomb Ski Resort
Mount Washington Alpine Resort
Hoodoo Ski Resort
Mount Bachelor Ski Resort
Crater Lake National Park
Mount Shasta Avalanche Center
Mammoth Mountain Ski Area
with an additional 4-8 ft of snow (or more) predicted over the next week for WA, OR, and southwest BC!
Another day later, and 2 more subsequent runs of the UW WRF-GFS model at 12-hour intervals continue to predict large snowfall amounts of 4-8 ft (and perhaps much more) over the next week for Washington, Oregon, and southwest BC, along with about 3-5 ft in northern California. This is in addition to 2-6 ft of snow which has already fallen over the past 7 days at most mountain sites from Bella Coola, BC, all the way south to Mammoth Mountain, a span of about 1100 miles as the crow flies (and well over 1500 miles by car). The predicted amounts for both precip and snowfall over the next week remain similar to those predicted during the last 3-5 days, a good sign of stability in the model's predictions, with a continuing increase in overall totals as further storm systems come into view this weekend and into next week. If these predictions verify and the storm cycle continues as expected for another week, this will end up solidly in the HUGE storm cycle category with 10-day snowfall totals exceeding 10 ft at many sites especially above 4000-5000 ft in the Washington and northern Oregon Cascades plus southwestern BC.
The first stage of this storm cycle, aimed primarily at the Sierra Nevada (an atmospheric river) and also at Oregon and southern Washington (frontal snowfall along the boundary between a modified Arctic air mass and warmer air to the south), began early on Thursday, February 6, and ended during the day Monday, February 10. The second stage of this storm cycle started early Monday morning and will extend throughout this weekend into next week, featuring a series of fronts and systems every 1-2 days in strong westerly and southwesterly flow over the north Pacific, aimed primarily at Oregon, Washington, and southwestern British Columbia. The first system of the second stage came ashore Monday morning, and the next much stronger system arrived in the same region on Tuesday afternoon, including another atmospheric river event aimed at Oregon, a few hundred miles farther north than the first atmospheric river aimed at the central Sierra Nevada. This atmospheric river is expected to stay in place for another 2-3 days while slowly shifting southward, weakening slightly today and more significantly by Saturday afternoon as it eventually shifts a couple hundred miles farther south into northern California, which will bring some more precipitation to that area over the weekend, before it finally fades away on Sunday.
The NWS's GFS model and their Quantitative Precipitation Forecasts continue to show up to 8-16" of precip over the next week for the mountains of southwestern BC, Washington, Oregon, and northwestern California, with much smaller amounts of only 1-3" extending farther south into the northern Sierra. Here is total precipitation in inches predicted over the next 7 days through the afternoon of Thursday, February 20:
The fire hose of the jet stream (see Days 1-5 Jet Stream Analysis & Forecasts ) will be aimed directly into the Pacific Northwest the rest of this week and into the middle of next week, still peaking in intensity at almost 190 knots (about 220 mph) today. Here is the jet stream for 4pm Thursday afternoon:
By Sunday the jet stream pattern is expected to have evolved and shifted, now approaching directly from the west, and remain that way through Tuesday, February 18 -- a much better direction for large snowfall totals at much lower snow levels:
Following a minor lull between systems during the day Wednesday in Washington (not much of a lull in Oregon), the next slightly cooler system arrived later Wednesday evening and overnight through Thursday. The system Wednesday night again featured very high winds, with maximum gusts of over 100 mph at Mission Ridge, White Pass, and Mt Hood Meadows (Top of Cascade Express), and over 90 mph atop Alpental.
As of Thursday morning, February 13, another 3-12" of new snow has fallen over the previous 24 hours at higher elevations throughout the Washington and northern Oregon Cascades, Olympics, and southwestern BC extending north past Whistler. Snow levels overnight into early Thursday were about 3000 ft near Whistler, 4000 ft in the North Cascades, 4500 ft near Stevens and Snoqualmie Passes, 5000 ft from Crystal and Mount Rainier south to White Pass, 6000 ft in the northern Oregon Cascades, and 7000 ft in the southern Oregon Cascades, but were already beginning to drop quickly by Thursday morning. This time the largest snowfall amounts were about 12" new at Brown Top SNOTEL (North Cascades) and Washington Pass, 10" in Mazama, about 9-12" at the Squamish River (4550 ft, west of Whistler), Spuzzum Creek (3950 ft, east of Harrison Lake), and Chilliwack River (5300 ft in the BC Cascades just north of the US border) BCRFC sites, 9" at Mount Washington (4500 ft) on Vancouver Island (which reopens today after being closed for the past 2 weeks due to insufficient snowpack), over 10" atop Alpental, and 9-11" at Mount Bachelor (6300 and 7300 ft). Mount Hood received over 2" of precipitation with about 3" new snow at Timberline at 5900 ft, but snowfall amounts of 1-1.5 ft were likely above 6500 ft.
Throughout the Cascade Range, Olympics, and southwestern BC, snow totals thus far since the storm cycle began early on February 6 range from 2 ft at the Burnt Bridge Creek BCRFC site (4400 ft, east of Bella Coola), 3 ft at Squamish River , 2 ft at Whistler, 3.5 ft at Spuzzum Creek , 3 ft at Mount Washington on Vancouver Island, 1.5 ft at Hurricane Ridge and 2.5 ft at Buckinghorse SNOTEL in the Olympics, 3 ft at Mount Baker, 3.5 ft at Brown Top SNOTEL and Washington Pass, 2-3 ft in much of the North Cascades, 3 ft at Stevens Pass, 2 ft at Snoqualmie Pass (with 4 ft atop Alpental), 1.5 ft at Mission Ridge, 2-2.5 ft at Crystal, 3 ft at Mount Rainier Paradise, 3.5 ft at White Pass, 4 ft at Mount Hood (with perhaps 6 ft above 7000 ft), 2.5 ft at Santiam Pass, 5-5.5 ft on Mount Bachelor, 3 ft at Willamette Pass, 2.5-3 ft at Crater Lake, 1.5-2.5 ft on Mount Shasta, and roughly 2-4 ft on Lassen Peak (actual totals there are unknown due to a long-term outage at the 8250 ft Lake Helen telemetry site, plus the complete wintertime closure of the visitor center at the park's 6700 ft southwest entrance due to budget concerns, where daily snowfall measurements are normally taken). In the Sierra Nevada, snowfall totals as of the end of the first stage of this storm cycle on February 10 were about 5-7 ft at many ski area upper stations near Lake Tahoe above 8000 ft, with more like 1-2 ft total at the 6000 ft level. Areas farther south such as Yosemite and Mammoth received much less snowfall, only about 2-3 ft even at 9000 ft, and only 2" total at 9000 ft on June Mountain located just north of Mammoth in the rain shadow of the Sierra Crest. See the table in the next post below for more complete snow and precip totals at over 180 measurement sites.
[size=small]The Mountain comes out AGAIN on Thursday afternoon during a lull between systems, but no lenticular this time unlike yesterday.[/size]
There is another minor lull between systems on Thursday afternoon and evening, then the next stronger system arrives by midnight and continues through Friday. Yet more systems are in the pipeline for Saturday afternoon and Sunday afternoon. The current stage of this storm cycle is also producing heavy snowfall in southeast Alaska, today and again over the weekend, all due to various low-pressure systems spawned from the same parent low in the Gulf of Alaska which has been associated with this entire storm cycle. Here is a wider view from the 36km resolution, showing several feet of snowfall in southeast Alaska through Sunday:
[size=small](This is actually model snow precip and not snowfall, but that distinction is unimportant for this image.)[/size]
Snowfall during the next 3 days through 4pm Sunday is predicted to be 3-5 ft over the west slopes and volcanic peaks of the Washington and northern Oregon Cascades, the Olympics, and southwestern BC, with perhaps up to 1 ft extending into the California Cascades and northern Sierra Nevada on Saturday and Sunday:
Higher resolution version of that, showing the Pacific Northwest and also zoomed in on Washington and Oregon:
Maximum snowfall amounts of 4-5 ft (marked by white inside yellow) are shown along the west slopes of the Olympics and the volcanic peaks of the Washington and Oregon Cascades. In Oregon, even Newberry Volcano and Yamsay Mountain (another large shield volcano east of Crater Lake, the highest volcano in the eastern Cascade chain at 8196 ft) are shown with 3-4 ft expected, shocking given that both are 30 miles east of the Cascade Crest and normally quite rain-shadowed! Some major volcanoes have been labeled on the last graphic for clarity.
This loop shows how the model predictions for snowfall during the 3-day period through 4pm Sunday have evolved between 8 subsequent runs over the last 4 days, the D(model)/D(t). Very consistent in the overall picture throughout, with snowfall amounts increasing and decreasing a bit, but no major changes except for a trend towards more snowfall in the California Cascades on the latest runs:
www.atmos.washington.edu/~ovens/wxloop.c...2+v2014021700///+-st
Additional snowfall during the subsequent 3 days ending 4pm next Wednesday is predicted to be another 3-6 ft over the west slopes and volcanic peaks of the Washington and Oregon Cascades plus the Olympics, with 2-3 ft extending north into southwestern BC and south into the California Cascades and Trinity Alps. These systems from Sunday through early next week are also likely to feature somewhat lower snow levels than the systems thus far this week.
Beyond that point, it appears that this storm cycle is likely to continue to bring additional systems ashore every 1-2 days through next Thursday or Friday. Additional snowfall during the 1 day period ending 4pm next Thursday is predicted to be 1-2 ft over the Washington, Oregon, and California Cascades, along with the Klamath Mountains and much of the Sierra Nevada.
Details may certainly change as that period draws closer, as it is currently 6-7 days out, near the limit of accurate numerical weather prediction. But it puts the predicted 7.5-day snowfall totals (once again!) at roughly 7-14 ft (!!) over the west slopes and volcanic peaks of the Washington and Oregon Cascades, with about 5-10 ft in the Olympics, 4-8 ft in southwestern BC, and perhaps 3-5 ft in the California Cascades and northern Sierra Nevada, all of that on top of the 2-6 ft that have already fallen. Tremendous!
What about the longer term? A definite end to this storm cycle is not yet certain, but it appears likely that the parent low in the Gulf of Alaska may fade away by next Thursday, replaced by a ridge of high pressure building far out there over the North Pacific. That would bring the daily parade of storm systems to an end along with the heavy snowfall. It's easiest to see this process in the 36 km, 500 mb temp-winds-heights loop (www.atmos.washington.edu/~ovens/wxloop.c..._500t+2014021312///3). These three frames from that loop show the current upper low in the Gulf of Alaska, a still-active and strong low 4 days from now on Monday, and then the low completely vanished 7 days from now next Thursday, replaced by an upper-level ridge:
But unlike after the first major storm cycle of the 2013-14 season (January 7-14, 2014) , there are no indications of a sustained period of high pressure and fair weather over the entire West Coast after this much-larger storm cycle. The extended GFS model out to 384 hours (16 days) shows additional weaker storm systems throughout the 8-16 day period. This is the predicted 24-hour precip throughout that period, click "Loop All" to see all the graphics (3 hour intervals up to 192 hours, 12 hour intervals beyond that):
GFS, North Pacific, 02/13/2014 12UTC, precip_p24
Primary data sources for the table below (numerous sites):
USDA NRCS SNOTEL (easily view data: SNOTEL Data Viewer Script )
Northwest Avalanche Center (easily view data: NWAC Data Viewer Script )
California Cooperative Snow Surveys
British Columbia River Forecast Centre (easily view data: British Columbia Snow Telemetry )
National Climatic Data Center
Environment Canada Climate Data
Supplementary data sources (one or a few sites):
Whistler Blackcomb Ski Resort
Mount Washington Alpine Resort
Hoodoo Ski Resort
Mount Bachelor Ski Resort
Crater Lake National Park
Mount Shasta Avalanche Center
Mammoth Mountain Ski Area
Please Log in or Create an account to join the conversation.
- Amar Andalkar
- [andalkar]
-
Topic Author
- Offline
- Premium Member
-
Less
More
- Posts: 635
- Thank you received: 0
13 Feb 2014 18:53 - 18 Feb 2014 13:59 #220357
by Amar Andalkar
Replied by Amar Andalkar on topic Re: Next major storm brings 4-6 ft snow Feb 6-14,2014!
Table of total snowfall and precip, February 6-13, 2014:
This table shows the total snowfall and precip over the 7 day period from February 6 through Thursday afternoon, February 13, along with the increase in snowdepth from February 6 up to the maximum depth reached during this storm cycle thus far (most maxima occurred on February 8, 9, or 10 in CA and OR, but February 12 or 13 farther north). Some amounts are estimated and approximate, including all snowfall totals at SNOTEL, BCRFC, and CCSS sites (they have only a total snowdepth sensor, not a 24-hour snowfall sensor like most NWAC sites).
Increase in
Total Snowdepth Total
Measurement Site Elevation Snowfall Feb6 >>> Max Precip Notes
==== British Columbia ====
---- Coast Mountains
Burnt Bridge Creek BCRFC 4360 ft 2 ft 55" >>> 75" 2" (way north, E of Bella Coola)
Tenquille Lake BCRFC 5480 ft 1.5 ft 53" >>> 67" 1.5" (N of Whistler, all snow)
Pemberton Airport 670 ft 1 ft 2" >>> 14" 1.2"
Whistler Village 2200 ft 1.5 ft 5" >>> 21" 1.5" (incomplete data)
Blackcomb Sliding Center 3100 ft 1.5 ft 16" >>> 31" 1.5"
Whistler Mountain 5400 ft 2 ft 50" >>> 70" --
Callaghan Valley 2900 ft 2.5 ft 21" >>> 48" 5" (W of Whistler)
Squamish River BCRFC 4550 ft 3 ft 57" >>> 85" 3.5" (W of Whistler, all snow)
Spuzzum Creek BCRFC 3930 ft 3.5 ft 50" >>> 83" 4" (E of Harrison Lake)
BC Cascades
Chilliwack River BCRFC 5320 ft 4 ft 97" >>> 124" 6"?? (NE of Mt Baker, all snow)
Hope Slide 2260 ft 1 ft 4" >>> 9" 2" (on Hwy 3, SE of Hope)
Blackwall Peak BCRFC 6350 ft 3 ft 54" >>> 77" 3" (Manning Park, all snow)
---- Vancouver Island ----
Mount Washington 4460 ft 3 ft 24" >>> 48" -- (W of Courtenay)
Jump Creek BCRFC 3720 ft 3 ft 14" >>> 33" 4.5" (N of Cowichan Lake)
======= Washington =======
--- Olympic Mountains ----
Hurricane Ridge 5250 ft 1.5 ft 31" >>> 44" 2"
Waterhole SNOTEL 5010 ft 2 ft 31" >>> 49" 3" (N side of Olympics)
Buckinghorse SNOTEL 4870 ft 3 ft 29" >>> 53" 6" (central Olympics)
Mount Crag SNOTEL 3960 ft 1.5 ft 13" >>> 27" 2.5" (E side of Olympics)
Cascade Range
Mt Baker, MF Nooksack SNOTEL 4970 ft 2 ft 78" >>> 89" 3.5" (NW side of Mt Baker)
Mt Baker Ski Area 4200 ft 3 ft 80" >>> 104" 4" (snowdepth flaky +/- 5")
Mt Baker, Marten Ridge SNOTEL 3520 ft 3 ft 54" >>> 75" 5" (E side of Mt Baker)
Mt Baker, Elbow Lake SNOTEL 3040 ft 2 ft 31" >>> 42" 5" (SW side of Mt Baker)
Brown Top SNOTEL 5830 ft 3.5 ft 79" >>> 110" 4" (E of Mox Peaks, all snow)
Beaver Pass SNOTEL 3630 ft 3 ft 40" >>> 65" 4"
Thunder Basin SNOTEL 4320 ft 2 ft 39" >>> 55" 3.5" (N of Mt Buckner)
Park Creek Ridge SNOTEL 4600 ft 3.5 ft 46" >>> 73" 5" (SE ridge of Mt Buckner)
Swamp Creek SNOTEL 3930 ft 2 ft 38" >>> 55" 3" (Hwy 20, W of Rainy Pass)
Rainy Pass SNOTEL 4890 ft 3.5 ft 44" >>> 74" 4" (almost all snow)
Washington Pass 5450 ft 3.5 ft 49" >>> 79" -- (all snow)
Harts Pass SNOTEL 6500 ft 3 ft 57" >>> 81" 3" (all snow)
Mazama 2200 ft 2.5 ft 10" >>> 31" 2"
Stehekin 1250 ft 2 ft 4" >>> 20" 3"
Holden Village 3220 ft 2.5 ft 20" >>> 39" 3"
Lyman Lake SNOTEL 5980 ft 3 ft 76" >>> 99" 3" (almost all snow)
Trinity SNOTEL 2930 ft 3.5 ft 38" >>> 62" 5"
Alpine Meadows SNOTEL 3500 ft 1 ft 46" >>> 53" 4" (Tolt River headwaters)
Stevens Pass, Skyline 5250 ft 3 ft 82" >>> 98" 5" (precip from 4370 ft)
Stevens Pass, Grace Lakes 4800 ft 3 ft 85" >>> 107" --
Stevens Pass NWAC 3950 ft 3 ft 59" >>> 76" 4"
Stevens Pass SNOTEL 3950 ft 3 ft 62" >>> 79" 4.5"
Berne Snow Camp 2700 ft 1.5 ft 13" >>> 27" 3.5"
Lake Wenatchee 1930 ft 1.5 ft 7" >>> 21" 2.5"
Leavenworth 1130 ft 1.5 ft 4" >>> 16" 2"
Sasse Ridge SNOTEL 4340 ft 3 ft 49" >>> 67" 4.5" (E of Salmon La Sac Rd)
Blewett Pass SNOTEL 4240 ft 1.5 ft 21" >>> 32" 3" (near old Blewett Pass)
Blewett Pass NWAC 4100 ft 1 ft 13" >>> 21" 1"xx (precip gage not heating)
Grouse Camp SNOTEL 5390 ft 1.5 ft 28" >>> 41" 2.5" (between Blewett & Mission)
Mission Ridge 5160 ft 1.5 ft 22" >>> 35" 2"
Top of Alpental 5470 ft 4 ft 107" >>> 127" -- (snowdepth may be suspect?)
Alpental Base 3100 ft 2 ft 51" >>> 68" 6"
Snoqualmie Pass 3000 ft 2 ft 42" >>> 60" 6"
Stampede Pass SNOTEL 3850 ft 2 ft 37" >>> 52" 6"
Corral Pass SNOTEL 5800 ft 2 ft 50" >>> 63" 3.5" (N of Crystal Mtn)
Crystal Mtn, Green Valley 6230 ft 2.5 ft 66" >>> 83" --
Crystal Mtn Base 4570 ft 2 ft 26" >>> 39" 2.5"
Morse Lake SNOTEL 5400 ft 3 ft 51" >>> 76" 4.5" (just S of Crystal Mtn)
Cayuse Pass SNOTEL 5240 ft 2.5 ft 55" >>> 76" 4" (on SR 410 above Cayuse Pass)
Mt Rainier, Sunrise 6400 ft 2 ft 43" >>> 56" --
Mt Rainier, Paradise 5400 ft 3 ft 99" >>> 117" 3.5"
Mt Rainier, Paradise SNOTEL 5130 ft 3 ft 90" >>> 109" 5" (SW of Paradise)
Mt Rainier, Longmire 2700 ft 0.7 ft 6" >>> 12" 1"
Bumping Ridge SNOTEL 4610 ft 2.5 ft 34" >>> 51" 3.5" (SE of Chinook Pass)
White Pass Ski Area (top) 5800 ft 3 ft 85" >>> 105" 4"
Pigtail Peak SNOTEL 5800 ft 3 ft 84" >>> 104" 5" (top of White Pass Ski Area)
White Pass E.S. SNOTEL 4440 ft 2 ft 28" >>> 42" 4"
Green Lake SNOTEL 5920 ft 2.5 ft 39" >>> 55" 3" (E of Goat Rocks)
Lost Horse SNOTEL 5120 ft 2 ft 16" >>> 32" 2.5" (NE of Mt Adams)
Mt Adams, Potato Hill SNOTEL 4510 ft 2 ft 41" >>> 53" 4" (N side of Mt Adams)
Mt Adams RS, Trout Lake 1950 ft 1.5 ft 2" >>> 13" 3" (incomplete data)
Surprise Lakes SNOTEL 4290 ft 3 ft 43" >>> 61" 6" (Indian Heaven, SW of Adams)
Mt St Helens, Spirit Lake 3520 ft 0.5 ft 7" >>> 9" 3.5" (windswept & rain-shadowed)
Mt St Helens, Swift Creek 4440 ft 3 ft 40" >>> 55" 6" (S side of Mt St Helens)
Mt St Helens, Sheep Canyon 3990 ft 2 ft 31" >>> 40" 6" (W side of Mt St Helens)
Mt St Helens, June Lake 3440 ft 2 ft 30" >>> 41" 7" (SE side of Mt St Helens)
Indian Rock SNOTEL 5360 ft 2.5 ft 17" >>> 34" 5" (W of Satus Pass)
Satus Pass SNOTEL 3960 ft 1.5 ft 11" >>> 24" 3" (at former ski area site)
========= Oregon =========
Cascade Range
Blazed Alder SNOTEL 3650 ft 2 ft 29" >>> 40" 8.5" (NW of Mt Hood)
Mt Hood, Red Hill SNOTEL 4410 ft 3 ft 39" >>> 59" 9" (N side of Mt Hood)
Mt Hood, Timberline Lodge 5880 ft 4 ft 76" >>> 97" 11"
Mt Hood, Test Site SNOTEL 5370 ft 3 ft 67" >>> 85" 8" (just S of Timberline)
Mt Hood, Meadows Ski Area 5380 ft 3.5 ft 58" >>> 81" 10"
Mt Hood, Government Camp 3980 ft data not yet received at NCDC (S side of Mt Hood)
Mt Hood Ski Bowl (prec 3660) 5010 ft 2.5 ft 28" >>> 46" 7" (snowdepth flaky +/- 5")
Mud Ridge SNOTEL 4070 ft 2 ft 26" >>> 41" 6" (S of Mt Hood)
Hogg Pass SNOTEL 4790 ft 3 ft 19" >>> 42" 6" (at Santiam Pass)
Hoodoo Ski Area 5010 ft 3 ft 26" >>> 51" --
Sisters 3180 ft 1.5 ft 7" >>> 18" 3" (incomplete data)
Bear Grass SNOTEL 4720 ft 3 ft 33" >>> 58" 10" (W of Mt Washington)
McKenzie SNOTEL 4770 ft 3 ft 40" >>> 67" 11.5" (near Obsidian Trailhead)
Three Creeks Meadow SNOTEL 5690 ft 3 ft 18" >>> 41" 8" (E of Three Sisters)
Mt Bachelor, Mid-Mountain 7300 ft 5.5 ft 74" >>> 120" -- (top of Sunrise Express)
Mt Bachelor, West Village 6300 ft 5 ft 64" >>> 91" --
Irish Taylor SNOTEL 5540 ft 3 ft 41" >>> 66" 6.5" (SW of Mt Bachelor)
Cascade Summit SNOTEL 5100 ft 3 ft 32" >>> 54" 7.5" (just S of Willamette Pass)
New Crescent Lake SNOTEL 4910 ft 2.5 ft 9" >>> 26" 7" (E of Diamond Peak)
Diamond Peak, Summit Lake 5610 ft 3 ft 27" >>> 52" 5" (S side of Diamond Peak)
Diamond Lake SNOTEL 5280 ft 1.5 ft 4" >>> 12" 7" (extreme rain-shadowed site)
Silver Creek SNOTEL 5740 ft 1.5 ft 4" >>> 18" 3.5" (NE flank of Yamsay Mtn)
Crater Lake, Rim 7050 ft 3 ft 35" >>> 61" -- (S rim of caldera)
Crater Lake, Park HQ 6470 ft 2.5 ft 16" >>> 41" -- (S of caldera rim)
Crater Lake, Lagoon 6370 ft ? ft 30" >>> ??" 5" (near Park HQ)
Crater Lake, Annie Springs 6000 ft 2.5 ft 19" >>> 38" 6.5" (near S entrance of Park)
Sevenmile Marsh SNOTEL 5700 ft 2.5 ft 13" >>> 29" 7.5" (S of Crater Lake)
Pelican Butte, Cold Springs 5940 ft 2 ft 16" >>> 27" 6" (NW side of Pelican Butte)
Mt McLoughlin, Fourmile Lake 5970 ft 2 ft 13" >>> 25" 6" (E side of Mt McLoughlin)
Mt McLoughlin, Billie Creek 5280 ft 1.5 ft 15" >>> 22" 4.5" (SE side of Mt McLoughlin)
Mt McLoughlin, Fish Lake 4660 ft 0.5 ft 7" >>> 10" 3" (SW side of Mt McLoughlin)
Swan Lake Mtn SNOTEL 6830 ft 1.5 ft 8" >>> 16" 3.5" (NE of Klamath Falls)
--- Siskiyou Mountains ---
Big Red Mountain SNOTEL 6050 ft 0.5 ft 2" >>> 7" 3" (SW of Ashland)
======= California =======
Cascade Range
Medicine Lake 6700 ft 1.5 ft 0" >>> 13" 3" (in Med Lake Volcano caldera)
Mt Shasta, Old Ski Bowl 7600 ft 2.5 ft 4" >>> 26" 3" (S side of Mt Shasta)
Mt Shasta, Sand Flat 6750 ft 1.5 ft 2" >>> 16" 3" (SW side of Mt Shasta)
Stouts Meadow (Grizzly Peak) 5400 ft 2 ft 4" >>> 22" 8.5" (SE of Mt Shasta and McCloud)
Snow Mountain 5950 ft 1.5 ft 0" >>> 10" 9" (between Shasta and Lassen)
Blacks Mountain 7050 ft 1.5 ft 0" >>> 10" 2.5" (well NE of Lassen Peak)
Lassen Peak, Lake Helen 8250 ft data outage, depth 12" on Jan28 (SW side of Lassen Peak)
Lassen, Harkness Flat 6200 ft 1.5 ft 0" >>> 16" -- (well E of Lassen Peak)
Humbug 6500 ft 1 ft 0" >>> 8" 6" (SW of Lake Almanor)
--- Klamath Mountains ----
Mt Eddy, NE side 6510 ft 1 ft 0" >>> 10" -- (W of Shasta across I-5)
Mt Eddy, Peterson Flat 7150 ft 2 ft 0" >>> 17" 3.5" (SW side of Mt Eddy)
Scott Mountain 5900 ft 1 ft 0" >>> 6" 4" (W of Mt Eddy)
Mumbo Basin 5650 ft 2 ft 0" >>> 14" 4" (S of Mt Eddy)
Big Flat 5100 ft 1 ft 0" >>> 7" 3.5" (NW of Trinity Lake)
Red Rock Mountain 6700 ft 2 ft 2" >>> 19" -- (NW of Trinity Lake)
Shimmy Lake 6400 ft 2 ft 0" >>> 15" -- (NW of Trinity Lake)
Bonanza King 6450 ft 2 ft 0" >>> 15" 4" (N of Trinity Lake)
Highland Lakes 6030 ft 2 ft 0" >>> 18" 5.5" (NE of Trinity Lake)
Slate Creek 5700 ft 1.5 ft 0" >>> 12" 5" (NE of Trinity Lake)
Sierra Nevada
Rattlesnake 6100 ft 0.5 ft 0" >>> 4" 2.5" (SE of Lake Almanor)
Kettle Rock 7300 ft 1.5 ft 0" >>> 10" 3" (well SE of Lake Almanor)
Bucks Lake 5750 ft 2 ft 0" >>> 18" 12" (NE of Lake Oroville)
Four Trees 5150 ft 2.5 ft 0" >>> 22" 17" (NE of Lake Oroville)
Pilot Peak 6800 ft 1.5 ft 0" >>> 12" 5" (S of SR 70 & Quincy)
Robinson Cow Camp 6480 ft 1.5 ft 0" >>> 13" 6" (N of SR 49 & Sierra City)
Meadow Lake 7200 ft 3 ft 20" >>> 47" -- (N of I-80, MP 168)
Independence Lake SNOTEL 8350 ft 5 ft 15" >>> 50" 7" (N of I-80, MP 180)
Central Sierra Snow Lab 6850 ft 3 ft 14" >>> 34" 10" (along I-80, MP 174)
Huysink 6600 ft 2 ft 9" >>> 21" 16" (S of I-80, MP 165)
Blue Canyon 5280 ft 1.5 ft 0" >>> 14" 13" (along I-80, MP 155)
Big Meadow SNOTEL (Nevada) 8250 ft 2.5 ft 14" >>> 31" 3" (S of I-80, Nevada MP 3)
Mt Rose Ski SNOTEL (Nevada) 8800 ft 5 ft 22" >>> 58" 8" (along SR 431, Nevada)
Marlette Lake SNOTEL (Nevada) 7880 ft 4 ft 22" >>> 53" 6.5" (E of Lake Tahoe, Nevada)
Squaw Valley G.C. SNOTEL 8030 ft 6 ft 13" >>> 60" 11" (Squaw Valley Ski Area)
Ward Creek #3 SNOTEL 6650 ft 1.5 ft 13" >>> 23" 12" (S of Alpine Mdws Ski Area)
Greek Store 5600 ft 1.5 ft 4" >>> 19" 12" (well W of Lake Tahoe)
Rubicon #2 SNOTEL 7700 ft 1.5 ft 17" >>> 27" 6" (W of Lake Tahoe above SR 89)
Heavenly Valley SNOTEL 8580 ft 5 ft 18" >>> 52" 6" (bottom of Sky Express)
Hagan's Meadow SNOTEL 7780 ft 1.5 ft 12" >>> 25" 5" (W side of Freel Peak)
Horse Meadow SNOTEL 8550 ft 5 ft 15" >>> 52" 6" (SE side of Freel Peak)
Echo Peak SNOTEL 7670 ft 6 ft 22" >>> 66" 10" (W of Echo Summit, US 50)
Forni Ridge 7600 ft 4 ft 10" >>> 40" 9" (US 50, W of Sierra-at-Tahoe)
Silver Lake 7100 ft 2 ft 13" >>> 28" 8" (SR 88, W of Kirkwood)
Caples Lake 8000 ft 4.5 ft 13" >>> 44" 6" (SR 88, E of Kirkwood)
Carson Pass SNOTEL 8350 ft 5 ft 21" >>> 57" 6" (SR 88, E of Kirkwood)
Forestdale Creek SNOTEL 8020 ft 5.5 ft 21" >>> 61" 8" (just E of Carson Pass)
Burnside Lake Creek SNOTEL 8130 ft 4.5 ft 17" >>> 53" 5.5" (E of Carson Pass)
Monitor Pass SNOTEL 8310 ft 1 ft 17" >>> 22" 1" (way E on SR 89)
Blue Lakes SNOTEL 8050 ft 3 ft 17" >>> 43" 7.5" (SE of Carson Pass)
Ebbetts Pass SNOTEL 8770 ft 5 ft 29" >>> 63" 6.5" (along SR 4)
Stanislaus Meadow 7750 ft 6 ft 15" >>> 67" 8" (SR 4, SW of Ebbetts Pass)
Bloods Creek 7200 ft 4 ft 17" >>> 51" -- (SR 4, S of Bear Valley)
Black Springs 6500 ft 1.5 ft 6" >>> 16" 9.5" (SR 4, NE of Arnold)
Lobdell Lake SNOTEL 9230 ft 1 ft 12" >>> 19" 1" (way E of US 395)
Deadman Creek 9250 ft 3 ft 24" >>> 47" 3.5" (SR 108, W of Sonora Pass)
Sonora Pass SNOTEL 8830 ft 2.5 ft 20" >>> 39" 3" (SR 108, E of Sonora Pass)
Leavitt Lake SNOTEL 9620 ft 4.5 ft 42" >>> 73" 5.5" (S of Sonora Pass)
Gianelli Meadow 8400 ft 5 ft 24" >>> 61" 8" (E of Dodge Ridge Ski Area)
Slide Canyon 9200 ft 4 ft 32" >>> 66" -- (NE part of Yosemite NP)
Paradise Meadow 7650 ft 3 ft 8" >>> 33" 7" (N part of Yosemite NP)
Virginia Lakes Ridge SNOTEL 9450 ft 1 ft 15" >>> 22" 1" (NE of Yosemite near US 395)
Tenaya Lake 8150 ft 2.5 ft 20" >>> 37" 3" (on SR 120 in Yosemite NP)
Tuolumne Meadows 8600 ft 1.5 ft 10" >>> 21" 2"
Please Log in or Create an account to join the conversation.
- Amar Andalkar
- [andalkar]
-
Topic Author
- Offline
- Premium Member
-
Less
More
- Posts: 635
- Thank you received: 0
14 Feb 2014 16:06 - 16 Feb 2014 16:57 #220371
by Amar Andalkar
Replied by Amar Andalkar on topic Re: Next major storm brings 4-6 ft snow Feb 6-14,2014!
Update #8: 192 hours after initial post, 2-7 ft of snow has already fallen in southwest BC, Washington, Oregon, and California,
with an additional 4-8 ft (or more) predicted over the next week for WA, OR, and southwest BC!
The climax of this storm cycle is about to arrive in the Pacific Northwest! The period of maximum sustained snowfall for Washington and Oregon is expected to extend from Sunday into the middle of next week...
Another day later, and 2 more subsequent runs of the UW WRF-GFS model at 12-hour intervals continue to predict large snowfall amounts of 4-8 ft (and perhaps much more) over the next week for Washington, Oregon, and southwest BC, along with about 3-5 ft in northern California. This is in addition to 2-7 ft of snow which has already fallen over the past 8 days at most mountain sites from Bella Coola, BC, all the way south to Mammoth Mountain, a span of about 1100 miles as the crow flies (and well over 1500 miles by car). The predicted amounts for both precip and snowfall over the next week remain similar to those predicted during the last 3-6 days, almost monotonously and repetitively similar on each of the last few updates -- but that's an excellent sign of stability in the model's predictions, with a continuing increase in overall totals as further storm systems come into view this weekend and into next week. If these predictions verify and the storm cycle continues as expected for another week, this will end up solidly in the HUGE storm cycle category with 10-day snowfall totals exceeding 10 ft at many sites especially above 4000-5000 ft in the Washington and northern Oregon Cascades plus southwestern BC.
The first stage of this storm cycle, aimed primarily at the Sierra Nevada (an atmospheric river) and also at Oregon and southern Washington (frontal snowfall along the boundary between a modified Arctic air mass and warmer air to the south), began early on Thursday, February 6, and ended during the day Monday, February 10. The second stage of this storm cycle started early Monday morning and will extend throughout this weekend into next week, featuring a series of fronts and systems every 1-2 days in strong westerly and southwesterly flow over the north Pacific, aimed primarily at Oregon, Washington, and southwestern British Columbia. The first system of the second stage came ashore Monday morning, and the next much stronger system arrived in the same region on Tuesday afternoon, including another atmospheric river event aimed at Oregon, a few hundred miles farther north than the first atmospheric river aimed at the central Sierra Nevada. This atmospheric river is expected to stay in place for another 1-2 days while slowly shifting southward, weakening slightly today and more significantly by Saturday afternoon as it eventually shifts a couple hundred miles farther south into northern California, which will bring some more precipitation to that area over the weekend, before it finally fades away on Sunday. This event has already produced very high precipitation amounts exceeding 10" on Mount Hood in the last 4 days. The water vapor satellite image from Friday afternoon (see www.nrlmry.navy.mil/sat-bin/epac_westcoast.cgi) shows the plume of moisture still aimed at Oregon, although less sharply defined than in the image from Update #6 two days earlier:
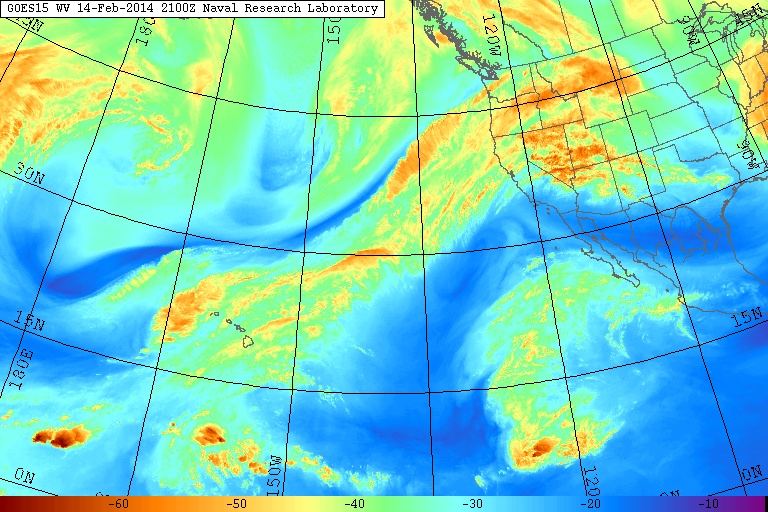
The NWS's GFS model and their Quantitative Precipitation Forecasts still show up to 8-11" of precip over the next week for the mountains of Washington, Oregon, and northwestern California, with 4-5" in southwestern BC and much smaller amounts of only 1-2" extending south into the northern Sierra. Here is total precipitation in inches predicted over the next 7 days through the afternoon of Friday, February 21:
Following another minor lull between systems on Thursday afternoon and evening, the current storm system arrived around midnight Thursday-Friday and will continue through Friday evening, most intensely in Oregon. As of midday Friday, February 14, another 4-14" of new snow has fallen over the previous 24 hours at higher elevations throughout the Washington and Oregon Cascades, Olympics, and southwestern BC extending north past Whistler, with heavy snowfall continuing at many sites into Friday afternoon. Snow levels rose somewhat overnight into midday Friday to about 3000 ft near Whistler, 4000 ft in the North Cascades, 4500 ft from Snoqualmie Pass to Mount Rainier, 5000 ft from White Pass through Mount Hood, 6000 ft in the central Oregon Cascades, and 7000 ft in the southern Oregon Cascades. The largest snowfall amounts are in the Oregon Cascades today, with around 1 ft of dense new snow as of noon at Timberline on Mount Hood and on Mount Bachelor, which continues to have the largest storm total snowfall of any measurement site in the Northwest with about 6.5 ft now. Given continued heavy snowfall throughout the day, there is no point in trying to update the storm totals at this time from the values listed above in the previous post.
There is yet another lull between systems on Friday night, then the next system arrives by Saturday afternoon into Sunday morning, followed quickly by another stronger system on Sunday afternoon through Monday. Another strong system is expected on Tuesday. The current stage of this storm cycle is also producing heavy snowfall in southeast Alaska, for the past day and again over the weekend, all due to various low-pressure systems spawned from the same parent low in the Gulf of Alaska which has been associated with this entire storm cycle. Here is a wider view from the 36km resolution, showing several more feet of snowfall in southeast Alaska through Monday:
[size=small](This is actually model snow precip and not snowfall, but that distinction is unimportant for this image.)[/size]
Snowfall during the next 3 days through 4pm Monday is predicted to be 3-7 ft over the west slopes and volcanic peaks of the Washington and Oregon Cascades, the Olympics, and southwestern BC, with perhaps up to 1-3 ft extending into the California Cascades, Trinity Alps, and northern Sierra Nevada on Saturday and Sunday:
Higher resolution version of that, showing the Pacific Northwest and also zoomed in on Washington and Oregon:
Maximum snowfall amounts of 4-7 ft (marked by white inside yellow) are shown along the west slopes and volcanic peaks of the Washington and Oregon Cascades plus the Olympics. Notably, the Washington graphic above has the largest area with 3-day totals over 4 ft shown in any 3-day graphic in any previous update in this thread, or either of the two earlier storm threads. So this is expected to be the largest 3-day snowfall in Washington state thus far in the 2013-14 season. The most intense portion of that is Sunday through early Monday, when even the 24-hour totals are predicted to exceed 4 ft on Mounts Rainier, Adams, and Saint Helens above about 5000 ft:

It will be very interesting to see if such an extreme snowfall prediction actually verifies, especially since that is currently 2-3 days out. The UW model has become very good over the past several years of development, but extreme predictions often tend not to actually occur, and real 24-hour snowfall amounts may end up in the more reasonable 2-3 ft range.
This loop shows how the model predictions for snowfall during the 3-day period through 4pm Monday have evolved between 10 subsequent runs over the last 5 days, the D(model)/D(t). Very consistent in the overall picture throughout, with snowfall amounts increasing and decreasing a bit especially in northern California, but no major changes:
www.atmos.washington.edu/~ovens/wxloop.c...2+v2014021800///+-st
Additional snowfall during the subsequent 3 days ending 4pm next Thursday is predicted to be another 3-6 ft over the west slopes and volcanic peaks of the Washington and Oregon Cascades, with 2-3 ft in the Olympics, southwestern BC, and extending south into the California Cascades, Trinity Alps, and northern Sierra Nevada. These systems from Sunday through early next week are also likely to feature somewhat lower snow levels than the systems thus far this week.
Beyond that point, it appears that this storm cycle is likely to include at least one more system next Thursday-Friday before it eventually tapers off. Additional snowfall during the 1 day period ending 4pm next Friday is predicted to be 1-2 ft over the Oregon Cascades, with less than 1 ft extending north into Washington. Details may certainly change as that period draws closer, as it is currently 6-7 days out, near the limit of accurate numerical weather prediction.
The predicted 7.5-day snowfall totals still remain astronomical at roughly 7-14 ft (!!) over the west slopes and volcanic peaks of the Washington and Oregon Cascades, with about 5-10 ft in the Olympics, 4-8 ft in southwestern BC, and perhaps 3-5 ft in the California Cascades and northern Sierra Nevada, all of that on top of the 2-7 ft that have already fallen. Fantastic!
It appears increasingly likely that this storm cycle will finally dissipate and come to an end roughly one week from now. But unlike after the first major storm cycle of the 2013-14 season (January 7-14, 2014) , there are no indications of a sustained period of high pressure and fair weather over the entire West Coast after this much-larger storm cycle. The extended GFS model out to 384 hours (16 days) shows additional weaker storm systems throughout the 8-16 day period. This is the predicted 24-hour precip throughout that period, click "Loop All" to see all the graphics (3 hour intervals up to 192 hours, 12 hour intervals beyond that):
GFS, North Pacific, 02/14/2014 12UTC, precip_p24
with an additional 4-8 ft (or more) predicted over the next week for WA, OR, and southwest BC!
The climax of this storm cycle is about to arrive in the Pacific Northwest! The period of maximum sustained snowfall for Washington and Oregon is expected to extend from Sunday into the middle of next week...
Another day later, and 2 more subsequent runs of the UW WRF-GFS model at 12-hour intervals continue to predict large snowfall amounts of 4-8 ft (and perhaps much more) over the next week for Washington, Oregon, and southwest BC, along with about 3-5 ft in northern California. This is in addition to 2-7 ft of snow which has already fallen over the past 8 days at most mountain sites from Bella Coola, BC, all the way south to Mammoth Mountain, a span of about 1100 miles as the crow flies (and well over 1500 miles by car). The predicted amounts for both precip and snowfall over the next week remain similar to those predicted during the last 3-6 days, almost monotonously and repetitively similar on each of the last few updates -- but that's an excellent sign of stability in the model's predictions, with a continuing increase in overall totals as further storm systems come into view this weekend and into next week. If these predictions verify and the storm cycle continues as expected for another week, this will end up solidly in the HUGE storm cycle category with 10-day snowfall totals exceeding 10 ft at many sites especially above 4000-5000 ft in the Washington and northern Oregon Cascades plus southwestern BC.
The first stage of this storm cycle, aimed primarily at the Sierra Nevada (an atmospheric river) and also at Oregon and southern Washington (frontal snowfall along the boundary between a modified Arctic air mass and warmer air to the south), began early on Thursday, February 6, and ended during the day Monday, February 10. The second stage of this storm cycle started early Monday morning and will extend throughout this weekend into next week, featuring a series of fronts and systems every 1-2 days in strong westerly and southwesterly flow over the north Pacific, aimed primarily at Oregon, Washington, and southwestern British Columbia. The first system of the second stage came ashore Monday morning, and the next much stronger system arrived in the same region on Tuesday afternoon, including another atmospheric river event aimed at Oregon, a few hundred miles farther north than the first atmospheric river aimed at the central Sierra Nevada. This atmospheric river is expected to stay in place for another 1-2 days while slowly shifting southward, weakening slightly today and more significantly by Saturday afternoon as it eventually shifts a couple hundred miles farther south into northern California, which will bring some more precipitation to that area over the weekend, before it finally fades away on Sunday. This event has already produced very high precipitation amounts exceeding 10" on Mount Hood in the last 4 days. The water vapor satellite image from Friday afternoon (see www.nrlmry.navy.mil/sat-bin/epac_westcoast.cgi) shows the plume of moisture still aimed at Oregon, although less sharply defined than in the image from Update #6 two days earlier:
The NWS's GFS model and their Quantitative Precipitation Forecasts still show up to 8-11" of precip over the next week for the mountains of Washington, Oregon, and northwestern California, with 4-5" in southwestern BC and much smaller amounts of only 1-2" extending south into the northern Sierra. Here is total precipitation in inches predicted over the next 7 days through the afternoon of Friday, February 21:
Following another minor lull between systems on Thursday afternoon and evening, the current storm system arrived around midnight Thursday-Friday and will continue through Friday evening, most intensely in Oregon. As of midday Friday, February 14, another 4-14" of new snow has fallen over the previous 24 hours at higher elevations throughout the Washington and Oregon Cascades, Olympics, and southwestern BC extending north past Whistler, with heavy snowfall continuing at many sites into Friday afternoon. Snow levels rose somewhat overnight into midday Friday to about 3000 ft near Whistler, 4000 ft in the North Cascades, 4500 ft from Snoqualmie Pass to Mount Rainier, 5000 ft from White Pass through Mount Hood, 6000 ft in the central Oregon Cascades, and 7000 ft in the southern Oregon Cascades. The largest snowfall amounts are in the Oregon Cascades today, with around 1 ft of dense new snow as of noon at Timberline on Mount Hood and on Mount Bachelor, which continues to have the largest storm total snowfall of any measurement site in the Northwest with about 6.5 ft now. Given continued heavy snowfall throughout the day, there is no point in trying to update the storm totals at this time from the values listed above in the previous post.
There is yet another lull between systems on Friday night, then the next system arrives by Saturday afternoon into Sunday morning, followed quickly by another stronger system on Sunday afternoon through Monday. Another strong system is expected on Tuesday. The current stage of this storm cycle is also producing heavy snowfall in southeast Alaska, for the past day and again over the weekend, all due to various low-pressure systems spawned from the same parent low in the Gulf of Alaska which has been associated with this entire storm cycle. Here is a wider view from the 36km resolution, showing several more feet of snowfall in southeast Alaska through Monday:
[size=small](This is actually model snow precip and not snowfall, but that distinction is unimportant for this image.)[/size]
Snowfall during the next 3 days through 4pm Monday is predicted to be 3-7 ft over the west slopes and volcanic peaks of the Washington and Oregon Cascades, the Olympics, and southwestern BC, with perhaps up to 1-3 ft extending into the California Cascades, Trinity Alps, and northern Sierra Nevada on Saturday and Sunday:
Higher resolution version of that, showing the Pacific Northwest and also zoomed in on Washington and Oregon:
Maximum snowfall amounts of 4-7 ft (marked by white inside yellow) are shown along the west slopes and volcanic peaks of the Washington and Oregon Cascades plus the Olympics. Notably, the Washington graphic above has the largest area with 3-day totals over 4 ft shown in any 3-day graphic in any previous update in this thread, or either of the two earlier storm threads. So this is expected to be the largest 3-day snowfall in Washington state thus far in the 2013-14 season. The most intense portion of that is Sunday through early Monday, when even the 24-hour totals are predicted to exceed 4 ft on Mounts Rainier, Adams, and Saint Helens above about 5000 ft:
It will be very interesting to see if such an extreme snowfall prediction actually verifies, especially since that is currently 2-3 days out. The UW model has become very good over the past several years of development, but extreme predictions often tend not to actually occur, and real 24-hour snowfall amounts may end up in the more reasonable 2-3 ft range.
This loop shows how the model predictions for snowfall during the 3-day period through 4pm Monday have evolved between 10 subsequent runs over the last 5 days, the D(model)/D(t). Very consistent in the overall picture throughout, with snowfall amounts increasing and decreasing a bit especially in northern California, but no major changes:
www.atmos.washington.edu/~ovens/wxloop.c...2+v2014021800///+-st
Additional snowfall during the subsequent 3 days ending 4pm next Thursday is predicted to be another 3-6 ft over the west slopes and volcanic peaks of the Washington and Oregon Cascades, with 2-3 ft in the Olympics, southwestern BC, and extending south into the California Cascades, Trinity Alps, and northern Sierra Nevada. These systems from Sunday through early next week are also likely to feature somewhat lower snow levels than the systems thus far this week.
Beyond that point, it appears that this storm cycle is likely to include at least one more system next Thursday-Friday before it eventually tapers off. Additional snowfall during the 1 day period ending 4pm next Friday is predicted to be 1-2 ft over the Oregon Cascades, with less than 1 ft extending north into Washington. Details may certainly change as that period draws closer, as it is currently 6-7 days out, near the limit of accurate numerical weather prediction.
The predicted 7.5-day snowfall totals still remain astronomical at roughly 7-14 ft (!!) over the west slopes and volcanic peaks of the Washington and Oregon Cascades, with about 5-10 ft in the Olympics, 4-8 ft in southwestern BC, and perhaps 3-5 ft in the California Cascades and northern Sierra Nevada, all of that on top of the 2-7 ft that have already fallen. Fantastic!
It appears increasingly likely that this storm cycle will finally dissipate and come to an end roughly one week from now. But unlike after the first major storm cycle of the 2013-14 season (January 7-14, 2014) , there are no indications of a sustained period of high pressure and fair weather over the entire West Coast after this much-larger storm cycle. The extended GFS model out to 384 hours (16 days) shows additional weaker storm systems throughout the 8-16 day period. This is the predicted 24-hour precip throughout that period, click "Loop All" to see all the graphics (3 hour intervals up to 192 hours, 12 hour intervals beyond that):
GFS, North Pacific, 02/14/2014 12UTC, precip_p24
Please Log in or Create an account to join the conversation.
- bfree32
- [bfree32]
-
- Offline
- Junior Member
-
Less
More
- Posts: 62
- Thank you received: 0
15 Feb 2014 19:37 #220399
by bfree32
Replied by bfree32 on topic Re: HUGE storm cycle brings 4-12 ft snow Feb6-21,2014!
Thanks for the updates Amar. Has anyone else notice the MM5 forecasts not loading properly in Chrome? It hangs on "loading images". I've noticed this on a couple computers lately, and it works fine in firefox or explorer.
Please Log in or Create an account to join the conversation.
- Amar Andalkar
- [andalkar]
-
Topic Author
- Offline
- Premium Member
-
Less
More
- Posts: 635
- Thank you received: 0
16 Feb 2014 10:38 - 16 Feb 2014 10:41 #220419
by Amar Andalkar
Replied by Amar Andalkar on topic Re: HUGE storm cycle brings 4-12 ft snow Feb6-21,2014!
I've had no trouble viewing the UW model forecasts in Chrome (although I usually view them in Safari), but that's on a Mac. Not sure what the problem could be.
No 216-hour update yesterday, too tired after Vertfest (= Powderfest, with 5" new between 10am and 3pm) even though I didn't race, demoing 6 different pairs of skis and trying to shoot photos of the race in a raging snowstorm. Clear skies at Alpental at 8am, very light snow falling by the 10am race start, snowing heavily by 10:30am.
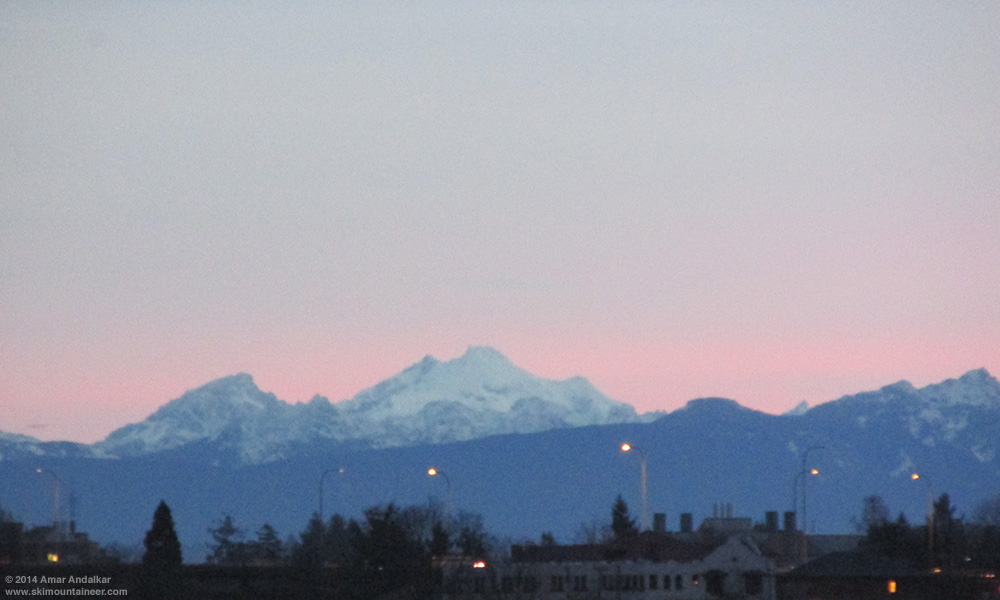
[size=small]Clear skies at dawn on Glacier Peak during a brief lull between storm systems, as seen from my deck in Seattle, 6:55am February 15.[/size]
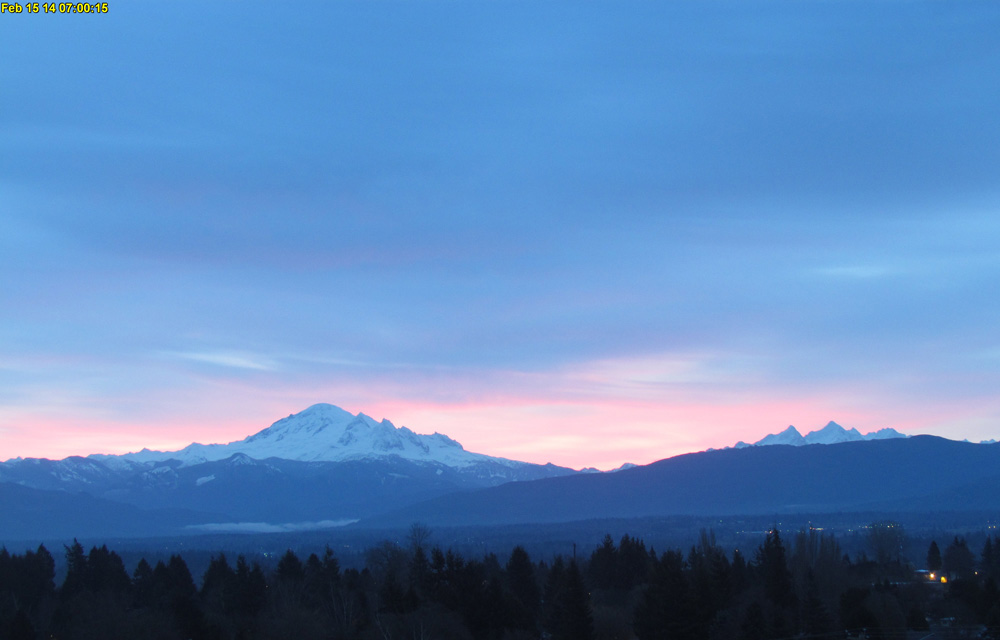
[size=small]Clear skies at dawn on Mount Baker and Twin Sisters Mountain during a brief lull between storm systems, as seen on the visibility camera from Ferndale .[/size]
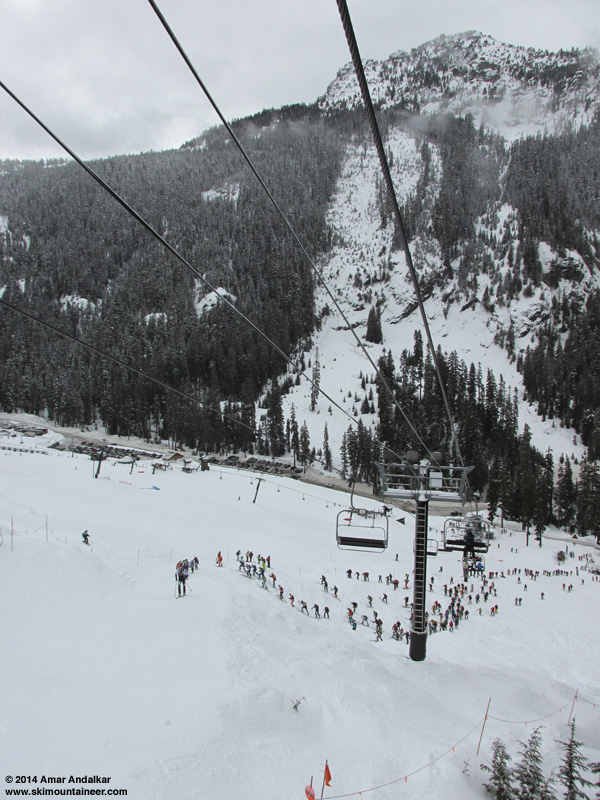
[size=small]Rando racers surging uphill from the start with Mount Snoqualmie still fully visible, Alpental Vertfest, 10:05am February 15.[/size]
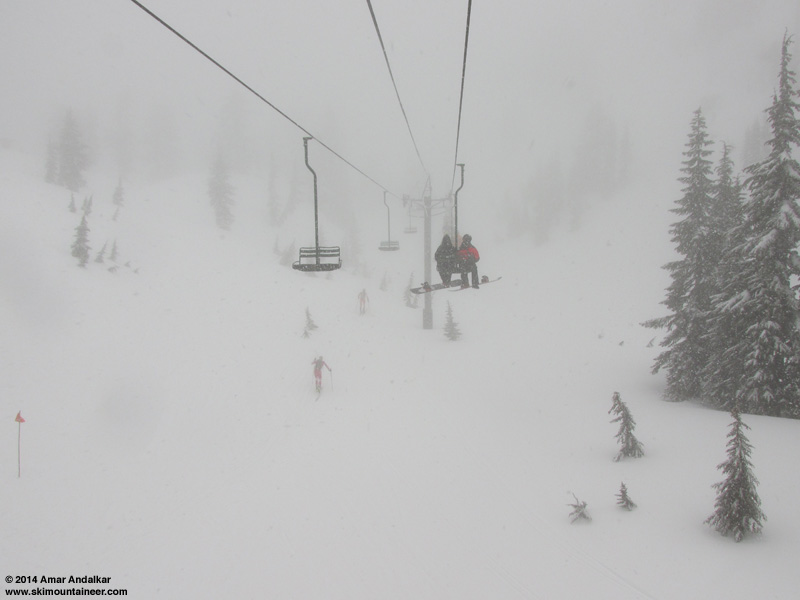
[size=small]Rando racers in a raging snowstorm, Alpental Vertfest, 10:35am February 15.[/size]
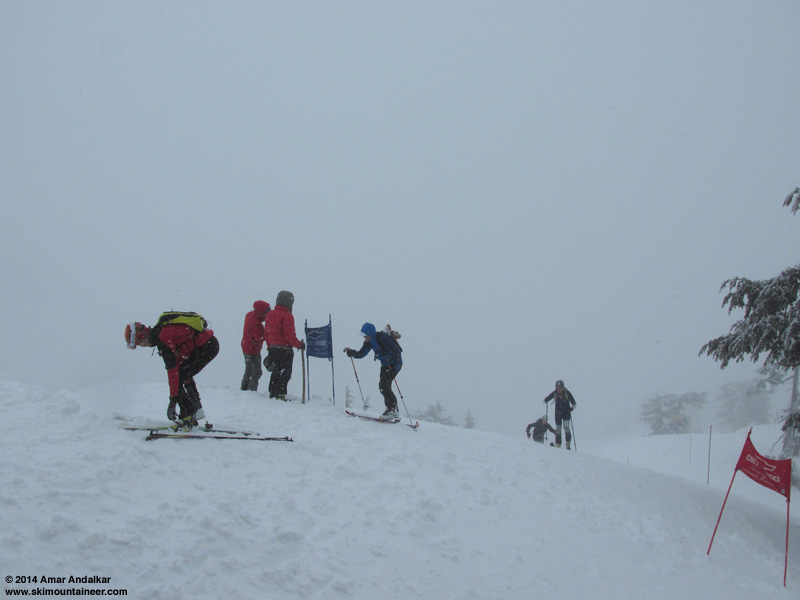
[size=small]The summit transition point with wind-driven horizontal snowfall, Alpental Vertfest, 10:50am February 15.[/size]
Snowfall data for February 15 at numerous ski areas was collected during the early morning and evening hours though, and the day's runs of the UW weather model were reviewed. Update #9 is in preparation, to be posted shortly...
No 216-hour update yesterday, too tired after Vertfest (= Powderfest, with 5" new between 10am and 3pm) even though I didn't race, demoing 6 different pairs of skis and trying to shoot photos of the race in a raging snowstorm. Clear skies at Alpental at 8am, very light snow falling by the 10am race start, snowing heavily by 10:30am.
[size=small]Clear skies at dawn on Glacier Peak during a brief lull between storm systems, as seen from my deck in Seattle, 6:55am February 15.[/size]
[size=small]Clear skies at dawn on Mount Baker and Twin Sisters Mountain during a brief lull between storm systems, as seen on the visibility camera from Ferndale .[/size]
[size=small]Rando racers surging uphill from the start with Mount Snoqualmie still fully visible, Alpental Vertfest, 10:05am February 15.[/size]
[size=small]Rando racers in a raging snowstorm, Alpental Vertfest, 10:35am February 15.[/size]
[size=small]The summit transition point with wind-driven horizontal snowfall, Alpental Vertfest, 10:50am February 15.[/size]
Snowfall data for February 15 at numerous ski areas was collected during the early morning and evening hours though, and the day's runs of the UW weather model were reviewed. Update #9 is in preparation, to be posted shortly...
Please Log in or Create an account to join the conversation.
- Amar Andalkar
- [andalkar]
-
Topic Author
- Offline
- Premium Member
-
Less
More
- Posts: 635
- Thank you received: 0
16 Feb 2014 18:36 - 17 Feb 2014 19:29 #220427
by Amar Andalkar
Replied by Amar Andalkar on topic Re: HUGE storm cycle brings 4-12 ft snow Feb6-21,2014!
Update #9: 240 hours after initial post, 2-8 ft of snow has already fallen in southwest BC, Washington, Oregon, and California,
with an additional 4-8 ft predicted during this week for WA, OR, and southwest BC!
The climax of this storm cycle has arrived in the Pacific Northwest! The period of maximum sustained snowfall for Washington and Oregon is expected to extend from Sunday through Thursday, with several feet of new powder at further lowering snow levels. Epic!
Two days after the previous update, 4 more subsequent runs of the UW WRF-GFS model at 12-hour intervals continue to predict large snowfall amounts of 4-8 ft over the rest of this week for Washington, Oregon, and southwest BC. This is in addition to 2-8 ft of snow which has already fallen over the past 10 days since this storm cycle began on February 6 at most mountain sites from Bella Coola, BC, south to Mammoth Mountain, CA, plus parts of south-central and southeastern Alaska. New snow of at least a few inches (including up to 12-18" in the North Cascades, Olympics, and southwestern BC) was recorded over the past 24 hours at almost all mountain measurement sites along the Pacific coast from Alyeska near Anchorage, Alaska, all the way south to Mammoth Mountain, a span of about 2100 miles as the crow flies (and over 3100 miles by car ). The snowfall over this vast distance is all due to low-pressure systems spawned from the same upper-level parent low in the Gulf of Alaska which has been associated with this entire storm cycle.
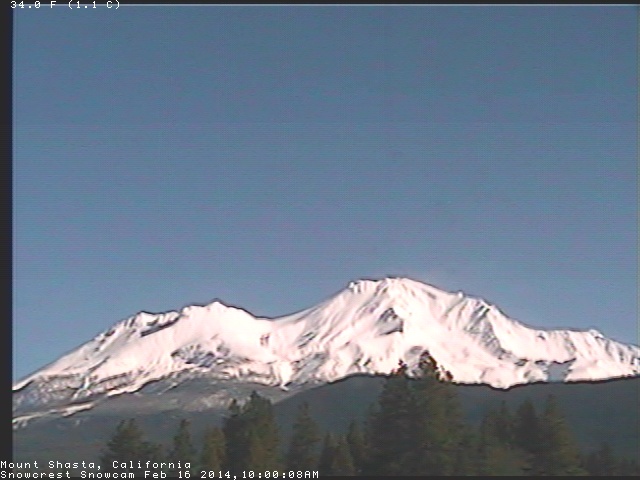
[size=small]Mount Shasta gleaming white on Sunday morning after a few inches of snow overnight, as seen on the SnowCrest webcam .[/size]
The predicted amounts for both precip and snowfall during this week remain similar to those predicted during the last several days, an excellent sign of stability in the model's predictions, with a continuing increase in overall storm totals as further storm systems came into view this weekend and into next week. If these predictions verify and the storm cycle continues as expected for the rest of this week, this will end up solidly in the HUGE storm cycle category with 15-day snowfall totals exceeding 10-12 ft at many sites especially above 4000-5000 ft in the Washington and northern Oregon Cascades plus southwestern BC.
The NWS's GFS model and their Quantitative Precipitation Forecasts still show up to 7-10" of precip over the next week for the mountains of Washington, with 4-5" in southwestern BC and Oregon, and much smaller amounts of only a fraction of an inch extending south into the California Cascades and northern Sierra. Here is total precipitation in inches predicted over the next 7 days through Sunday morning, February 23, with almost all of that shown in the Pacific Northwest falling in the next 5 days though Friday:
The fire hose of the jet stream (see Days 1-5 Jet Stream Analysis & Forecasts ) continues to be aimed directly into the Pacific Northwest, but as predicted it has undergone a major evolution and shift in direction on Saturday February 15, from southwesterly in the latter half of last week to westerly as of Sunday morning (compare with the same image in Update #7 above, this image is almost identical to the prediction 3 days earlier):
By Wednesday the jet stream pattern will further evolve, now approaching from the northwest, and remain that way through Friday, February 21, as it weakens and shifts eastward over the Northwest coast, bringing the heavy precip and snowfall (and this storm cycle) to an end:
Following Saturday's storm systems which brought snow from Alaska to California, there was a minor lull early Sunday with snowfall decreasing over the entire span and skies clearing completely in California. But the next much stronger system moved ashore immediately by midday aimed at Vancouver Island and the Olympics, pushing on to the southwestern BC mainland and Washington Cascades by Sunday afternoon. The heaviest snowfall rates are expected during Sunday evening into early Monday, with 2-4" per hour possible at times. The heaviest snowfall will shift south into the Oregon Cascades during the day Monday, but snow will continue in Washington throughout the day. The next strong system is expected to arrive on Tuesday morning, once again aimed at southwestern BC and Washington, then shifting southward to Oregon by the afternoon and even into northern California overnight. Another weaker wave of snowfall comes ashore on Wednesday morning, then the next strong system is projected to arrive late Wednesday into southwestern BC and Washington again, lasting through the day Thursday with snowfall again shifting into Oregon.
Snowfall during the next 3 days through 4am Wednesday is predicted to be 3-7 ft over the west slopes and volcanic peaks of the Washington and northern Oregon Cascades, the Olympics, and southwestern BC, with 2-4 ft in the southern Oregon Cascades and perhaps up to 1 ft extending into the California Cascades, Trinity Alps, and northern Sierra Nevada on Tuesday-Wednesday:
Higher resolution version of that, showing the Pacific Northwest and also zoomed in on Washington and Oregon:
Maximum snowfall amounts of 4-7 ft (marked by white inside yellow) are shown along the west slopes and volcanic peaks of the Washington and northern Oregon Cascades plus the Olympics. Notably, the Washington graphic above has the largest area with 3-day totals over 4 ft shown in any 3-day graphic in any previous update in this thread (slightly greater than that in Update #") , or either of the two earlier storm threads. So this is expected to be the largest 3-day snowfall in Washington state thus far in the 2013-14 season. The most intense portion of that is Sunday afternoon through Monday afternoon, when even the 24-hour totals are predicted to exceed 4 ft on Mount Rainier above about 5000 ft, with amounts exceeding 3 ft on most of the west slopes and volcanic peaks of the Washington Cascades and Olympics:
, or either of the two earlier storm threads. So this is expected to be the largest 3-day snowfall in Washington state thus far in the 2013-14 season. The most intense portion of that is Sunday afternoon through Monday afternoon, when even the 24-hour totals are predicted to exceed 4 ft on Mount Rainier above about 5000 ft, with amounts exceeding 3 ft on most of the west slopes and volcanic peaks of the Washington Cascades and Olympics:
It will be very interesting to see if such an extreme snowfall prediction actually verifies, especially since the model has given very similar predictions over the past 2 days, with only a minor reduction in predicted amounts and a slight shift in timing by several hours later. The UW model has become very good over the past several years of development, but extreme predictions often tend not to actually occur, and real 24-hour snowfall amounts may end up in the more reasonable 2-3 ft range.
The maximum snowfall rates predicted by the model are also amazing, with 4-5" per hour during the most intense portion of the storm at some locations. This image zoomed in on western Washington shows snowfall during a 3-hour period early Monday, with 12-16" predicted on Mount Rainier during those 3 hours:
This loop shows how the model predictions for snowfall during the 3-day period through 4am Wednesday have evolved between 10 subsequent runs over the last 5 days, the D(model)/D(t). Very consistent in the overall picture throughout with snowfall amounts increasing and decreasing a bit in BC and Oregon (remaining steadiest for Washington), but no major changes other than a significant reduction in snowfall for northern California:
www.atmos.washington.edu/~ovens/wxloop.c...2+v2014021912///+-st
Additional snowfall during the subsequent 3 days ending 4am next Saturday is predicted to be another 2-3 ft over the west slopes and volcanic peaks of the Washington and northern Oregon Cascades, with 1-2 ft in the Olympics, southwestern BC, and southern Oregon Cascades. Almost all of this snowfall is expected to occur before Friday morning:
It appears almost certain now that this storm cycle will finally dissipate and come to an end by Friday, February 21. But unlike after the first major storm cycle of the 2013-14 season (January 7-14, 2014) , there are no indications of a sustained period of high pressure and fair weather over the entire West Coast after this much-larger storm cycle. The extended GFS model out to 384 hours (16 days) shows additional weaker storm systems during the 6-16 day period into the start of March. This is the predicted 24-hour precip throughout that period, click "Loop All" to see all the graphics (3 hour intervals up to 192 hours, 12 hour intervals beyond that):
GFS, North Pacific, 02/16/2014 18UTC, precip_p24
Storm Cycle History:
The first stage of this storm cycle, aimed primarily at the Sierra Nevada (an atmospheric river) and also at Oregon and southern Washington (frontal snowfall along the boundary between a modified Arctic air mass and warmer air to the south), began early on Thursday, February 6, and ended during the day Monday, February 10. This atmospheric river event produced 4-day precipitation totals of up to 10-17" at many sites near Lake Oroville and Lake Tahoe along the west slopes of the northern Sierra Nevada, with snowfall totals reaching 5-7 ft at sites above 8000 ft from Independence Lake south to Sonora Pass with much lesser amounts of 1-2 ft at 6000 ft. Areas farther south such as Yosemite and Mammoth received much less snowfall, only about 2-3 ft even at 9000 ft, and only 2" total at 9000 ft on June Mountain located just north of Mammoth in the rain shadow of the Sierra Crest. Farther north in the northernmost Sierra Nevada, Trinity Alps, and California Cascades, maximum snowfall amounts were generally 1-3 ft above 6000-7000 ft. The frontal snowfall produced 2-3 ft in the Oregon and southern Washington Cascades, with lesser amounts of about 1 ft as far north as Stevens Pass, barely a few inches in the North Cascades, and almost nothing in southwestern BC which remained cold, clear, and dry. Extensive lowland snowfall down to sea level was also produced during this stage, from the southern Willamette Valley in Oregon all the way north past Seattle and Everett, with maximum amounts of over 6" in parts of northwest Oregon and southwest Washington.
The second stage of this storm cycle had already started as the first was ending on Monday morning February 10, and it extended throughout this week to Sunday, February 16, featuring a series of fronts and systems every 1-2 days in strong southwesterly flow over the north Pacific, aimed primarily at Oregon, Washington, and southwestern British Columbia. The first system of the second stage came ashore Monday morning, and the next much stronger system arrived in the same region on Tuesday afternoon, including another atmospheric river event aimed at Oregon, a few hundred miles farther north than the first atmospheric river aimed at the central Sierra Nevada. This atmospheric river stayed in place through Sunday as it weakened and shifted southward into northern California, bringing some more precipitation to that area over the weekend, before it finally faded away Sunday afternoon. This event produced very high precipitation amounts exceeding 13" on Mount Hood over the last 6 days. Additional snowfall amounts during this stage in the mountains of Oregon, Washington, and southwestern British Columbia were in the 2-5 ft range, with the largest amounts in the northern Oregon Cascades from Mount Hood to Mount Bachelor, which continues to have the largest storm total snowfall of any measurement site in the Northwest with over 7 ft at its 6300 ft base and almost 8 ft at its 7300 ft midstation as of Sunday morning. Given the excessive precip amounts on Mount Hood (about 17" total since February 6), storm total snowfall above 7000 ft likely exceeds 10 ft there already, with about 6.5 ft actually measured at Timberline Lodge (5900 ft) and 5.5 ft at Mount Hood Meadows (5400 ft).
The third and final stage of this storm cycle is underway as of Sunday February 16, following the shift of the jet stream from the southwesterly flow of last week to westerly as of Sunday morning, and eventually to northwesterly by midweek. Strong frontal systems are expected to continue to arrive every 1-2 days through Thursday, before the storm cycle fades out by Friday morning, February 21.
See the table in Reply #21 earlier in this thread for more complete snow and precip totals over the February 6-13 period at more than 170 measurement sites from southwestern BC to the southern Sierra Nevada. An updated table will be posted at some point later this week.
So how is the snowpack doing now in the Northwest? Here are the NWAC CLISNO reports for February 1 and February 15 (just released this morning):
CLIMATOLOGICAL SNOWDEPTH INFORMATION
NORTHWEST WEATHER AND AVALANCHE CENTER SEATTLE WASHINGTON
DAY 1 MONTH 2 YEAR 2014
DATA IN INCHES, -99 DENOTES MISSING DATA
CURRENT CLIMATE PER CENT LAST THRU 2013 THRU 2013
DEPTH AVERAGE OF NORMAL YEAR MAX/YEAR MIN/YEAR
HURRICANE 32 79 41 94 162/1999 10/2005
MT BAKER 82 124 66 153 234/1933 17/1981
STEVENS 61 87 70 88 152/1964 10/1981
SNOQUALMIE 44 78 56 74 154/1964 8/1977
STAMPEDE 40 85 47 -99 228/1946 0/2005
MISSION 22 39 56 36 67/2006 8/1976
CRYSTAL 26 59 44 63 112/1999 6/1977
PARADISE 104 132 79 150 240/1969 27/1977
WHITE PASS 25 53 47 46 110/2008 0/2005
TIMBERLINE 75 119 63 126 238/2002 10/1977
MEADOWS 57 98 58 99 184/1974 9/1977
CLIMATOLOGICAL SNOWDEPTH INFORMATION
NORTHWEST WEATHER AND AVALANCHE CENTER SEATTLE WASHINGTON
DAY 15 MONTH 2 YEAR 2014
DATA IN INCHES, -99 DENOTES MISSING DATA
CURRENT CLIMATE PER CENT LAST THRU 2013 THRU 2013
DEPTH AVERAGE OF NORMAL YEAR MAX/YEAR MIN/YEAR
HURRICANE 44 88 50 100 198/1999 17/2005
MT BAKER 107 138 78 161 244/1999 24/1977
STEVENS 80 94 85 86 166/1956 16/1977
SNOQUALMIE 61 85 72 66 168/1949 4/1977
STAMPEDE 53 90 59 63 202/1949 0/1977
MISSION 38 42 90 35 71/1999 9/1976
CRYSTAL 44 61 72 70 117/1999 0/1977
PARADISE 121 143 85 144 264/1972 24/1977
WHITE PASS 41 55 75 46 100/1999 0/1977
TIMBERLINE 101 128 79 122 230/2002 8/1977
MEADOWS 86 106 81 93 187/1974 4/1977
THIS TABLE PRODUCED ON THE 1ST AND 15TH BETWEEN 15 NOVEMBER AND 1 MAY.
AVERAGES, MAXIMUMS AND MINIMUMS EARLY AND LATE IN THE SEASON MAY BE INACCURATE DUE TO LIMITED DATA.
IF THERE IS TIE FOR THE MAXIMUM OR MINIMUM SNOW DEPTH THEN THE LATEST YEAR IS INDICATED.
RECORDS BEGIN: HURRICANE 1979, MT BAKER 1926, STEVENS 1939, SNOQUALMIE 1929, STAMPEDE 1943,
MISSION RIDGE 1970, CRYSTAL 1967, PARADISE 1926, WHITE PASS 1976, TIMBERLINE 1973, MT HOOD MEADOWS 1974.
NOTE: NRCS DATA USED AT STAMPEDE STARTING 2006-2007 SEASON.
Already a significant improvement in snowpack at all sites as of February 15, and the really heavy snowfall hadn't even begun yet over this region by then, so these numbers are already missing another 4-16" increase in snowdepths since yesterday morning. As of Sunday February 16, Hurricane Ridge is up to 62", Mt Baker 121", Stevens 90", Snoqualmie 65", Stampede 58", Mission Ridge 41", Crystal 50", Paradise 130", White Pass 50", Timberline 110", and Meadows 92" -- over 90% of normal at several sites already! By the time this storm cycle ends on Friday February 21, snowdepths will likely be over 100% of normal at all of these sites, and some sites are likely to be 120-150% of normal for that date. When the next NWAC CLISNO report comes out 8 days after that on March 1, most sites should still be near or above normal even without significant additional snowfall during the last week of February.
Several other sites not included in the NWAC report are already over 100% of normal, including Mount Bachelor which has 105" at its 6300 ft base (roughly 110% of normal) and 130" at its 7300 ft midstation as of Sunday morning. The Chilliwack River BCRFC site at 5300 ft in the BC Cascades (just north of the US border near Mount Baker) reached 138" as of Sunday morning, and is at roughly 120% of normal for snowdepth and snow water equivalent. The Brown Top SNOTEL site (5800 ft near Mount Redoubt in the North Cascades) reached 126" today and might be above 100% of normal too, except it was only installed in 2009 and so normal values are not yet established.
I really do love it when all the gloom-and-doom whiners, those complaining about how bad the early-season snowpack is and how that means the season will be a total bust, turn out to be utterly and completely wrong. At least in Washington, northern Oregon, and southwestern BC, it appears certain that they will be wrong very shortly, and the entire season will be saved and set to go, with a substantial snowpack deep enough to last through spring as usual. Unfortunately there is no such hope on the horizon yet for the far southern end of the Cascades in southernmost Oregon and northernmost California, where the snowpack situation remains bleak at barely 10-25% of normal even after a couple feet of snowfall during the first days of this storm cycle. Hopefully the next major storm cycle will be aimed directly at this most desperately drought-afflicted region of the entire West Coast.
with an additional 4-8 ft predicted during this week for WA, OR, and southwest BC!
The climax of this storm cycle has arrived in the Pacific Northwest! The period of maximum sustained snowfall for Washington and Oregon is expected to extend from Sunday through Thursday, with several feet of new powder at further lowering snow levels. Epic!
Two days after the previous update, 4 more subsequent runs of the UW WRF-GFS model at 12-hour intervals continue to predict large snowfall amounts of 4-8 ft over the rest of this week for Washington, Oregon, and southwest BC. This is in addition to 2-8 ft of snow which has already fallen over the past 10 days since this storm cycle began on February 6 at most mountain sites from Bella Coola, BC, south to Mammoth Mountain, CA, plus parts of south-central and southeastern Alaska. New snow of at least a few inches (including up to 12-18" in the North Cascades, Olympics, and southwestern BC) was recorded over the past 24 hours at almost all mountain measurement sites along the Pacific coast from Alyeska near Anchorage, Alaska, all the way south to Mammoth Mountain, a span of about 2100 miles as the crow flies (and over 3100 miles by car ). The snowfall over this vast distance is all due to low-pressure systems spawned from the same upper-level parent low in the Gulf of Alaska which has been associated with this entire storm cycle.
[size=small]Mount Shasta gleaming white on Sunday morning after a few inches of snow overnight, as seen on the SnowCrest webcam .[/size]
The predicted amounts for both precip and snowfall during this week remain similar to those predicted during the last several days, an excellent sign of stability in the model's predictions, with a continuing increase in overall storm totals as further storm systems came into view this weekend and into next week. If these predictions verify and the storm cycle continues as expected for the rest of this week, this will end up solidly in the HUGE storm cycle category with 15-day snowfall totals exceeding 10-12 ft at many sites especially above 4000-5000 ft in the Washington and northern Oregon Cascades plus southwestern BC.
The NWS's GFS model and their Quantitative Precipitation Forecasts still show up to 7-10" of precip over the next week for the mountains of Washington, with 4-5" in southwestern BC and Oregon, and much smaller amounts of only a fraction of an inch extending south into the California Cascades and northern Sierra. Here is total precipitation in inches predicted over the next 7 days through Sunday morning, February 23, with almost all of that shown in the Pacific Northwest falling in the next 5 days though Friday:
The fire hose of the jet stream (see Days 1-5 Jet Stream Analysis & Forecasts ) continues to be aimed directly into the Pacific Northwest, but as predicted it has undergone a major evolution and shift in direction on Saturday February 15, from southwesterly in the latter half of last week to westerly as of Sunday morning (compare with the same image in Update #7 above, this image is almost identical to the prediction 3 days earlier):
By Wednesday the jet stream pattern will further evolve, now approaching from the northwest, and remain that way through Friday, February 21, as it weakens and shifts eastward over the Northwest coast, bringing the heavy precip and snowfall (and this storm cycle) to an end:
Following Saturday's storm systems which brought snow from Alaska to California, there was a minor lull early Sunday with snowfall decreasing over the entire span and skies clearing completely in California. But the next much stronger system moved ashore immediately by midday aimed at Vancouver Island and the Olympics, pushing on to the southwestern BC mainland and Washington Cascades by Sunday afternoon. The heaviest snowfall rates are expected during Sunday evening into early Monday, with 2-4" per hour possible at times. The heaviest snowfall will shift south into the Oregon Cascades during the day Monday, but snow will continue in Washington throughout the day. The next strong system is expected to arrive on Tuesday morning, once again aimed at southwestern BC and Washington, then shifting southward to Oregon by the afternoon and even into northern California overnight. Another weaker wave of snowfall comes ashore on Wednesday morning, then the next strong system is projected to arrive late Wednesday into southwestern BC and Washington again, lasting through the day Thursday with snowfall again shifting into Oregon.
Snowfall during the next 3 days through 4am Wednesday is predicted to be 3-7 ft over the west slopes and volcanic peaks of the Washington and northern Oregon Cascades, the Olympics, and southwestern BC, with 2-4 ft in the southern Oregon Cascades and perhaps up to 1 ft extending into the California Cascades, Trinity Alps, and northern Sierra Nevada on Tuesday-Wednesday:
Higher resolution version of that, showing the Pacific Northwest and also zoomed in on Washington and Oregon:
Maximum snowfall amounts of 4-7 ft (marked by white inside yellow) are shown along the west slopes and volcanic peaks of the Washington and northern Oregon Cascades plus the Olympics. Notably, the Washington graphic above has the largest area with 3-day totals over 4 ft shown in any 3-day graphic in any previous update in this thread (slightly greater than that in Update #
, or either of the two earlier storm threads. So this is expected to be the largest 3-day snowfall in Washington state thus far in the 2013-14 season. The most intense portion of that is Sunday afternoon through Monday afternoon, when even the 24-hour totals are predicted to exceed 4 ft on Mount Rainier above about 5000 ft, with amounts exceeding 3 ft on most of the west slopes and volcanic peaks of the Washington Cascades and Olympics:
It will be very interesting to see if such an extreme snowfall prediction actually verifies, especially since the model has given very similar predictions over the past 2 days, with only a minor reduction in predicted amounts and a slight shift in timing by several hours later. The UW model has become very good over the past several years of development, but extreme predictions often tend not to actually occur, and real 24-hour snowfall amounts may end up in the more reasonable 2-3 ft range.
The maximum snowfall rates predicted by the model are also amazing, with 4-5" per hour during the most intense portion of the storm at some locations. This image zoomed in on western Washington shows snowfall during a 3-hour period early Monday, with 12-16" predicted on Mount Rainier during those 3 hours:
This loop shows how the model predictions for snowfall during the 3-day period through 4am Wednesday have evolved between 10 subsequent runs over the last 5 days, the D(model)/D(t). Very consistent in the overall picture throughout with snowfall amounts increasing and decreasing a bit in BC and Oregon (remaining steadiest for Washington), but no major changes other than a significant reduction in snowfall for northern California:
www.atmos.washington.edu/~ovens/wxloop.c...2+v2014021912///+-st
Additional snowfall during the subsequent 3 days ending 4am next Saturday is predicted to be another 2-3 ft over the west slopes and volcanic peaks of the Washington and northern Oregon Cascades, with 1-2 ft in the Olympics, southwestern BC, and southern Oregon Cascades. Almost all of this snowfall is expected to occur before Friday morning:
It appears almost certain now that this storm cycle will finally dissipate and come to an end by Friday, February 21. But unlike after the first major storm cycle of the 2013-14 season (January 7-14, 2014) , there are no indications of a sustained period of high pressure and fair weather over the entire West Coast after this much-larger storm cycle. The extended GFS model out to 384 hours (16 days) shows additional weaker storm systems during the 6-16 day period into the start of March. This is the predicted 24-hour precip throughout that period, click "Loop All" to see all the graphics (3 hour intervals up to 192 hours, 12 hour intervals beyond that):
GFS, North Pacific, 02/16/2014 18UTC, precip_p24
Storm Cycle History:
The first stage of this storm cycle, aimed primarily at the Sierra Nevada (an atmospheric river) and also at Oregon and southern Washington (frontal snowfall along the boundary between a modified Arctic air mass and warmer air to the south), began early on Thursday, February 6, and ended during the day Monday, February 10. This atmospheric river event produced 4-day precipitation totals of up to 10-17" at many sites near Lake Oroville and Lake Tahoe along the west slopes of the northern Sierra Nevada, with snowfall totals reaching 5-7 ft at sites above 8000 ft from Independence Lake south to Sonora Pass with much lesser amounts of 1-2 ft at 6000 ft. Areas farther south such as Yosemite and Mammoth received much less snowfall, only about 2-3 ft even at 9000 ft, and only 2" total at 9000 ft on June Mountain located just north of Mammoth in the rain shadow of the Sierra Crest. Farther north in the northernmost Sierra Nevada, Trinity Alps, and California Cascades, maximum snowfall amounts were generally 1-3 ft above 6000-7000 ft. The frontal snowfall produced 2-3 ft in the Oregon and southern Washington Cascades, with lesser amounts of about 1 ft as far north as Stevens Pass, barely a few inches in the North Cascades, and almost nothing in southwestern BC which remained cold, clear, and dry. Extensive lowland snowfall down to sea level was also produced during this stage, from the southern Willamette Valley in Oregon all the way north past Seattle and Everett, with maximum amounts of over 6" in parts of northwest Oregon and southwest Washington.
The second stage of this storm cycle had already started as the first was ending on Monday morning February 10, and it extended throughout this week to Sunday, February 16, featuring a series of fronts and systems every 1-2 days in strong southwesterly flow over the north Pacific, aimed primarily at Oregon, Washington, and southwestern British Columbia. The first system of the second stage came ashore Monday morning, and the next much stronger system arrived in the same region on Tuesday afternoon, including another atmospheric river event aimed at Oregon, a few hundred miles farther north than the first atmospheric river aimed at the central Sierra Nevada. This atmospheric river stayed in place through Sunday as it weakened and shifted southward into northern California, bringing some more precipitation to that area over the weekend, before it finally faded away Sunday afternoon. This event produced very high precipitation amounts exceeding 13" on Mount Hood over the last 6 days. Additional snowfall amounts during this stage in the mountains of Oregon, Washington, and southwestern British Columbia were in the 2-5 ft range, with the largest amounts in the northern Oregon Cascades from Mount Hood to Mount Bachelor, which continues to have the largest storm total snowfall of any measurement site in the Northwest with over 7 ft at its 6300 ft base and almost 8 ft at its 7300 ft midstation as of Sunday morning. Given the excessive precip amounts on Mount Hood (about 17" total since February 6), storm total snowfall above 7000 ft likely exceeds 10 ft there already, with about 6.5 ft actually measured at Timberline Lodge (5900 ft) and 5.5 ft at Mount Hood Meadows (5400 ft).
The third and final stage of this storm cycle is underway as of Sunday February 16, following the shift of the jet stream from the southwesterly flow of last week to westerly as of Sunday morning, and eventually to northwesterly by midweek. Strong frontal systems are expected to continue to arrive every 1-2 days through Thursday, before the storm cycle fades out by Friday morning, February 21.
See the table in Reply #21 earlier in this thread for more complete snow and precip totals over the February 6-13 period at more than 170 measurement sites from southwestern BC to the southern Sierra Nevada. An updated table will be posted at some point later this week.
So how is the snowpack doing now in the Northwest? Here are the NWAC CLISNO reports for February 1 and February 15 (just released this morning):
CLIMATOLOGICAL SNOWDEPTH INFORMATION
NORTHWEST WEATHER AND AVALANCHE CENTER SEATTLE WASHINGTON
DAY 1 MONTH 2 YEAR 2014
DATA IN INCHES, -99 DENOTES MISSING DATA
CURRENT CLIMATE PER CENT LAST THRU 2013 THRU 2013
DEPTH AVERAGE OF NORMAL YEAR MAX/YEAR MIN/YEAR
HURRICANE 32 79 41 94 162/1999 10/2005
MT BAKER 82 124 66 153 234/1933 17/1981
STEVENS 61 87 70 88 152/1964 10/1981
SNOQUALMIE 44 78 56 74 154/1964 8/1977
STAMPEDE 40 85 47 -99 228/1946 0/2005
MISSION 22 39 56 36 67/2006 8/1976
CRYSTAL 26 59 44 63 112/1999 6/1977
PARADISE 104 132 79 150 240/1969 27/1977
WHITE PASS 25 53 47 46 110/2008 0/2005
TIMBERLINE 75 119 63 126 238/2002 10/1977
MEADOWS 57 98 58 99 184/1974 9/1977
CLIMATOLOGICAL SNOWDEPTH INFORMATION
NORTHWEST WEATHER AND AVALANCHE CENTER SEATTLE WASHINGTON
DAY 15 MONTH 2 YEAR 2014
DATA IN INCHES, -99 DENOTES MISSING DATA
CURRENT CLIMATE PER CENT LAST THRU 2013 THRU 2013
DEPTH AVERAGE OF NORMAL YEAR MAX/YEAR MIN/YEAR
HURRICANE 44 88 50 100 198/1999 17/2005
MT BAKER 107 138 78 161 244/1999 24/1977
STEVENS 80 94 85 86 166/1956 16/1977
SNOQUALMIE 61 85 72 66 168/1949 4/1977
STAMPEDE 53 90 59 63 202/1949 0/1977
MISSION 38 42 90 35 71/1999 9/1976
CRYSTAL 44 61 72 70 117/1999 0/1977
PARADISE 121 143 85 144 264/1972 24/1977
WHITE PASS 41 55 75 46 100/1999 0/1977
TIMBERLINE 101 128 79 122 230/2002 8/1977
MEADOWS 86 106 81 93 187/1974 4/1977
THIS TABLE PRODUCED ON THE 1ST AND 15TH BETWEEN 15 NOVEMBER AND 1 MAY.
AVERAGES, MAXIMUMS AND MINIMUMS EARLY AND LATE IN THE SEASON MAY BE INACCURATE DUE TO LIMITED DATA.
IF THERE IS TIE FOR THE MAXIMUM OR MINIMUM SNOW DEPTH THEN THE LATEST YEAR IS INDICATED.
RECORDS BEGIN: HURRICANE 1979, MT BAKER 1926, STEVENS 1939, SNOQUALMIE 1929, STAMPEDE 1943,
MISSION RIDGE 1970, CRYSTAL 1967, PARADISE 1926, WHITE PASS 1976, TIMBERLINE 1973, MT HOOD MEADOWS 1974.
NOTE: NRCS DATA USED AT STAMPEDE STARTING 2006-2007 SEASON.
Already a significant improvement in snowpack at all sites as of February 15, and the really heavy snowfall hadn't even begun yet over this region by then, so these numbers are already missing another 4-16" increase in snowdepths since yesterday morning. As of Sunday February 16, Hurricane Ridge is up to 62", Mt Baker 121", Stevens 90", Snoqualmie 65", Stampede 58", Mission Ridge 41", Crystal 50", Paradise 130", White Pass 50", Timberline 110", and Meadows 92" -- over 90% of normal at several sites already! By the time this storm cycle ends on Friday February 21, snowdepths will likely be over 100% of normal at all of these sites, and some sites are likely to be 120-150% of normal for that date. When the next NWAC CLISNO report comes out 8 days after that on March 1, most sites should still be near or above normal even without significant additional snowfall during the last week of February.
Several other sites not included in the NWAC report are already over 100% of normal, including Mount Bachelor which has 105" at its 6300 ft base (roughly 110% of normal) and 130" at its 7300 ft midstation as of Sunday morning. The Chilliwack River BCRFC site at 5300 ft in the BC Cascades (just north of the US border near Mount Baker) reached 138" as of Sunday morning, and is at roughly 120% of normal for snowdepth and snow water equivalent. The Brown Top SNOTEL site (5800 ft near Mount Redoubt in the North Cascades) reached 126" today and might be above 100% of normal too, except it was only installed in 2009 and so normal values are not yet established.
I really do love it when all the gloom-and-doom whiners, those complaining about how bad the early-season snowpack is and how that means the season will be a total bust, turn out to be utterly and completely wrong. At least in Washington, northern Oregon, and southwestern BC, it appears certain that they will be wrong very shortly, and the entire season will be saved and set to go, with a substantial snowpack deep enough to last through spring as usual. Unfortunately there is no such hope on the horizon yet for the far southern end of the Cascades in southernmost Oregon and northernmost California, where the snowpack situation remains bleak at barely 10-25% of normal even after a couple feet of snowfall during the first days of this storm cycle. Hopefully the next major storm cycle will be aimed directly at this most desperately drought-afflicted region of the entire West Coast.
Please Log in or Create an account to join the conversation.
- Andrew Carey
- [acarey]
-
- Offline
- Elite Member
-
Less
More
- Posts: 912
- Thank you received: 0
16 Feb 2014 19:05 #220429
by Andrew Carey
Replied by Andrew Carey on topic Re: HUGE storm cycle brings 4-12 ft snow Feb6-21,2014!
As usual, a nice, detailed report, Amar. The big question is: Will Mt. Rainier open the road to Paradise this month?
Please Log in or Create an account to join the conversation.
- Amar Andalkar
- [andalkar]
-
Topic Author
- Offline
- Premium Member
-
Less
More
- Posts: 635
- Thank you received: 0
17 Feb 2014 19:01 #220479
by Amar Andalkar
I really shouldn't speculate about the road opening, that is not something that any computer model can yet forecast! But here goes:
This month: the road will open for certain again in February, barring some type of catastrophe.
This week: not likely on any weekday given 1-3 ft of new snow expected each day through Thursday.
But the storm cycle fades out around Friday, so a weekend opening seems reasonable (and Friday is perhaps possible).
Replied by Amar Andalkar on topic Re: HUGE storm cycle brings 4-12 ft snow Feb6-21,2014!
As usual, a nice, detailed report, Amar. The big question is: Will Mt. Rainier open the road to Paradise this month?
I really shouldn't speculate about the road opening, that is not something that any computer model can yet forecast! But here goes:
This month: the road will open for certain again in February, barring some type of catastrophe.
This week: not likely on any weekday given 1-3 ft of new snow expected each day through Thursday.
But the storm cycle fades out around Friday, so a weekend opening seems reasonable (and Friday is perhaps possible).
Please Log in or Create an account to join the conversation.
- Amar Andalkar
- [andalkar]
-
Topic Author
- Offline
- Premium Member
-
Less
More
- Posts: 635
- Thank you received: 0
17 Feb 2014 19:37 - 17 Feb 2014 20:34 #220481
by Amar Andalkar
Replied by Amar Andalkar on topic Re: HUGE storm cycle brings 4-12 ft snow Feb6-21,2014!
Update #10: 264 hours after initial post, 2-8 ft of snow has already fallen in southwest BC, Washington, Oregon, and California,
including 1-3 ft in the past 24 hours, with an additional 3-7 ft predicted the rest of this week for WA, OR, and southwest BC!
[size=small]Missed the deepest powder day of the 2013-14 season at Crystal Mountain today, despite leaving Seattle at 5:30am with a good group and driving all the way up there, through heavy snowfall after Enumclaw and ridiculous stop-and-go traffic from Greenwater onward (plus several downed trees and limbs partially blocking the highway) -- only to find the ski area closed for the day due to a power outage and backup generator outage too. So lame, 6 hours of often-stressful driving for zero skiing -- made even worse later when we found out that Chinook Express had opened for FREE (at least for a couple hours) for those who had made it up the Boulevard before its closure, as we had. Would have been nice to ski at least a few runs of powder, but we were told "closed for the entire day" by Crystal employees as we reached the parking lot, and so the decision to turn around was made for us. Oh well, can't win 'em all, especially so it seems at Crystal on big storm days! Anyway, on to the update:[/size]
[size=small]Animation of the Crystal Mountain Campbell Basin Snow Stake Cam from when the snowfall began around 3pm Sunday until the power failed after 5:20am Monday. The 24-hour snowfall total eventually exceeded 2 ft by midday.[/size]
The climax of this storm cycle is ongoing in the Pacific Northwest! The largest 1-day snowfall of the entire storm cycle thus far for Washington has occurred over the last 24 hours since Sunday afternoon, with new snowfall of over 2 ft at many sites throughout the Cascades and Olympics. The period of maximum sustained snowfall for Washington and Oregon is expected to continue through Thursday, with several more feet of new powder at further lowering snow levels. Epic!
Another day later, and 2 more subsequent runs of the UW WRF-GFS model at 12-hour intervals continue to predict large snowfall amounts of 3-7 ft over the rest of this week for Washington, Oregon, and southwest BC. This is in addition to 2-8 ft of snow which has already fallen over the past 11 days since this storm cycle began on February 6 at most mountain measurement sites along the Pacific coast from Alyeska near Anchorage, Alaska, all the way south to Mammoth Mountain, a span of about 2100 miles as the crow flies (and over 3100 miles by car ). The snowfall over this vast distance is all due to low-pressure systems spawned from the same upper-level parent low in the Gulf of Alaska which has been associated with this entire storm cycle.
The predicted amounts for both precip and snowfall during this week remain similar to those predicted during the last several days, an excellent sign of stability in the model's predictions, with a continuing increase in overall storm totals as further storm systems came into view this week. If these predictions verify and the storm cycle continues as expected for the rest of this week, which is now a near-certainty, this will end up solidly in the HUGE storm cycle category with 15-day snowfall totals exceeding 10-12 ft at many sites especially above 4000-5000 ft in the Washington and northern Oregon Cascades plus southwestern BC.
The NWS's GFS model and their Quantitative Precipitation Forecasts still show up to 4-5" more precip over the rest of this week for the mountains of Washington, with 2-3" in southwestern BC and northern Oregon, and much smaller amounts of only a fraction of an inch extending south into the California Cascades and northern Sierra. Here is total precipitation in inches predicted over the next 7 days through Monday afternoon, February 24, with almost all of that shown in the Pacific Northwest falling in the next 5 days though Saturday:
Following Saturday's storm systems which brought snow from Alaska to California, there was a minor lull early Sunday with snowfall decreasing over the entire span and skies clearing completely in California. But the next much stronger system moved ashore immediately by midday aimed at Vancouver Island and the Olympics, pushing on to the southwestern BC mainland and Washington Cascades by Sunday afternoon. The snowfall jackpot was in the Washington Cascades this time, with 24-hour snowfall amounts from Sunday afternoon to Monday afternoon exceeding 2 ft at many measurement sites from the North Cascades south to Mounts Rainier, Adams, and Saint Helens, with lesser amounts of around 1 ft in southwestern BC and on Mount Hood, and only a few inches extending south to Mount Bachelor. The heaviest snowfall shifted south into the Oregon Cascades during the day Monday, but snow also continued in Washington throughout the day.
Maximum 24-hour totals include 30" at Paradise (and the first 28" of that in a 16-hour period), 29" atop Alpental, and 25" at Stevens Pass and Crystal Mountain (both the base and Green Valley). Several SNOTEL sites also recorded increases in snowdepth of 20-26", implying snowfalls of at least 24-30" or more (due to settlement, the increase in total snowdepth is always smaller than the snowfall). The most intense snowfall rates occurred during Sunday evening into early Monday, with 2-4" per hour recorded at times at several different sites.
The large snowfalls also sent many measurement sites in Washington above 100% of normal snowdepth for the first time this season. As of Monday evening February 17, Hurricane Ridge is up to 74" (84% of normal), Mt Baker 133" (96%), Stevens 109" (116%), Snoqualmie 86" (101%), Stampede 81" (90%), Mission Ridge 45" (107%), Crystal 75" (123%), Paradise 155" (108%), White Pass 62" (113%), Timberline 116" (90%), and Meadows 100" (94%). The 155" at Mount Rainier Paradise is apparently now the largest snowdepth of any telemetry site in North America (as far as I know, unless I missed something), a familiar position for Paradise in many a season. Other telemetry sites in the same ballpark include the Chilliwack River BCRFC site at 5300 ft in the BC Cascades (just north of the US border near Mount Baker) at 147", Brown Top SNOTEL (5800 ft near Mount Redoubt in the North Cascades) at 145", Grace Lakes (Stevens Pass, 4800 ft) at 145", the top of White Pass Ski Area (5800 ft) at 139", Lyman Lake SNOTEL (6000 ft near Holden Village) at 138", and Mount Baker Ski Area at 133". Manually measured sites in that range include 147" atop Alpental and 138" at Mount Bachelor mid-mountain (7300 ft).
The next strong system will arrive on Tuesday morning, once again aimed at southwestern BC and Washington, then shifting southward to Oregon by the afternoon and even into northernmost California overnight. Another weaker wave of snowfall comes ashore on Wednesday morning, then the next strong system is projected to arrive late Wednesday into southwestern BC and Washington again, lasting through the day Thursday with snowfall again shifting into Oregon.
Snowfall during the next 3 days through 4pm Thursday is predicted to be 3-6 ft over the west slopes and volcanic peaks of the Washington and northern Oregon Cascades, the Olympics, and southwestern BC, with 2-4 ft in the southern Oregon Cascades and perhaps up to 6" extending into the California Cascades and Trinity Alps on Tuesday-Wednesday, with barely a couple inches in the northern Sierra Nevada:
Higher resolution version of that, showing the Pacific Northwest and also zoomed in on Washington and Oregon:
Maximum snowfall amounts of 4-6 ft (marked by white inside yellow) are shown along the west slopes and volcanic peaks of the Washington and northern Oregon Cascades plus the Olympics. The most intense portion of that period is from Tuesday morning to Wednesday morning, when 24-hour totals of 2-3 ft are predicted for the west slopes and volcanic peaks of the Washington and Oregon Cascades plus the Olympics:
This loop shows how the model predictions for snowfall during the 3-day period through 4pm Thursday have evolved between 10 subsequent runs over the last 5 days, the D(model)/D(t). Very consistent in the overall picture throughout with snowfall amounts increasing and decreasing a bit in BC and Oregon (remaining steadiest for Washington), but no major changes other than a significant reduction in snowfall for northern California:
www.atmos.washington.edu/~ovens/wxloop.c...2+v2014022100///+-st
Additional snowfall during the subsequent 3 days ending 4pm next Sunday is predicted to be another 1-2 ft over the northern Washington Cascades and southwestern BC. Almost all of this snowfall is expected to occur from Friday evening into Saturday afternoon:
This represents an extension of this storm cycle from earlier model runs, by roughly another 24-36 hours and only in the northern Washington Cascades and southwestern BC, where the northwesterly jet stream shifting eastward onto the Pacific coast is now projected to bring an additional moderate system ashore on Friday evening.
However that currently appears to be the end of this storm cycle, with the weekend looking dry especially south of Washington on Saturday and throughout the region on Sunday. Details may certainly change as that period draws closer, as it is currently 5-7 days out, near the limit of accurate numerical weather prediction. Additional snowfall during the 1 day period ending 4pm next Monday is nearly zero over the Pacific Northwest, quite a sharp contrast to any previous graphic shown in this entire thread:
After the mostly dry weekend, the extended GFS model out to 384 hours (16 days) shows additional weaker storm systems during the 9-16 day period from the middle of next week into the start of March. This is the predicted 24-hour precip throughout that period, click "Loop All" to see all the graphics (3 hour intervals up to 192 hours, 12 hour intervals beyond that):
GFS, North Pacific, 02/17/2014 18UTC, precip_p24
Please Log in or Create an account to join the conversation.
- Amar Andalkar
- [andalkar]
-
Topic Author
- Offline
- Premium Member
-
Less
More
- Posts: 635
- Thank you received: 0
17 Feb 2014 19:46 - 17 Feb 2014 23:08 #220506
by Amar Andalkar
Replied by Amar Andalkar on topic Re: HUGE storm cycle brings 4-12 ft snow Feb6-21,2014!
So how did the model's predictions of extreme snowfall on Mount Rainier pan out? As posted in Updates #8 and #9 above, the model was showing over 4 ft of snowfall in a 24-hour period from Sunday afternoon through Monday afternoon on Mount Rainier above about 5000 ft, with amounts exceeding 3 ft on most of the west slopes and volcanic peaks of the Washington Cascades and Olympics. As I suspected it would, the actual snowfall amounts fell short of the extreme predictions (at least at any measurement sites), but totals were still impressive with 30" at Paradise in 24 hours (and the first 28" of that in a 16-hour period). The extreme snowfall rates of 4-5" per hour also failed to quite verify, but just barely, with rates of up to 4" per hour during some hours at Paradise:
[size=small]
Northwest Avalanche Center Northwest Avalanche Center
Paradise, Mt Rainier National Park, Washington Camp Muir, Mt Rainier National Park, Washington
Wind speed not reliable and may record periodically Wind gages unheated and may rime
MM/DD Hour Temp RH Wind Wind Wind Hour Total 24 Hr Total Solar MM/DD Hour Temp RH Wind Wind Wind Wind Solar
PST F % Avg Max Dir Prec Prec Snow Snow W/m2 PST F % Min Avg Max Dir W/m2
5400' 5400' 5380' 5380' 5380' 5400' 5400' 5400' 5400' 5400' 10110' 10110' 10110' 10110' 10110' 10110' 10110'
2 16 1400 23 96 0 0 275 0 0 12 130 201 2 16 1400 5 92 30 40 47 286 303
2 16 1500 24 96 0 0 290 0 0 -0 129 126 2 16 1500 3 92 33 41 54 286 132
2 16 1600 24 97 0 0 280 .01 .01 0 127 45 2 16 1600 6 93 36 43 52 286 66
2 16 1700 24 97 0 0 278 .01 .02 2 130 15 2 16 1700 8 94 38 46 59 286 25
2 16 1800 25 97 0 0 282 .06 .08 2 132 1 2 16 1800 8 94 37 47 60 286 3
2 16 1900 25 98 0 0 278 .07 .15 4 133 0 2 16 1900 10 95 41 50 64 286 0
2 16 2000 26 98 0 0 281 .08 .23 5 134 0 2 16 2000 11 95 42 55 68 286 0
2 16 2100 27 98 0 0 273 .11 .34 6 --- 0 2 16 2100 11 95 46 58 67 286 0
2 16 2200 27 98 0 0 266 .16 .5 8 136 0 2 16 2200 12 95 50 61 75 286 0
2 16 2300 28 98 0 0 260 .17 .67 10 138 0 2 16 2300 12 95 50 63 72 286 0
2 17 0 28 99 0 0 262 .17 .84 12 141 0 2 17 0 12 95 53 66 77 286 0
2 17 100 28 99 0 0 267 .13 .97 13 140 0 2 17 100 12 95 53 64 72 286 0
2 17 200 28 99 0 0 273 .1 1.07 -- 142 0 2 17 200 11 95 41 52 67 286 0
2 17 300 27 98 0 0 269 .08 1.15 16 144 0 2 17 300 10 95 35 47 61 286 0
2 17 400 27 98 0 0 268 .17 1.32 20 148 0 2 17 400 11 95 33 43 62 286 0
2 17 500 27 98 0 0 262 .23 1.55 -- 149 0 2 17 500 13 96 21 40 57 286 0
2 17 600 27 98 0 0 255 .2 1.75 23 --- 0 2 17 600 12 95 20 37 51 286 0
2 17 700 27 98 0 0 263 .19 1.94 27 155 0 2 17 700 11 95 21 35 45 286 0
2 17 800 26 98 0 0 261 .12 2.06 28 156 5 2 17 800 12 95 25 39 54 286 16
2 17 900 27 98 0 0 257 .02 2.08 28 155 28 2 17 900 11 95 31 48 70 286 75
2 17 1000 27 98 0 0 264 .08 2.16 28 155 51 2 17 1000 11 94 26 46 68 286 147
2 17 1100 28 98 0 0 262 .03 2.19 29 155 114 2 17 1100 9 94 27 38 53 286 344
2 17 1200 28 98 0 0 259 .04 2.23 28 153 170 2 17 1200 9 94 24 39 63 286 430
2 17 1300 26 98 0 0 262 .05 2.28 30 155 149 2 17 1300 7 93 23 41 61 286 485
2 17 1400 26 98 0 0 259 .02 2.3 29 155 162 2 17 1400 5 92 17 42 62 286 319
2 17 1500 26 97 0 0 260 .03 2.33 30 155 113 2 17 1500 5 92 28 41 57 286 224
2 17 1600 25 97 0 0 262 .01 2.34 29 155 113 2 17 1600 4 92 27 42 56 286 144
2 17 1700 24 97 0 0 261 .02 2.36 0 155 35 2 17 1700 5 92 27 40 59 286 46
2 17 1800 24 97 0 0 262 .02 2.38 0 155 4 2 17 1800 4 92 28 42 54 286 5
2 17 1900 23 97 0 0 267 .01 2.39 0 155 0 2 17 1900 4 92 24 43 59 286 0
2 17 2000 23 97 0 0 261 .03 2.42 1 155 0 2 17 2000 5 92 24 37 50 286 0
2 17 2100 23 97 0 0 270 0 2.42 1 155 0 2 17 2100 4 92 32 41 53 286 0
2 17 2200 24 97 0 0 268 0 2.42 1 154 0 2 17 2200 6 93 24 39 50 286 0
Northwest Avalanche Center Northwest Avalanche Center
Crystal Mountain Ski Area, Washington Green Valley, Crystal Mountain Ski Area
Power out at ski area, precip gage not heating 2-17 Strong winds may affect snowdepth readings
MM/DD Hour Temp Temp RH RH Wind Wind Wind Wind Hour Total 24 Hr Total MM/DD Hour Temp 24 Hr Total
PST F F % % Min Avg Max Dir Prec Prec Snow Snow PST F Snow Snow
6830' 4570' 6830' 4570' 6830' 6830' 6830' 6830' 4570' 4570' 4570' 4570' 6230' 6230' 6230'
2 16 1400 17 26 96 87 13 32 56 252 0 0 0 49 2 16 1400 17 0 97
2 16 1500 18 27 96 92 21 40 68 219 0 0 0 49 2 16 1500 18 1 97
2 16 1600 19 27 97 96 17 35 66 212 .01 .01 1 49 2 16 1600 18 1 98
2 16 1700 19 27 97 98 17 39 67 178 .04 .05 0 50 2 16 1700 18 6 98
2 16 1800 20 27 98 99 14 32 55 250 .05 .1 -- 51 2 16 1800 19 8 99
2 16 1900 20 28 98 99 14 27 48 240 .09 .19 6 53 2 16 1900 19 8 100
2 16 2000 21 28 98 99 13 33 57 210 .1 .29 -- 54 2 16 2000 20 7 100
2 16 2100 22 29 98 100 19 39 60 261 .12 .41 9 56 2 16 2100 20 9 102
2 16 2200 22 29 98 100 21 45 73 247 .13 .54 10 58 2 16 2200 21 10 102
2 16 2300 23 29 99 100 26 49 72 233 .15 .69 12 60 2 16 2300 21 13 104
2 17 0 23 30 99 100 27 53 85 242 .17 .86 15 62 2 17 0 22 15 106
2 17 100 24 30 99 100 20 49 78 273 .18 1.04 17 65 2 17 100 22 15 104
2 17 200 23 30 99 100 9 28 71 228 .13 1.17 19 67 2 17 200 22 16 105
2 17 300 23 28 98 100 19 39 64 220 .05 1.22 -- 68 2 17 300 21 16 107
2 17 400 22 30 98 100 6 29 56 212 .08 1.3 20 68 2 17 400 21 17 107
2 17 500 23 30 99 100 6 17 35 214 .08 1.38 -- 69 2 17 500 21 -- 107
2 17 600 22 29 98 100 4 16 32 248 .03 1.41 -- 71 2 17 600 20 18 109
2 17 700 22 29 98 100 11 22 37 226 .01 1.42 1 73 2 17 700 21 22 112
2 17 800 22 29 98 100 4 17 39 228 0 1.42 2 73 2 17 800 21 22 112
2 17 900 23 30 98 99 5 14 31 249 0 1.42 2 74 2 17 900 22 23 113
2 17 1000 23 30 98 99 4 14 40 244 0 1.42 3 72 2 17 1000 22 23 112
2 17 1100 23 31 98 97 3 14 27 253 0 1.42 3 75 2 17 1100 23 0 112
2 17 1200 23 33 98 95 6 19 35 141 0 1.42 -- 68 2 17 1200 24 0 112
2 17 1300 21 29 98 98 6 22 50 296 0 1.42 5 68 2 17 1300 22 1 113
2 17 1400 21 30 97 95 9 26 63 267 0 1.42 -- 68 2 17 1400 22 2 113
2 17 1500 20 30 97 94 11 27 60 244 0 1.42 5 65 2 17 1500 21 2 113
2 17 1600 20 30 97 94 12 25 47 294 0 1.42 5 68 2 17 1600 20 2 112
2 17 1700 19 27 97 97 8 24 45 260 0 1.42 5 68 2 17 1700 17 3 113
2 17 1800 18 26 97 99 8 25 46 257 0 1.42 6 68 2 17 1800 16 -- 114
2 17 1900 19 26 97 98 6 18 35 267 0 1.42 9 71 2 17 1900 16 6 117
2 17 2000 17 26 96 97 9 25 44 261 0 1.42 10 71 2 17 2000 15 7 117
2 17 2100 17 25 96 97 7 23 47 285 .11 1.53 10 70 Power 2 17 2100 14 7 116
2 17 2200 18 25 96 98 8 23 43 262 .14 1.67 10 70 restored 2 17 2200 15 7 116
[/size]
Please Log in or Create an account to join the conversation.