- Posts: 635
- Thank you received: 0
How unusual is the current low PNW snowpack?
- Amar Andalkar
- [andalkar]
-
 Topic Author
- Offline
- Premium Member
-

Less
More
16 Dec 2013 03:34 - 16 Dec 2013 17:31 #211304
by Amar Andalkar
How unusual is the current low PNW snowpack? was created by Amar Andalkar
How unusual is the current low snowpack in the Pacific Northwest? Does it mean that this whole season is likely to be a bust?
There's seems to be some rising belief among many people that the currently well-below-normal snowpack in the Pacific Northwest is very unusual, something not seen in many years. Perhaps even more people seem to believe that the current low snowpack may portend below-normal snowfall and snowpack throughout the winter, even that the whole season may be a bust. The 11pm TV newscasts were rife with just such speculation, including major segments filmed at Snoqualmie Pass showing the thin brushy snowpack.
I suspected that these beliefs have little basis in fact, nor would they have much support in the actual snowpack data. But as a scientist, I always prefer to scrutinize the data before jumping to conclusions. So I decided to look through the NWAC's twice-monthly climatological snowdepth information (www.nwac.us/data/CLISNO) for the last 17 years, to find out how many of those seasons had significantly below-normal snowpack as of December 1 and 15, and then to see whether those seasons remained below normal overall by season's end. (Archived CLISNO data are not available on the NWAC website, but files back to 1997 have been archived on my website at www.skimountaineer.com/CascadeSki/CascadeSnowNWAC.html .)
The following list shows the years which have had a December 15 snowpack below about 70% of normal throughout these sites in Washington and northern Oregon. Although the current snowpack is well below normal, it is nevertheless well above the minimum values recorded for December 15 at most of these sites (many of the record lows are from 1976, as the 1976-77 season was a severe drought year throughout the West Coast, and the worst overall snow year over that entire region in the last 70+ years). However, new record lows for December 15 were set yesterday at Crystal Mountain base (barely) and Hurricane Ridge (by a significant margin, about half the previous minimum of 19" in 1980 -- although the actual record low appears to be 5" in 2004 as seen in that data farther below, revised values from the historical CLISNO data file I acquired several years ago courtesy of NWAC indicate that the correct depth at Hurricane Ridge on 15Dec2004 was 21").
2013-2014[size=small]
CLIMATOLOGICAL SNOWDEPTH INFORMATION CLIMATOLOGICAL SNOWDEPTH INFORMATION
NORTHWEST WEATHER AND AVALANCHE CENTER SEATTLE WASHINGTON NORTHWEST WEATHER AND AVALANCHE CENTER SEATTLE WASHINGTON
DAY 1 MONTH 12 YEAR 2013 DAY 15 MONTH 12 YEAR 2013
DATA IN INCHES, -99 DENOTES MISSING DATA DATA IN INCHES, -99 DENOTES MISSING DATA
CURRENT CLIMATE PER CENT LAST THRU 2012 THRU 2012 CURRENT CLIMATE PER CENT LAST THRU 2012 THRU 2012
DEPTH AVERAGE OF NORMAL YEAR MAX/YEAR MIN/YEAR DEPTH AVERAGE OF NORMAL YEAR MAX/YEAR MIN/YEAR
HURRICANE 5 32 16 38 70/2006 0/2002 HURRICANE 10 50 20 56 83/2006 19/1980
MT BAKER 32 49 65 51 140/1948 1/1939 MT BAKER 43 68 63 94 168/1948 16/1976
STEVENS 18 31 58 25 67/1942 0/2002 STEVENS 26 44 59 65 80/1973 5/1976
SNOQUALMIE 5 25 20 12 84/1955 0/2008 SNOQUALMIE 9 36 25 41 116/1948 0/1976
STAMPEDE 5 30 17 8 93/1945 0/2008 STAMPEDE 10 42 24 35 119/1948 9/1976
MISSION 8 17 47 16 36/1983 0/2008 MISSION 14 24 58 26 49/2006 4/1975
CRYSTAL 4 25 16 12 59/2001 0/2008 CRYSTAL 9 35 26 35 72/1996 10/1979
PARADISE 31 48 65 37 125/1994 1/2008 PARADISE 42 68 62 85 170/1948 4/1976
WHITE PASS 0 19 0 3 53/1984 0/2008 WHITE PASS 4 29 14 23 73/1996 2/1989
TIMBERLINE 21 46 46 35 137/1984 0/2002 TIMBERLINE 27 64 42 63 145/1984 0/1976
MEADOWS 18 40 45 26 113/1984 5/2008 MEADOWS 24 55 44 49 118/1984 8/1989
AVERAGES, MAXIMUMS AND MINIMUMS EARLY AND LATE IN THE SEASON MAY BE AVERAGES, MAXIMUMS AND MINIMUMS EARLY AND LATE IN THE SEASON MAY BE
INACCURATE DUE TO LIMITED DATA. INACCURATE DUE TO LIMITED DATA.
IF THERE IS TIE FOR THE MAXIMUM OR MINIMUM SNOW DEPTH THEN THE IF THERE IS TIE FOR THE MAXIMUM OR MINIMUM SNOW DEPTH THEN THE
LATEST YEAR IS INDICATED. LATEST YEAR IS INDICATED.
RECORDS BEGIN: HURRICANE 1979, MT BAKER 1926, STEVENS 1939, RECORDS BEGIN: HURRICANE 1979, MT BAKER 1926, STEVENS 1939,
SNOQUALMIE 1929, STAMPEDE 1943, MISSION RIDGE 1970, SNOQUALMIE 1929, STAMPEDE 1943, MISSION RIDGE 1970,
CRYSTAL 1967, PARADISE 1926, WHITE PASS 1976, CRYSTAL 1967, PARADISE 1926, WHITE PASS 1976,
TIMBERLINE 1973, MT HOOD MEADOWS 1974. TIMBERLINE 1973, MT HOOD MEADOWS 1974.
NOTE: NRCS DATA USED AT STAMPEDE STARTING 2006-2007 SEASON. NOTE: NRCS DATA USED AT STAMPEDE STARTING 2006-2007 SEASON.
[/size]
2008-2009[size=small]
CLIMATOLOGICAL SNOWDEPTH INFORMATION CLIMATOLOGICAL SNOWDEPTH INFORMATION
NORTHWEST WEATHER AND AVALANCHE CENTER SEATTLE WASHINGTON NORTHWEST WEATHER AND AVALANCHE CENTER SEATTLE WASHINGTON
DAY 1 MONTH 12 YEAR 2008 DAY 15 MONTH 12 YEAR 2008
DATA IN INCHES, -99 DENOTES MISSING DATA DATA IN INCHES, -99 DENOTES MISSING DATA
CURRENT CLIMATE PER CENT LAST THRU 2007 THRU 2007 CURRENT CLIMATE PER CENT LAST THRU 2007 THRU 2007
DEPTH AVERAGE OF NORMAL YEAR MAX/YEAR MIN/YEAR DEPTH AVERAGE OF NORMAL YEAR MAX/YEAR MIN/YEAR
HURRICANE 2 32 6 13 70/2006 0/2002 HURRICANE 20 52 38 28 83/2006 19/1980
MT BAKER 7 50 14 34 140/1948 1/1939 MT BAKER 36 68 53 52 168/1948 16/1976
STEVENS 4 32 12 21 67/1942 0/2002 STEVENS 23 44 52 39 80/1973 5/1976
SNOQUALMIE 0 25 0 17 84/1955 0/2002 SNOQUALMIE 17 36 47 33 116/1948 0/1976
STAMPEDE 0 30 0 9 93/1945 0/2002 STAMPEDE 15 44 34 22 119/1948 9/1976
MISSION 0 18 0 11 36/1983 0/2002 MISSION 6 25 24 14 49/2006 4/1975
CRYSTAL 0 25 0 20 59/2001 0/2002 CRYSTAL 22 35 63 23 72/1996 10/1979
PARADISE 1 48 2 33 125/1994 1/1976 PARADISE 45 68 66 48 170/1948 4/1976
WHITE PASS 0 20 0 19 53/1984 0/2002 WHITE PASS 20 29 69 8 73/1996 2/1989
TIMBERLINE 5 46 11 38 137/1984 0/2002 TIMBERLINE 35 65 54 38 145/1984 0/1976
MEADOWS 5 40 12 41 113/1984 7/2004 MEADOWS 29 56 52 38 118/1984 8/1989
[/size]
2007-2008[size=small]
CLIMATOLOGICAL SNOWDEPTH INFORMATION CLIMATOLOGICAL SNOWDEPTH INFORMATION
NORTHWEST WEATHER AND AVALANCHE CENTER SEATTLE WASHINGTON NORTHWEST WEATHER AND AVALANCHE CENTER SEATTLE WASHINGTON
DAY 1 MONTH 12 YEAR 2007 DAY 15 MONTH 12 YEAR 2007
DATA IN INCHES, -99 DENOTES MISSING DATA DATA IN INCHES, -99 DENOTES MISSING DATA
CURRENT CLIMATE PER CENT LAST THRU 2006 THRU 2006 CURRENT CLIMATE PER CENT LAST THRU 2006 THRU 2006
DEPTH AVERAGE OF NORMAL YEAR MAX/YEAR MIN/YEAR DEPTH AVERAGE OF NORMAL YEAR MAX/YEAR MIN/YEAR
HURRICANE 13 33 39 70 70/2006 0/2002 HURRICANE 28 53 53 83 83/2006 19/1980
MT BAKER 34 50 68 117 140/1948 1/1939 MT BAKER 52 68 76 113 168/1948 16/1976
STEVENS 21 32 66 55 67/1942 0/2002 STEVENS 39 44 89 77 80/1973 5/1976
SNOQUALMIE 17 25 68 51 84/1955 0/2002 SNOQUALMIE 33 36 92 60 116/1948 0/1976
STAMPEDE 9 31 29 -99 93/1945 0/2002 STAMPEDE 22 44 50 -99 119/1948 9/1976
MISSION 11 18 61 19 36/1983 0/2002 MISSION 14 25 56 49 49/2006 4/1975
CRYSTAL 20 25 80 55 59/2001 0/2002 CRYSTAL 23 35 66 56 72/1996 10/1979
PARADISE 33 48 69 -99 125/1994 1/1976 PARADISE 48 68 71 90 170/1948 4/1976
WHITE PASS 19 20 95 40 53/1984 0/2002 WHITE PASS 8 30 27 -99 73/1996 2/1989
TIMBERLINE 38 46 83 83 137/1984 0/2002 TIMBERLINE 38 65 58 73 145/1984 0/1976
MEADOWS 41 40 102 69 113/1984 7/2004 MEADOWS 38 56 68 66 118/1984 8/1989
[/size]
2004-2005[size=small]
CLIMATOLOGICAL SNOWDEPTH INFORMATION CLIMATOLOGICAL SNOWDEPTH INFORMATION
NORTHWEST WEATHER AND AVALANCHE CENTER NORTHWEST WEATHER AND AVALANCHE CENTER
ISSUED THROUGH NATIONAL WEATHER SERVICE SEATTLE ISSUED THROUGH NATIONAL WEATHER SERVICE SEATTLE
FOR : DAY 1 MONTH 12 YEAR 2004 FOR : DAY 15 MONTH 12 YEAR 2004
DATA IN INCHES, -99 DENOTES MISSING DATA DATA IN INCHES, -99 DENOTES MISSING DATA
CURRENT CLIMATE PER CENT LAST THRU 2003 THRU 2003 CURRENT CLIMATE PER CENT LAST THRU 2003 THRU 2003
DEPTH AVERAGE OF NORMAL YEAR MAX/YEAR MIN/YEAR DEPTH AVERAGE OF NORMAL YEAR MAX/YEAR MIN/YEAR
HURRICANE 5 32 16 33 64/1994 0/2002 HURRICANE 5 55 9 62 80/1996 19/1980
MT BAKER 25 49 51 72 140/1948 1/1939 MT BAKER 40 68 59 106 168/1948 16/1976
STEVENS 13 31 42 41 67/1942 0/2002 STEVENS 22 44 50 72 80/1973 5/1976
SNOQUALMIE 10 25 40 30 84/1955 0/2002 SNOQUALMIE 11 36 31 68 116/1948 0/1976
STAMPEDE -99 31 -99 33 93/1945 0/2002 STAMPEDE 12 45 27 66 119/1948 9/1976
MISSION 1 19 5 16 36/1983 0/2002 MISSION 6 25 24 29 47/1983 4/1975
CRYSTAL 6 25 24 29 59/2001 0/2002 CRYSTAL 13 35 37 51 72/1996 10/1979
PARADISE 25 48 52 59 125/1994 1/1976 PARADISE 36 69 52 103 170/1948 4/1976
WHITE PASS 5 19 26 17 53/1984 0/2002 WHITE PASS 4 31 13 47 73/1996 2/1989
TIMBERLINE 28 46 61 50 137/1984 0/2002 TIMBERLINE 44 66 67 89 145/1984 0/1976
MEADOWS 7 41 17 36 113/1984 8/2002 MEADOWS 19 57 33 61 118/1984 8/1989
[/size]
2002-2003[size=small]
CLIMATOLOGICAL SNOWDEPTH INFORMATION CLIMATOLOGICAL SNOWDEPTH INFORMATION
NORTHWEST WEATHER AND AVALANCHE CENTER NORTHWEST WEATHER AND AVALANCHE CENTER
ISSUED THROUGH NATIONAL WEATHER SERVICE SEATTLE ISSUED THROUGH NATIONAL WEATHER SERVICE SEATTLE
FOR : DAY 1 MONTH 12 YEAR 2002 FOR : DAY 15 MONTH 12 YEAR 2002
DATA IN INCHES, -99 DENOTES MISSING DATA DATA IN INCHES, -99 DENOTES MISSING DATA
CURRENT CLIMATE PER CENT LAST THRU 2001 THRU 2001 CURRENT CLIMATE PER CENT LAST THRU 2001 THRU 2001
DEPTH AVERAGE OF NORMAL YEAR MAX/YEAR MIN/YEAR DEPTH AVERAGE OF NORMAL YEAR MAX/YEAR MIN/YEAR
MT BAKER 16 49 33 58 140/1948 1/1939 MT BAKER 31 68 46 104 168/1948 16/1976
STEVENS 0 32 0 37 67/1942 0/1941 STEVENS 19 44 43 66 80/1973 5/1976
SNOQUALMIE 0 25 0 44 84/1955 1/1969 SNOQUALMIE 12 36 33 61 116/1948 0/1976
STAMPEDE 0 31 0 41 93/1945 0/1976 STAMPEDE -99 44 -99 -99 119/1948 9/1976
PARADISE 8 48 17 68 125/1994 1/1976 PARADISE 36 69 52 114 170/1948 4/1976
WHITE PASS 0 20 0 30 53/1984 1/1999 WHITE PASS 12 31 39 42 73/1996 2/1989
MT HOOD 8 43 19 60 113/1984 10/1995 MT HOOD 10 59 17 110 118/1984 8/1989
[/size]
1997-1998[size=small]
CLIMATOLOGICAL SNOWDEPTH INFORMATION CLIMATOLOGICAL SNOWDEPTH INFORMATION
NORTHWEST WEATHER AND AVALANCHE CENTER NORTHWEST WEATHER AND AVALANCHE CENTER
ISSUED THROUGH NATIONAL WEATHER SERVICE SEATTLE ISSUED THROUGH NATIONAL WEATHER SERVICE SEATTLE
DAY 1 MONTH 12 YEAR 1997 DAY 15 MONTH 12 YEAR 1997
DATA IN INCHES, -99 DENOTES MISSING DATA DATA IN INCHES, -99 DENOTES MISSING DATA
CURRENT CLIMATE PER CENT THIS DATE CURRENT CLIMATE PER CENT THIS DATE
DEPTH AVERAGE OF NORMAL LAST YEAR DEPTH AVERAGE OF NORMAL LAST YEAR
MT BAKER 21 49 43 50 MT BAKER 33 67 49 130
STEVENS 18 32 56 41 STEVENS 25 44 57 70
SNOQUALMIE 8 25 32 35 SNOQUALMIE 16 35 46 72
STAMPEDE 10 32 31 49 STAMPEDE 20 45 44 77
PARADISE 48 48 100 77 PARADISE 51 68 75 130
WHITE PASS 12 22 55 35 WHITE PASS 16 32 50 73
MT HOOD 19 45 42 46 MT HOOD 28 58 48 116
[/size]
So 6 years out of the past 17 (including this year) have had a December 15 snowpack below roughly 70% of normal throughout these sites, with 3 of those years below roughly 60% of normal (2013, 2004, 2002). This is a fairly small set of data, but it certainly appears that well-below-normal snowpacks as of December 15 occur approximately every 3-5 years, with snowpacks as low as the current one occurring 1-2 times per decade. Therefore the current low snowpack is not really that unusual.
[size=small](Note: these posts were split due to the 20,000 character limit per post)[/size]
Please Log in or Create an account to join the conversation.
- Amar Andalkar
- [andalkar]
-
Topic Author
- Offline
- Premium Member
-
Less
More
- Posts: 635
- Thank you received: 0
16 Dec 2013 03:36 - 16 Dec 2013 11:45 #211305
by Amar Andalkar
Replied by Amar Andalkar on topic Re: How unusual is the current low PNW snowpack?
So how strongly does a well-below-normal December 15 snowpack correlate with an overall low snowfall and low snowpack throughout the winter and spring?
The standard one-parameter measure of an entire season's snowpack is the April 1 snowdepth, which correlates well with total season snowfall at these type of high-snowfall mountain sites. Shown below are the April 1 and April 15 CLISNO data recorded 4 months later on in each of the seasons shown above (except the current season, obviously). Snowfall totals for the entire season are also shown, along with calculated percents of normal, for the only 3 of these sites where such data is readily available.
2008-2009 -- weak La Niña[size=small]
CLIMATOLOGICAL SNOWDEPTH INFORMATION CLIMATOLOGICAL SNOWDEPTH INFORMATION
NORTHWEST WEATHER AND AVALANCHE CENTER SEATTLE WASHINGTON NORTHWEST WEATHER AND AVALANCHE CENTER SEATTLE WASHINGTON
DAY 1 MONTH 4 YEAR 2009 DAY 15 MONTH 4 YEAR 2009
DATA IN INCHES, -99 DENOTES MISSING DATA DATA IN INCHES, -99 DENOTES MISSING DATA
CURRENT CLIMATE PER CENT LAST THRU 2008 THRU 2008 CURRENT CLIMATE PER CENT LAST THRU 2008 THRU 2008
DEPTH AVERAGE OF NORMAL YEAR MAX/YEAR MIN/YEAR DEPTH AVERAGE OF NORMAL YEAR MAX/YEAR MIN/YEAR
HURRICANE 93 106 88 137 252/1999 42/2005 HURRICANE 92 110 84 122 252/1999 51/2005
MT BAKER 143 174 82 197 311/1999 72/1934 MT BAKER 145 167 87 185 290/1999 56/1934
STEVENS 115 101 114 131 192/1956 24/1941 STEVENS 102 93 110 116 170/1956 17/1941
SNOQUALMIE 102 86 119 131 170/1956 2/1992 SNOQUALMIE 89 72 124 121 153/1974 0/1992
STAMPEDE 127 100 127 144 183/1956 17/1992 STAMPEDE 111 98 113 131 216/1964 9/1992
MISSION 49 46 107 55 86/1983 20/1973 MISSION 44 45 98 45 79/1983 21/1990
CRYSTAL 93 70 133 105 144/1999 16/1981 CRYSTAL 87 72 121 98 130/1999 30/1981
PARADISE 185 175 106 240 327/1956 66/1941 PARADISE 176 172 102 213 302/1972 68/1934
WHITE PASS 98 54 181 95 110/1997 0/1992 WHITE PASS 65 44 148 80 95/1997 0/1992
TIMBERLINE 199 163 122 225 300/1999 57/1981 TIMBERLINE 211 162 130 226 300/1999 71/1977
MEADOWS 166 128 130 199 199/2008 49/2005 MEADOWS 160 125 128 194 194/2008 54/2005
Snowfall: Season Climate % of
Total Average Normal
MT BAKER 548 620 88%
SNOQUALMIE 433 430 101%
PARADISE 734 650 113%
[/size]
2007-2008 -- strong La Niña[size=small]
CLIMATOLOGICAL SNOWDEPTH INFORMATION CLIMATOLOGICAL SNOWDEPTH INFORMATION
NORTHWEST WEATHER AND AVALANCHE CENTER SEATTLE WASHINGTON NORTHWEST WEATHER AND AVALANCHE CENTER SEATTLE WASHINGTON
DAY 1 MONTH 4 YEAR 2008 DAY 15 MONTH 4 YEAR 2008
DATA IN INCHES, -99 DENOTES MISSING DATA DATA IN INCHES, -99 DENOTES MISSING DATA
CURRENT CLIMATE PER CENT LAST THRU 2007 THRU 2007 CURRENT CLIMATE PER CENT LAST THRU 2007 THRU 2007
DEPTH AVERAGE OF NORMAL YEAR MAX/YEAR MIN/YEAR DEPTH AVERAGE OF NORMAL YEAR MAX/YEAR MIN/YEAR
HURRICANE 137 104 132 108 252/1999 42/2005 HURRICANE 122 109 112 104 252/1999 51/2005
MT BAKER 197 174 113 180 311/1999 72/1934 MT BAKER 185 166 111 168 290/1999 56/1934
STEVENS 131 100 131 95 192/1956 24/1941 STEVENS 116 93 125 90 170/1956 17/1941
SNOQUALMIE 131 85 154 79 170/1956 2/1992 SNOQUALMIE 121 71 170 65 153/1974 0/1992
STAMPEDE 144 100 144 88 183/1956 17/1992 STAMPEDE 131 98 134 88 216/1964 9/1992
MISSION 55 46 120 41 86/1983 20/1973 MISSION 45 45 100 36 79/1983 21/1990
CRYSTAL 105 69 152 80 144/1999 16/1981 CRYSTAL 98 71 138 75 130/1999 30/1981
PARADISE 240 174 138 141 327/1956 66/1941 PARADISE 213 172 124 147 302/1972 68/1934
WHITE PASS 95 53 179 51 110/1997 0/1992 WHITE PASS 80 42 190 35 95/1997 0/1992
TIMBERLINE 225 161 140 143 300/1999 57/1981 TIMBERLINE 226 160 141 147 300/1999 71/1977
MEADOWS 199 125 159 104 199/1999 49/2005 MEADOWS 194 123 158 100 190/1982 54/2005
Snowfall: Season Climate % of
Total Average Normal
MT BAKER 786 620 127%
SNOQUALMIE 591 430 137%
PARADISE 947 650 146%
[/size]
2004-2005 -- weak El Niño[size=small]
CLIMATOLOGICAL SNOWDEPTH INFORMATION CLIMATOLOGICAL SNOWDEPTH INFORMATION
NORTHWEST WEATHER AND AVALANCHE CENTER SEATTLE WASHINGTON NORTHWEST WEATHER AND AVALANCHE CENTER SEATTLE WASHINGTON
DAY 1 MONTH 4 YEAR 2005 DAY 15 MONTH 4 YEAR 2005
DATA IN INCHES, -99 DENOTES MISSING DATA DATA IN INCHES, -99 DENOTES MISSING DATA
CURRENT CLIMATE PER CENT LAST THRU 2004 THRU 2004 CURRENT CLIMATE PER CENT LAST THRU 2004 THRU 2004
DEPTH AVERAGE OF NORMAL YEAR MAX/YEAR MIN/YEAR DEPTH AVERAGE OF NORMAL YEAR MAX/YEAR MIN/YEAR
HURRICANE 42 106 40 95 252/1999 48/1981 HURRICANE 51 112 46 81 252/1999 65/2001
MT BAKER 78 175 45 159 311/1999 72/1934 MT BAKER 79 167 47 138 290/1999 56/1934
STEVENS 49 101 49 79 192/1956 24/1941 STEVENS 39 94 41 61 170/1956 17/1941
SNOQUALMIE 25 86 29 69 170/1956 2/1992 SNOQUALMIE 16 72 22 35 153/1974 0/1992
STAMPEDE 35 101 35 77 183/1956 17/1992 STAMPEDE 26 99 26 52 216/1964 9/1992
MISSION 21 47 45 44 86/1983 20/1973 MISSION 22 47 47 35 79/1983 21/1990
CRYSTAL 31 69 45 83 144/1999 16/1981 CRYSTAL 36 71 51 69 130/1999 30/1981
PARADISE 92 175 53 169 327/1956 66/1941 PARADISE 91 173 53 147 302/1972 68/1934
WHITE PASS 15 54 28 54 110/1997 0/1992 WHITE PASS 3 43 7 25 95/1997 0/1992
TIMBERLINE 74 164 45 182 300/1999 57/1981 TIMBERLINE 88 162 54 163 300/1999 71/1977
MEADOWS 49 127 39 126 199/1999 55/1992 MEADOWS 54 125 43 114 190/1982 54/1992
Snowfall: Season Climate % of
Total Average Normal
MT BAKER 465 620 75%
SNOQUALMIE 216 430 50%
PARADISE 409 650 63%
[/size]
2002-2003 -- moderate El Niño[size=small]
NOTE: The CLISNO expanded from 7 sites to 11 sites as of March 15, 2003
CLIMATOLOGICAL SNOWDEPTH INFORMATION CLIMATOLOGICAL SNOWDEPTH INFORMATION
NORTHWEST WEATHER AND AVALANCHE CENTER NORTHWEST WEATHER AND AVALANCHE CENTER
ISSUED THROUGH NATIONAL WEATHER SERVICE SEATTLE ISSUED THROUGH NATIONAL WEATHER SERVICE SEATTLE
FOR : DAY 1 MONTH 4 YEAR 2003 FOR : DAY 15 MONTH 4 YEAR 2003
DATA IN INCHES, -99 DENOTES MISSING DATA DATA IN INCHES, -99 DENOTES MISSING DATA
CURRENT CLIMATE PER CENT LAST THRU 2002 THRU 2002 CURRENT CLIMATE PER CENT LAST THRU 2002 THRU 2002
DEPTH AVERAGE OF NORMAL YEAR MAX/YEAR MIN/YEAR DEPTH AVERAGE OF NORMAL YEAR MAX/YEAR MIN/YEAR
HURRICANE 94 107 88 133 252/1999 48/1981 HURRICANE 95 115 83 123 252/1999 65/2001
MT BAKER 171 175 98 186 311/1999 72/1934 MT BAKER 148 168 88 168 290/1999 56/1934
STEVENS 84 102 82 132 192/1956 24/1941 STEVENS 78 95 82 117 170/1956 17/1941
SNOQUALMIE 50 86 58 112 170/1956 2/1992 SNOQUALMIE 42 73 58 100 153/1974 0/1992
STAMPEDE 72 102 71 134 183/1956 17/1992 STAMPEDE -99 100 -99 -99 216/1964 9/1992
MISSION 49 47 104 54 86/1983 20/1973 MISSION 45 49 92 45 79/1983 21/1990
CRYSTAL 76 69 110 96 144/1999 16/1981 CRYSTAL 70 71 99 82 130/1999 30/1981
PARADISE 151 175 86 220 327/1956 66/1941 PARADISE 155 173 90 200 302/1972 68/1934
WHITE PASS 42 54 78 76 110/1997 0/1992 WHITE PASS 30 45 67 55 95/1997 0/1992
TIMBERLINE 168 163 103 253 300/1999 57/1981 TIMBERLINE 175 161 109 220 300/1999 71/1977
MEADOWS 100 124 81 167 199/1999 55/1992 MEADOWS 99 122 81 146 190/1982 54/1992
Snowfall: Season Climate % of
Total Average Normal
MT BAKER 586 620 95%
SNOQUALMIE 277 430 64%
PARADISE 603 650 93%
[/size]
1997-1998 -- very strong El Niño[size=small]
CLIMATOLOGICAL SNOWDEPTH INFORMATION CLIMATOLOGICAL SNOWDEPTH INFORMATION
NORTHWEST WEATHER AND AVALANCHE CENTER NORTHWEST WEATHER AND AVALANCHE CENTER
ISSUED THROUGH NATIONAL WEATHER SERVICE SEATTLE ISSUED THROUGH NATIONAL WEATHER SERVICE SEATTLE
DAY 1 MONTH 4 YEAR 1998 DAY 15 MONTH 4 YEAR 1998
DATA IN INCHES, -99 DENOTES MISSING DATA DATA IN INCHES, -99 DENOTES MISSING DATA
CURRENT CLIMATE PER CENT THIS DATE CURRENT CLIMATE PER CENT THIS DATE
DEPTH AVERAGE OF NORMAL LAST YEAR DEPTH AVERAGE OF NORMAL LAST YEAR
MT BAKER 163 174 94 205 MT BAKER 154 167 92 200
STEVENS 80 101 79 158 STEVENS 78 94 83 145
SNOQUALMIE 77 86 90 146 SNOQUALMIE 65 72 90 124
STAMPEDE 77 102 75 153 STAMPEDE 71 100 71 135
PARADISE 163 174 94 243 PARADISE 166 172 97 250
WHITE PASS 62 50 124 110 WHITE PASS -99 42 -99 95
MT HOOD 120 120 100 177 MT HOOD 127 119 107 167
Snowfall: Season Climate % of
Total Average Normal
MT BAKER - 620 -
SNOQUALMIE 361 430 84%
PARADISE 674 650 104%
[/size]
So out of these 5 previous seasons since 1997 with a December 15 snowpack below roughly 70% of normal at these sites, one season ended up being huge (2007-2008, a memorable strong La Niña year), one slightly above-normal (2008-2009, weak La Niña), 2 near-normal (2002-2003, moderate El Niño, and 1997-98, very strong El Niño), and one well-below-normal (2004-2005, weak El Niño, the worst snow year in the Northwest since 1976-77, even since 1940-41 at some sites). Of course, at Snoqualmie Pass (the lowest elevation among these sites) these seasons look more below normal than at higher-elevations sites like Paradise or Baker.
Therefore at most of these sites, there appears to be hardly any correlation between low December 15 snowpack and an overall low snowfall / snowpack throughout the entire season, although there is a definite correlation in that direction at Snoqualmie Pass (albeit weak). Statistically, it is unlikely that this season will end up having catastrophically low snowfall, although that is obviously a possibility in almost any year (except in strong La Niña years, which have near-zero chance of being below normal in the Northwest). The likelihood of a below-normal season at Snoqualmie Pass is clearly greater than at other higher-elevation sites, but that is often the case in many seasons, as Snoqualmie is a very risky basket in which to keep one's wintertime eggs.
The most likely outcome this season is near-normal or perhaps slightly below-normal (i.e. 80-90% of normal snowfall and April 1 snowpack, which is still huge and far beyond what any other regions in the lower 48 normally get). There also remains a significant chance that the season could even end up being above-normal overall, although the likelihood of ending up far-above-normal is quite small given the lack of La Niña conditions in the Pacific (currently ENSO neutral, although SST anomalies have remained slightly negative throughout 2013, see www.cpc.ncep.noaa.gov/products/precip/CW...nso.shtml#discussion).
Anyway, it's already been a great season so far, with the most late-September snowfall since at least 1972 providing excellent early-October ski conditions, followed by many periods of beautiful sunny weather to enjoy the powder and the corn throughout the autumn months -- and winter hasn't even arrived yet.
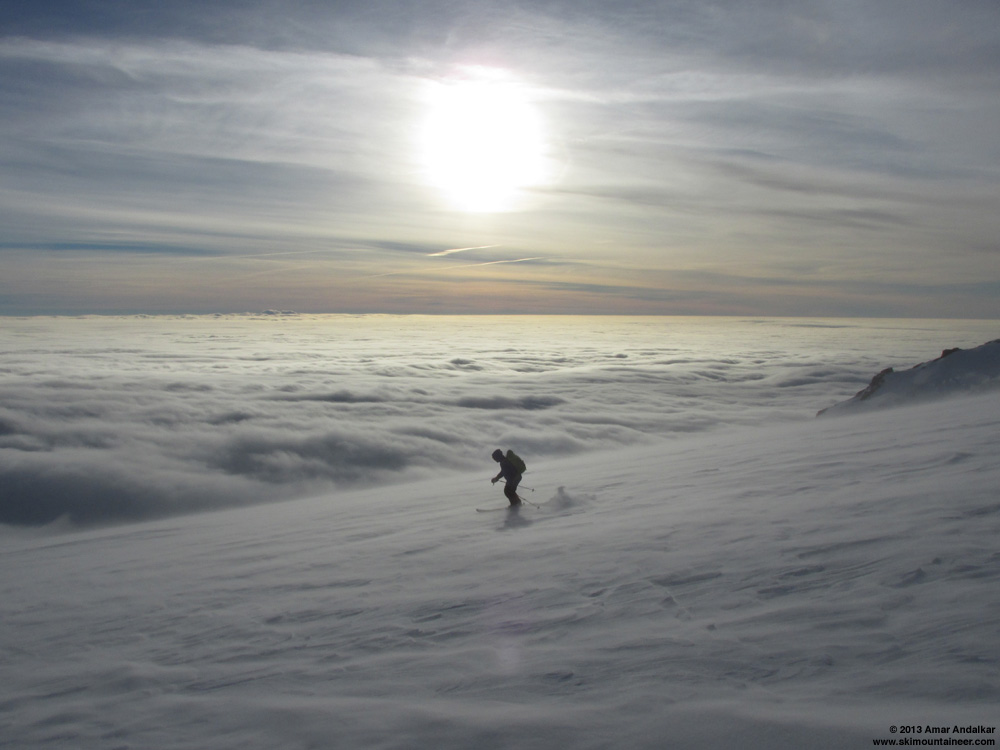
[size=small]Skiing drifts of windblown powder above the sea of clouds, Mount Rainier, December 9, 2013.[/size]
[size=small](Edited to list the ENSO character for each of these 5 seasons.)[/size]
The standard one-parameter measure of an entire season's snowpack is the April 1 snowdepth, which correlates well with total season snowfall at these type of high-snowfall mountain sites. Shown below are the April 1 and April 15 CLISNO data recorded 4 months later on in each of the seasons shown above (except the current season, obviously). Snowfall totals for the entire season are also shown, along with calculated percents of normal, for the only 3 of these sites where such data is readily available.
2008-2009 -- weak La Niña[size=small]
CLIMATOLOGICAL SNOWDEPTH INFORMATION CLIMATOLOGICAL SNOWDEPTH INFORMATION
NORTHWEST WEATHER AND AVALANCHE CENTER SEATTLE WASHINGTON NORTHWEST WEATHER AND AVALANCHE CENTER SEATTLE WASHINGTON
DAY 1 MONTH 4 YEAR 2009 DAY 15 MONTH 4 YEAR 2009
DATA IN INCHES, -99 DENOTES MISSING DATA DATA IN INCHES, -99 DENOTES MISSING DATA
CURRENT CLIMATE PER CENT LAST THRU 2008 THRU 2008 CURRENT CLIMATE PER CENT LAST THRU 2008 THRU 2008
DEPTH AVERAGE OF NORMAL YEAR MAX/YEAR MIN/YEAR DEPTH AVERAGE OF NORMAL YEAR MAX/YEAR MIN/YEAR
HURRICANE 93 106 88 137 252/1999 42/2005 HURRICANE 92 110 84 122 252/1999 51/2005
MT BAKER 143 174 82 197 311/1999 72/1934 MT BAKER 145 167 87 185 290/1999 56/1934
STEVENS 115 101 114 131 192/1956 24/1941 STEVENS 102 93 110 116 170/1956 17/1941
SNOQUALMIE 102 86 119 131 170/1956 2/1992 SNOQUALMIE 89 72 124 121 153/1974 0/1992
STAMPEDE 127 100 127 144 183/1956 17/1992 STAMPEDE 111 98 113 131 216/1964 9/1992
MISSION 49 46 107 55 86/1983 20/1973 MISSION 44 45 98 45 79/1983 21/1990
CRYSTAL 93 70 133 105 144/1999 16/1981 CRYSTAL 87 72 121 98 130/1999 30/1981
PARADISE 185 175 106 240 327/1956 66/1941 PARADISE 176 172 102 213 302/1972 68/1934
WHITE PASS 98 54 181 95 110/1997 0/1992 WHITE PASS 65 44 148 80 95/1997 0/1992
TIMBERLINE 199 163 122 225 300/1999 57/1981 TIMBERLINE 211 162 130 226 300/1999 71/1977
MEADOWS 166 128 130 199 199/2008 49/2005 MEADOWS 160 125 128 194 194/2008 54/2005
Snowfall: Season Climate % of
Total Average Normal
MT BAKER 548 620 88%
SNOQUALMIE 433 430 101%
PARADISE 734 650 113%
[/size]
2007-2008 -- strong La Niña[size=small]
CLIMATOLOGICAL SNOWDEPTH INFORMATION CLIMATOLOGICAL SNOWDEPTH INFORMATION
NORTHWEST WEATHER AND AVALANCHE CENTER SEATTLE WASHINGTON NORTHWEST WEATHER AND AVALANCHE CENTER SEATTLE WASHINGTON
DAY 1 MONTH 4 YEAR 2008 DAY 15 MONTH 4 YEAR 2008
DATA IN INCHES, -99 DENOTES MISSING DATA DATA IN INCHES, -99 DENOTES MISSING DATA
CURRENT CLIMATE PER CENT LAST THRU 2007 THRU 2007 CURRENT CLIMATE PER CENT LAST THRU 2007 THRU 2007
DEPTH AVERAGE OF NORMAL YEAR MAX/YEAR MIN/YEAR DEPTH AVERAGE OF NORMAL YEAR MAX/YEAR MIN/YEAR
HURRICANE 137 104 132 108 252/1999 42/2005 HURRICANE 122 109 112 104 252/1999 51/2005
MT BAKER 197 174 113 180 311/1999 72/1934 MT BAKER 185 166 111 168 290/1999 56/1934
STEVENS 131 100 131 95 192/1956 24/1941 STEVENS 116 93 125 90 170/1956 17/1941
SNOQUALMIE 131 85 154 79 170/1956 2/1992 SNOQUALMIE 121 71 170 65 153/1974 0/1992
STAMPEDE 144 100 144 88 183/1956 17/1992 STAMPEDE 131 98 134 88 216/1964 9/1992
MISSION 55 46 120 41 86/1983 20/1973 MISSION 45 45 100 36 79/1983 21/1990
CRYSTAL 105 69 152 80 144/1999 16/1981 CRYSTAL 98 71 138 75 130/1999 30/1981
PARADISE 240 174 138 141 327/1956 66/1941 PARADISE 213 172 124 147 302/1972 68/1934
WHITE PASS 95 53 179 51 110/1997 0/1992 WHITE PASS 80 42 190 35 95/1997 0/1992
TIMBERLINE 225 161 140 143 300/1999 57/1981 TIMBERLINE 226 160 141 147 300/1999 71/1977
MEADOWS 199 125 159 104 199/1999 49/2005 MEADOWS 194 123 158 100 190/1982 54/2005
Snowfall: Season Climate % of
Total Average Normal
MT BAKER 786 620 127%
SNOQUALMIE 591 430 137%
PARADISE 947 650 146%
[/size]
2004-2005 -- weak El Niño[size=small]
CLIMATOLOGICAL SNOWDEPTH INFORMATION CLIMATOLOGICAL SNOWDEPTH INFORMATION
NORTHWEST WEATHER AND AVALANCHE CENTER SEATTLE WASHINGTON NORTHWEST WEATHER AND AVALANCHE CENTER SEATTLE WASHINGTON
DAY 1 MONTH 4 YEAR 2005 DAY 15 MONTH 4 YEAR 2005
DATA IN INCHES, -99 DENOTES MISSING DATA DATA IN INCHES, -99 DENOTES MISSING DATA
CURRENT CLIMATE PER CENT LAST THRU 2004 THRU 2004 CURRENT CLIMATE PER CENT LAST THRU 2004 THRU 2004
DEPTH AVERAGE OF NORMAL YEAR MAX/YEAR MIN/YEAR DEPTH AVERAGE OF NORMAL YEAR MAX/YEAR MIN/YEAR
HURRICANE 42 106 40 95 252/1999 48/1981 HURRICANE 51 112 46 81 252/1999 65/2001
MT BAKER 78 175 45 159 311/1999 72/1934 MT BAKER 79 167 47 138 290/1999 56/1934
STEVENS 49 101 49 79 192/1956 24/1941 STEVENS 39 94 41 61 170/1956 17/1941
SNOQUALMIE 25 86 29 69 170/1956 2/1992 SNOQUALMIE 16 72 22 35 153/1974 0/1992
STAMPEDE 35 101 35 77 183/1956 17/1992 STAMPEDE 26 99 26 52 216/1964 9/1992
MISSION 21 47 45 44 86/1983 20/1973 MISSION 22 47 47 35 79/1983 21/1990
CRYSTAL 31 69 45 83 144/1999 16/1981 CRYSTAL 36 71 51 69 130/1999 30/1981
PARADISE 92 175 53 169 327/1956 66/1941 PARADISE 91 173 53 147 302/1972 68/1934
WHITE PASS 15 54 28 54 110/1997 0/1992 WHITE PASS 3 43 7 25 95/1997 0/1992
TIMBERLINE 74 164 45 182 300/1999 57/1981 TIMBERLINE 88 162 54 163 300/1999 71/1977
MEADOWS 49 127 39 126 199/1999 55/1992 MEADOWS 54 125 43 114 190/1982 54/1992
Snowfall: Season Climate % of
Total Average Normal
MT BAKER 465 620 75%
SNOQUALMIE 216 430 50%
PARADISE 409 650 63%
[/size]
2002-2003 -- moderate El Niño[size=small]
NOTE: The CLISNO expanded from 7 sites to 11 sites as of March 15, 2003
CLIMATOLOGICAL SNOWDEPTH INFORMATION CLIMATOLOGICAL SNOWDEPTH INFORMATION
NORTHWEST WEATHER AND AVALANCHE CENTER NORTHWEST WEATHER AND AVALANCHE CENTER
ISSUED THROUGH NATIONAL WEATHER SERVICE SEATTLE ISSUED THROUGH NATIONAL WEATHER SERVICE SEATTLE
FOR : DAY 1 MONTH 4 YEAR 2003 FOR : DAY 15 MONTH 4 YEAR 2003
DATA IN INCHES, -99 DENOTES MISSING DATA DATA IN INCHES, -99 DENOTES MISSING DATA
CURRENT CLIMATE PER CENT LAST THRU 2002 THRU 2002 CURRENT CLIMATE PER CENT LAST THRU 2002 THRU 2002
DEPTH AVERAGE OF NORMAL YEAR MAX/YEAR MIN/YEAR DEPTH AVERAGE OF NORMAL YEAR MAX/YEAR MIN/YEAR
HURRICANE 94 107 88 133 252/1999 48/1981 HURRICANE 95 115 83 123 252/1999 65/2001
MT BAKER 171 175 98 186 311/1999 72/1934 MT BAKER 148 168 88 168 290/1999 56/1934
STEVENS 84 102 82 132 192/1956 24/1941 STEVENS 78 95 82 117 170/1956 17/1941
SNOQUALMIE 50 86 58 112 170/1956 2/1992 SNOQUALMIE 42 73 58 100 153/1974 0/1992
STAMPEDE 72 102 71 134 183/1956 17/1992 STAMPEDE -99 100 -99 -99 216/1964 9/1992
MISSION 49 47 104 54 86/1983 20/1973 MISSION 45 49 92 45 79/1983 21/1990
CRYSTAL 76 69 110 96 144/1999 16/1981 CRYSTAL 70 71 99 82 130/1999 30/1981
PARADISE 151 175 86 220 327/1956 66/1941 PARADISE 155 173 90 200 302/1972 68/1934
WHITE PASS 42 54 78 76 110/1997 0/1992 WHITE PASS 30 45 67 55 95/1997 0/1992
TIMBERLINE 168 163 103 253 300/1999 57/1981 TIMBERLINE 175 161 109 220 300/1999 71/1977
MEADOWS 100 124 81 167 199/1999 55/1992 MEADOWS 99 122 81 146 190/1982 54/1992
Snowfall: Season Climate % of
Total Average Normal
MT BAKER 586 620 95%
SNOQUALMIE 277 430 64%
PARADISE 603 650 93%
[/size]
1997-1998 -- very strong El Niño[size=small]
CLIMATOLOGICAL SNOWDEPTH INFORMATION CLIMATOLOGICAL SNOWDEPTH INFORMATION
NORTHWEST WEATHER AND AVALANCHE CENTER NORTHWEST WEATHER AND AVALANCHE CENTER
ISSUED THROUGH NATIONAL WEATHER SERVICE SEATTLE ISSUED THROUGH NATIONAL WEATHER SERVICE SEATTLE
DAY 1 MONTH 4 YEAR 1998 DAY 15 MONTH 4 YEAR 1998
DATA IN INCHES, -99 DENOTES MISSING DATA DATA IN INCHES, -99 DENOTES MISSING DATA
CURRENT CLIMATE PER CENT THIS DATE CURRENT CLIMATE PER CENT THIS DATE
DEPTH AVERAGE OF NORMAL LAST YEAR DEPTH AVERAGE OF NORMAL LAST YEAR
MT BAKER 163 174 94 205 MT BAKER 154 167 92 200
STEVENS 80 101 79 158 STEVENS 78 94 83 145
SNOQUALMIE 77 86 90 146 SNOQUALMIE 65 72 90 124
STAMPEDE 77 102 75 153 STAMPEDE 71 100 71 135
PARADISE 163 174 94 243 PARADISE 166 172 97 250
WHITE PASS 62 50 124 110 WHITE PASS -99 42 -99 95
MT HOOD 120 120 100 177 MT HOOD 127 119 107 167
Snowfall: Season Climate % of
Total Average Normal
MT BAKER - 620 -
SNOQUALMIE 361 430 84%
PARADISE 674 650 104%
[/size]
So out of these 5 previous seasons since 1997 with a December 15 snowpack below roughly 70% of normal at these sites, one season ended up being huge (2007-2008, a memorable strong La Niña year), one slightly above-normal (2008-2009, weak La Niña), 2 near-normal (2002-2003, moderate El Niño, and 1997-98, very strong El Niño), and one well-below-normal (2004-2005, weak El Niño, the worst snow year in the Northwest since 1976-77, even since 1940-41 at some sites). Of course, at Snoqualmie Pass (the lowest elevation among these sites) these seasons look more below normal than at higher-elevations sites like Paradise or Baker.
Therefore at most of these sites, there appears to be hardly any correlation between low December 15 snowpack and an overall low snowfall / snowpack throughout the entire season, although there is a definite correlation in that direction at Snoqualmie Pass (albeit weak). Statistically, it is unlikely that this season will end up having catastrophically low snowfall, although that is obviously a possibility in almost any year (except in strong La Niña years, which have near-zero chance of being below normal in the Northwest). The likelihood of a below-normal season at Snoqualmie Pass is clearly greater than at other higher-elevation sites, but that is often the case in many seasons, as Snoqualmie is a very risky basket in which to keep one's wintertime eggs.
The most likely outcome this season is near-normal or perhaps slightly below-normal (i.e. 80-90% of normal snowfall and April 1 snowpack, which is still huge and far beyond what any other regions in the lower 48 normally get). There also remains a significant chance that the season could even end up being above-normal overall, although the likelihood of ending up far-above-normal is quite small given the lack of La Niña conditions in the Pacific (currently ENSO neutral, although SST anomalies have remained slightly negative throughout 2013, see www.cpc.ncep.noaa.gov/products/precip/CW...nso.shtml#discussion).
Anyway, it's already been a great season so far, with the most late-September snowfall since at least 1972 providing excellent early-October ski conditions, followed by many periods of beautiful sunny weather to enjoy the powder and the corn throughout the autumn months -- and winter hasn't even arrived yet.
[size=small]Skiing drifts of windblown powder above the sea of clouds, Mount Rainier, December 9, 2013.[/size]
[size=small](Edited to list the ENSO character for each of these 5 seasons.)[/size]
Please Log in or Create an account to join the conversation.
- cumulus
- [cumulus]
-
- Offline
- Junior Member
-

Less
More
- Posts: 116
- Thank you received: 0
16 Dec 2013 06:18 #211306
by cumulus
Replied by cumulus on topic Re: How unusual is the current low PNW snowpack?
Thanks for doing the science! Beautiful pic too!
After all the statistics however it seems a bit disingenuous and overstated to be labeling Snoqualmie as a "a very risky basket." Even comparing it relatively as you do it still delivers quite nicely. It also remains the ski option with the lowest carbon footprint to the largest metropolitan area in the state of Washington. Given the accumulating science of emissions on weather patterns and the driving required* to access skiing, this to me would seem pertinent and anything but risky. Not to mention the character building aspect... it's not for nothing all the best skiers cut their teeth in snocrummy land.")
*with the exception of course of the occasional entirely human powered ski excursion
After all the statistics however it seems a bit disingenuous and overstated to be labeling Snoqualmie as a "a very risky basket." Even comparing it relatively as you do it still delivers quite nicely. It also remains the ski option with the lowest carbon footprint to the largest metropolitan area in the state of Washington. Given the accumulating science of emissions on weather patterns and the driving required* to access skiing, this to me would seem pertinent and anything but risky. Not to mention the character building aspect... it's not for nothing all the best skiers cut their teeth in snocrummy land.
*with the exception of course of the occasional entirely human powered ski excursion
Please Log in or Create an account to join the conversation.
- sprice
- [sprice]
-
- Offline
- Junior Member
-
Less
More
- Posts: 66
- Thank you received: 0
16 Dec 2013 09:25 #211314
by sprice
Replied by sprice on topic Re: How unusual is the current low PNW snowpack?
Cliff mass had a great explanation post for the current situation
cliffmass.blogspot.com/2013/12/an-unusually-dry-fall.html
cliffmass.blogspot.com/2013/12/an-unusually-dry-fall.html
Please Log in or Create an account to join the conversation.
- knitvt
- [knitvt]
-
- Offline
- New Member
-

Less
More
- Posts: 44
- Thank you received: 0
16 Dec 2013 09:59 #211315
by knitvt
Replied by knitvt on topic Re: How unusual is the current low PNW snowpack?
Thanks for pulling all that data! Really interesting to see.
Please Log in or Create an account to join the conversation.
- pipedream
- [pipedream]
-
- Offline
- Premium Member
-
Less
More
- Posts: 629
- Thank you received: 0
16 Dec 2013 10:59 #211316
by pipedream
Replied by pipedream on topic Re: How unusual is the current low PNW snowpack?
Thanks for confirming my hypotheses, Amar! While we're off to a slow start, that doesn't mean we won't still have a great season. It's all about perspective and making the best out of the hand we've been dealt.
As a recent transplant to the region (~7 years ago), it's easy to falsely generalize about the current state of the snowpack, weather patterns, etc. Climate operates on the scale of decades, what we're seeing is likely within the overall error range / uncertainty.
While I dodged the bullet in 2004-2005, the slow starts of 2007-2008 and 2008-2009 are still fresh in my memory. IMHO, the season starts when Mt. Baker opens and ends when the base of Alpental melts out. In 2008-2009, Mt. Baker didn't open until Dec. 14 and I recall Ski Patrol opening the 7th Heaven chairlift at Steven's Pass on Christmas Day. In 2007-2008, Mt. Baker barely made it open before December (Nov. 29th), but if you recall it snowed 13+ feet in March at Snoqualmie Pass and Alpental spun their lifts until early June!
So while we're certainly off to a slow start, just take a deep breath and put it into scientific perspective. There's still plenty of time for Old Man Winter to deliver...
Please Log in or Create an account to join the conversation.
- garyabrill
- [garyabrill]
-
- Offline
- Senior Member
-

Less
More
- Posts: 464
- Thank you received: 0
16 Dec 2013 11:47 - 16 Dec 2013 11:50 #211318
by garyabrill
Replied by garyabrill on topic Re: How unusual is the current low PNW snowpack?
There have been a lot of winters that have been saved by about three weeks of intensive snowfalls. That has been a situation for some time now. The one recent year where that didn't happen was 2004-2005 with very low snowpacks throughout. Even in bad winters, which this one currently looks like, the long wave pattern usually changes between about mid-February and early March when low pressure tends to form and persist over the Queen Charlottes.
The CPC www.cpc.ncep.noaa.gov/products/predictio.../seasonal.php?lead=5 still shows equal chances for precipitation each month through mid-late spring but also shows below normal temperatures for essentially the whole of that period over the Northwest. That implies a ridge west of the region with precipitation occurring when the ridge of high pressure either flattens or the axis moves sufficiently offshore to allow for toughing along the coast. Long term forecasts (you can read about the methodology on the CPC website) are based primarily on climatology, recent weather patterns and sea surface temperature forecasts.
That said I don't feel overly confident about snowpack and conditions until mid-late winter. But three weeks of snowfall could once again change much of that.
Please Log in or Create an account to join the conversation.
- flowing alpy
- [flowing alpy]
-
- Offline
- Platinum Member
-

Less
More
- Posts: 1272
- Thank you received: 0
16 Dec 2013 12:19 #211319
by flowing alpy
Replied by flowing alpy on topic Re: How unusual is the current low PNW snowpack?
that is what i have been telling myself, amar.
b
b
Please Log in or Create an account to join the conversation.
- WoodyD
- [skialpinist]
-
- Offline
- New Member
-
Less
More
- Posts: 19
- Thank you received: 0
16 Dec 2013 13:03 #211320
by WoodyD
Replied by WoodyD on topic Re: How unusual is the current low PNW snowpack?
All it would take is one good storm cycle in the next few weeks and everyone will start talking about a global ice age, the dawn of a new golden age of low elevation snow pack, skiing lines that "never form this early", etc, etc.
I kid, but seriously. One good damp maritime snowfall of 20-30" or so on the crest and I think any coverage issues we're having will be forgotten.
One other interesting weather anomaly. I live in Plain and work in Leavenworth. Sunday in Plain it warmed up to 55 degrees and melted basically all the snow in the Plain/Lake Wenatchee area. Save for some shaded areas where peoples roofs shed snow, it looks like spring. I was expecting the same in Leavenworth, but to my surprise Leavenworth still is white with snow on the trees and no loss of snow pack. For a frame of reference, Plain is nearly 1000 ft higher and gets nearly double the amount of snow.
Question is, what caused this? Inversion layer or protective Bavarian snow voodoo magic net cast by the Leavenworth Chamber of Commerce over Christmas Town??? Tin foil hat stuff here people.
Please Log in or Create an account to join the conversation.
- rippy
- [rippy]
-
- Offline
- Junior Member
-
Less
More
- Posts: 89
- Thank you received: 1
16 Dec 2013 16:03 #211325
by rippy
Replied by rippy on topic Re: How unusual is the current low PNW snowpack?
We sure would benefit if the high pressure would move along and return a more typical pattern. I'm just watching the Aleutian chain area / north mid pacific and hoping to see some tight, developed lows form with a shift in the aloft air. Three or four of those rolling in will change the game. Making lemonade when ya get lemons? The retail market gets nervous by mid January if this goes on til then.
Please Log in or Create an account to join the conversation.
- Pete_H
- [Pete_H]
-
- Offline
- Junior Member
-
Less
More
- Posts: 140
- Thank you received: 0
17 Dec 2013 09:07 - 17 Dec 2013 09:10 #211336
by Pete_H
Very unscientificaly, I would posit that the cool easterly flow and inversions have saved the snow in 11worth, while the elevation and relatively deeper snowpack has kept the snow as you move up to the pass. Definitely a strange effect indeed.
Also, even though pass level snowpack is low I'm guessing higher elevation snowpack is at least near average. We've had some strong precipitation events; unfortunately its been pretty warm during a lot of it.
Replied by Pete_H on topic Re: How unusual is the current low PNW snowpack?
Question is, what caused this? Inversion layer or protective Bavarian snow voodoo magic net cast by the Leavenworth Chamber of Commerce over Christmas Town??? Tin foil hat stuff here people.
Very unscientificaly, I would posit that the cool easterly flow and inversions have saved the snow in 11worth, while the elevation and relatively deeper snowpack has kept the snow as you move up to the pass. Definitely a strange effect indeed.
Also, even though pass level snowpack is low I'm guessing higher elevation snowpack is at least near average. We've had some strong precipitation events; unfortunately its been pretty warm during a lot of it.
Please Log in or Create an account to join the conversation.
- T. Eastman
- [T. Eastman]
-
- Offline
- Senior Member
-
Less
More
- Posts: 288
- Thank you received: 0
17 Dec 2013 09:14 #211337
by T. Eastman
Replied by T. Eastman on topic Re: How unusual is the current low PNW snowpack?
Single malt and a new pair of trail running shoes...
Please Log in or Create an account to join the conversation.
- Pete_H
- [Pete_H]
-
- Offline
- Junior Member
-
Less
More
- Posts: 140
- Thank you received: 0
17 Dec 2013 15:05 #211339
by Pete_H
Replied by Pete_H on topic Re: How unusual is the current low PNW snowpack?
All I want for Christmas ...
Please Log in or Create an account to join the conversation.
- pipedream
- [pipedream]
-
- Offline
- Premium Member
-
Less
More
- Posts: 629
- Thank you received: 0
17 Dec 2013 15:33 #211341
by pipedream
Replied by pipedream on topic Re: How unusual is the current low PNW snowpack?
... is a dump of 2+ feet!
Also, Amar's famous! From today's Mt. Baker Ski Area Snow Report :
Also, Amar's famous! From today's Mt. Baker Ski Area Snow Report :
According to a recent in depth study by University of Washington scientist Amar Andalkar, the weather that has occurred through mid December has very little to do with the upcoming weather for the rest of the winter season. He expects the most likely scenario is both near normal snowfall and April 1st snowpack, which is a huge amount of snow and far beyond other regions in the lower 48 states. Keep doing your best snowdance!
Please Log in or Create an account to join the conversation.
- andyrew
- [andyrew609]
-
- Offline
- Junior Member
-
Less
More
- Posts: 116
- Thank you received: 0
17 Dec 2013 18:21 #211343
by andyrew
Replied by andyrew on topic Re: How unusual is the current low PNW snowpack?
Amar's post made me want to make some graphs to take a look at the trend visually.

(numbers indicate years since 1900, thus year 113 was last year).
In general, mid-december snowpack (snow water equivalent) is correlated with April snowpack. However, there's still lots of season left to make up for a poor start. One way you might assess that is to look at the correlation between each month, and see how quickly it drops off. In the graphs below, the brighter the green, the stronger the correlation. You can see that for Stampede Pass and Paradise, the horizontal band of green at Dec 16 doesn't extend as far as it does when you follow January 16 out to the right (for instance).


I would interpret this as saying that often our heaviest snowfalls will come after the new year. However, once we run out of winter (March 1), we essentially will only maintain the snowpack, rather than have any more chance to build it.
Interestingly, in sites to the east of the crest, early season correlations appear to have a stronger influence on the late season. At Hart's Pass, even Nov 16 snowpack appears to correlate with May snowpack. This may be because it is the coldest (receiving air from the BC interior), and highest site I considered. This actually might also be true for Stampede Pass, which also seems to have more persistent correlations than Stevens Pass.
Methods:
I downloaded bi-monthly snow water equivalent from snotel using their report generator . Records were from 1981-December 2013, except for a couple sites where records started in the mid-80s.
I defined the water year to be July1-Jun 31st (which I think is standard?). If anyone is curious, here's some links to the data I used to generate the plots.
(numbers indicate years since 1900, thus year 113 was last year).
In general, mid-december snowpack (snow water equivalent) is correlated with April snowpack. However, there's still lots of season left to make up for a poor start. One way you might assess that is to look at the correlation between each month, and see how quickly it drops off. In the graphs below, the brighter the green, the stronger the correlation. You can see that for Stampede Pass and Paradise, the horizontal band of green at Dec 16 doesn't extend as far as it does when you follow January 16 out to the right (for instance).
I would interpret this as saying that often our heaviest snowfalls will come after the new year. However, once we run out of winter (March 1), we essentially will only maintain the snowpack, rather than have any more chance to build it.
Interestingly, in sites to the east of the crest, early season correlations appear to have a stronger influence on the late season. At Hart's Pass, even Nov 16 snowpack appears to correlate with May snowpack. This may be because it is the coldest (receiving air from the BC interior), and highest site I considered. This actually might also be true for Stampede Pass, which also seems to have more persistent correlations than Stevens Pass.
Methods:
I downloaded bi-monthly snow water equivalent from snotel using their report generator . Records were from 1981-December 2013, except for a couple sites where records started in the mid-80s.
I defined the water year to be July1-Jun 31st (which I think is standard?). If anyone is curious, here's some links to the data I used to generate the plots.
Please Log in or Create an account to join the conversation.
- MattT
- [MattT]
-
- Offline
- Junior Member
-
Less
More
- Posts: 62
- Thank you received: 0
17 Dec 2013 22:22 #211348
by MattT
Replied by MattT on topic Re: How unusual is the current low PNW snowpack?
awesome analysis Amar, I love geeking out on hydrologic data. Thanks for putting the numbers to it.
Nice supplement andyrew...just FYI water years go from Oct1-Sept30. Roughly correlates to the break point at which rivers ceases running from the previous winter's snowpack, or vice-versa, when the rivers could begin running from fresh snowfall.
In the meantime, less bitching, more praying for snow!
Please Log in or Create an account to join the conversation.
- Jonn-E
- [Jonn-E]
-
- Offline
- Junior Member
-
Less
More
- Posts: 169
- Thank you received: 0
17 Dec 2013 23:34 #211349
by Jonn-E
Replied by Jonn-E on topic Re: How unusual is the current low PNW snowpack?
Andyrew,
There has been a short term (<10 yr) shift towards later-season (post March 15) snowpack accumulation that would get buried in the noise of a longer historical analysis. IIRC, this affect appears to be more pronounced during El Nino years. Last time I checked (at least a year ago) no one in the field really knew why this was, but I believe a play between the various pacific ocillations (PDO/IPO) was a suspect.
Another analysis that would be fascinating is your correlation extended to basin-wide SWE models. Sometimes these tell a different story than individual SNOTEL sites because they are less susceptible to single-point conditions. I feel like your Hart's Pass analysis hints total SWE for a large portion of the Cascades may correlate rather strongly, because so much of our terrain is higher than the average SNOTEL site.
I love that some real analysis is going on at TAY!
Please Log in or Create an account to join the conversation.
- bscott
- [bscott]
-
- Offline
- New Member
-
Less
More
- Posts: 31
- Thank you received: 0
18 Dec 2013 15:10 #211371
by bscott
Replied by bscott on topic Re: How unusual is the current low PNW snowpack?
While Amar’s analysis of past snowfall history is interesting, it should not be construed to imply a most likely outcome of this year’s snowpack. What it does show is that this winter is similar to winters that have been observed in the past. If you believe the climate modelers, what has been normal or typical in the past will become very abnormal in the near future. Correlations made now with past weather events will become meaningless in predicting the future. It is quite possible that within the next few years we will begin to notice a very different regime of temperature and snowfall in the Cascades. That change could already be happening.
Please Log in or Create an account to join the conversation.
- Amar Andalkar
- [andalkar]
-
Topic Author
- Offline
- Premium Member
-
Less
More
- Posts: 635
- Thank you received: 0
18 Dec 2013 20:52 #211374
by Amar Andalkar
Is that really what the climate modelers are saying? Not really, or at least that's a severe exaggeration of what most (scientifically peer-reviewed, published, etc.) climate modelers are saying. But I suspect you know that already, and are just being hyperbolic and alarmist (although some degree of alarm over anthropogenic climate change is probably warranted).
With apologies (since I dislike it when others do this), I've slightly reworded the last 4 sentences to give a more reasonable view that better reflects current climate scientists' consensus:
"If you believe the climate modelers, what has been normal or typical in the past will becomevery abnormal less typical or normal in the near future over the next century. Correlations made now with past weather events will become meaningless less reliable in predicting the future. It is quite possible that within the next few years decades we will begin to notice a very different slightly but increasingly different regime of temperature and snowfall in the Cascades. That change could already be happening."
My main point is that, especially considering the (very limited) 17 year set of data I presented, the effects of climate change are unlikely to be significant or detectable in regards to predicting likely snowpack outcomes for this season. The effects due to smaller-time-scale variability such as PDO (period of decades), ENSO (period of years), and MJO (period of months) are much more significant for this season and the next several too than that of climate change.
I like it -- I was originally thinking of making a plot very similar to this and calculating linear correlation coefficients and all that, using long-term data from Paradise (since 1916), Crater Lake (since 1919), Holden Village (since 1962), perhaps a few other mountain sites where I could get long-term data (50+ years) from the National Climatic Data Center (unfortunately there are very few such sites) -- but then I just decided to take a look at the NWAC's CLISNO tables, since those sites are most relevant for skiers in this region.
Although there is an obvious correlation in the graph, it is fairly weak (i.e. the lines are fairly flat in slope, and the y-intercepts are strongly non-zero) at all except Harts Pass. Looking at the data points pretty much supports the conclusion I reached in the original post above. Taking just the Paradise data (most of the uppermost data points), April 1 snowpacks in the near-normal range (say 65-85" of SWE) are found in seasons which have December 15 snowpacks ranging from 9" to 37" -- that's a vast range of December 15 snowpacks, covering the full gamut from far-below-normal to far-above-normal, all of which produced near-normal April 1 snowpacks! (On a side note, it's worth mentioning that the Paradise SNOTEL site is at 5130 ft, significantly lower than the Paradise NWAC site and where the NPS manually records daily data, 5420 ft.) The effect is less easy to discern for the other sites shown in the graph, and the correlation is stronger than for Paradise in each case, but near-normal April 1 snowpacks still occur over a wide range of December 15 snowpack depths at those sites too.
We definitely don't run out of winter on March 1, at least not at reasonable elevations in the Cascades. At most sites above about 4000 ft in the WA Cascades (i.e NOT Snoqualmie in particular), 5000 ft in the OR Cascades, and 6000 ft in the CA Cascades, the month which has the highest ratio of average snowfall to average precipitation is March! Not January or February! (Several years ago, I analyzed data from many dozens of sites from SW BC all the way to the southern Sierra Nevada, calculating snowfall to precipitation ratios for the season and each winter month as a function of elevation and location -- very interesting data and plots, too much to present here now.) I suspect that cooling ocean temperature in the North Pacific throughout the winter contributes to this effect, along with a reduced likelihood of Pineapple Express systems in March and later. The average seasonal snowpack maximum is around April 1 for those sites (4000+ ft WA Cascades, 5000+ ft OR Cascades, 6000+ ft CA Cascades), even trending as late as mid-April for some higher sites and more northerly sites.
Not sure what to think about Harts Pass and other east side locations, that is interesting that early-season correlations appear to be stronger. I've spent much less time studying snowpack trends at those sites, even compared to places like southern OR and northern CA, since I personally tend to ski on the east side much less often than I do anywhere along the volcanic crest of the range all the way south to California.
Replied by Amar Andalkar on topic Re: How unusual is the current low PNW snowpack?
[size=small](emphasis added)[/size]While Amar’s analysis of past snowfall history is interesting, it should not be construed to imply a most likely outcome of this year’s snowpack. What it does show is that this winter is similar to winters that have been observed in the past. If you believe the climate modelers, what has been normal or typical in the past will become very abnormal in the near future. Correlations made now with past weather events will become meaningless in predicting the future. It is quite possible that within the next few years we will begin to notice a very different regime of temperature and snowfall in the Cascades. That change could already be happening.
Is that really what the climate modelers are saying? Not really, or at least that's a severe exaggeration of what most (scientifically peer-reviewed, published, etc.) climate modelers are saying. But I suspect you know that already, and are just being hyperbolic and alarmist (although some degree of alarm over anthropogenic climate change is probably warranted).
With apologies (since I dislike it when others do this), I've slightly reworded the last 4 sentences to give a more reasonable view that better reflects current climate scientists' consensus:
"If you believe the climate modelers, what has been normal or typical in the past will become
My main point is that, especially considering the (very limited) 17 year set of data I presented, the effects of climate change are unlikely to be significant or detectable in regards to predicting likely snowpack outcomes for this season. The effects due to smaller-time-scale variability such as PDO (period of decades), ENSO (period of years), and MJO (period of months) are much more significant for this season and the next several too than that of climate change.
Amar's post made me want to make some graphs to take a look at the trend visually.
(numbers indicate years since 1900, thus year 113 was last year).
In general, mid-december snowpack (snow water equivalent) is correlated with April snowpack.
I like it -- I was originally thinking of making a plot very similar to this and calculating linear correlation coefficients and all that, using long-term data from Paradise (since 1916), Crater Lake (since 1919), Holden Village (since 1962), perhaps a few other mountain sites where I could get long-term data (50+ years) from the National Climatic Data Center (unfortunately there are very few such sites) -- but then I just decided to take a look at the NWAC's CLISNO tables, since those sites are most relevant for skiers in this region.
Although there is an obvious correlation in the graph, it is fairly weak (i.e. the lines are fairly flat in slope, and the y-intercepts are strongly non-zero) at all except Harts Pass. Looking at the data points pretty much supports the conclusion I reached in the original post above. Taking just the Paradise data (most of the uppermost data points), April 1 snowpacks in the near-normal range (say 65-85" of SWE) are found in seasons which have December 15 snowpacks ranging from 9" to 37" -- that's a vast range of December 15 snowpacks, covering the full gamut from far-below-normal to far-above-normal, all of which produced near-normal April 1 snowpacks! (On a side note, it's worth mentioning that the Paradise SNOTEL site is at 5130 ft, significantly lower than the Paradise NWAC site and where the NPS manually records daily data, 5420 ft.) The effect is less easy to discern for the other sites shown in the graph, and the correlation is stronger than for Paradise in each case, but near-normal April 1 snowpacks still occur over a wide range of December 15 snowpack depths at those sites too.
I would interpret this as saying that often our heaviest snowfalls will come after the new year. However, once we run out of winter (March 1), we essentially will only maintain the snowpack, rather than have any more chance to build it.
Interestingly, in sites to the east of the crest, early season correlations appear to have a stronger influence on the late season. At Hart's Pass, even Nov 16 snowpack appears to correlate with May snowpack. This may be because it is the coldest (receiving air from the BC interior), and highest site I considered. This actually might also be true for Stampede Pass, which also seems to have more persistent correlations than Stevens Pass.
We definitely don't run out of winter on March 1, at least not at reasonable elevations in the Cascades. At most sites above about 4000 ft in the WA Cascades (i.e NOT Snoqualmie in particular), 5000 ft in the OR Cascades, and 6000 ft in the CA Cascades, the month which has the highest ratio of average snowfall to average precipitation is March! Not January or February! (Several years ago, I analyzed data from many dozens of sites from SW BC all the way to the southern Sierra Nevada, calculating snowfall to precipitation ratios for the season and each winter month as a function of elevation and location -- very interesting data and plots, too much to present here now.) I suspect that cooling ocean temperature in the North Pacific throughout the winter contributes to this effect, along with a reduced likelihood of Pineapple Express systems in March and later. The average seasonal snowpack maximum is around April 1 for those sites (4000+ ft WA Cascades, 5000+ ft OR Cascades, 6000+ ft CA Cascades), even trending as late as mid-April for some higher sites and more northerly sites.
Not sure what to think about Harts Pass and other east side locations, that is interesting that early-season correlations appear to be stronger. I've spent much less time studying snowpack trends at those sites, even compared to places like southern OR and northern CA, since I personally tend to ski on the east side much less often than I do anywhere along the volcanic crest of the range all the way south to California.
Please Log in or Create an account to join the conversation.
- T. Eastman
- [T. Eastman]
-
- Offline
- Senior Member
-
Less
More
- Posts: 288
- Thank you received: 0
18 Dec 2013 21:22 #211375
by T. Eastman
Replied by T. Eastman on topic Re: How unusual is the current low PNW snowpack?
What type of skis work best when skiing in graphs?
Please Log in or Create an account to join the conversation.
- Jonn-E
- [Jonn-E]
-
- Offline
- Junior Member
-
Less
More
- Posts: 169
- Thank you received: 0
19 Dec 2013 08:13 #211377
by Jonn-E
Replied by Jonn-E on topic Re: How unusual is the current low PNW snowpack?
I looked around for raw data concerning basin-wide SWE measurements but none is available in an easy-to-use format. This data archive may have the raw data in there as it is used to assemble some of the NSIDC products but frankly I'm not ambitious enough to wade through it myself:
ftp://sidads.colorado.edu/DATASETS/NOAA/G02158/
While poking around I did find some fun products though that I was not previously aware of. I think a lot of folks will get a kick out of this:
www.nohrsc.noaa.gov/nsa/js_animate.html?...thwest&ts=24&large=1
I wish that was in .GIF from so I could just have it display on this page! It is SNOTEL data combined with remote sensing via airplane flyovers to recreate basin-wide snow depth analysis, then animated for your viewing pleasure. If you go to the parent site you can see other years or other basins. Visualization of the La Nina year of 2007-2008 is fun and so is the 2008-2009 lowland snow storms.
www.nohrsc.noaa.gov/nsa/index.html?regio...nth=6&day=19&units=e
Addressing a comment Amar made and that a lot of other people notice I'm sure: with the exception that it is a pass which makes it climatologically unique, Snoqualmie pass is beginning to, and likely will slowly continue to, transition from the kinds of conditions that make snow a sure-thing with most winter systems to an area that only gets snow during favorable conditions. This is the difference between alpine and lowland systems around here, and that SNOTEL site is right at the transition elevation at this point and is very sensitive to minor fluctuations in temperature. It will be a fascinating site to watch in the decades to come because taken at face value it looks like Snoqualmie ski area could suffer the same fate as poor Mt. Pilchuck, but then it has cold eastern flow that protects what snow it does get. As a very brief summary, back when I was investigating SNOTEL data a lot more seriously the trends and research suggested that as our climate slowly begins to warm the trend will be towards a slowly rising regional snow line, but that is hydrologically balanced by an increase in percipitation (more snow at higher areas). The correlations were weak and my understanding is dated though, so take that statement with a grain of salt.
Finally, I'm curious Amar, do you work with this data professionally/academically or do you just have a keen personal interest? Most folks don't know of or throw out acronyms like ENSO, SST, and PDO")
ftp://sidads.colorado.edu/DATASETS/NOAA/G02158/
While poking around I did find some fun products though that I was not previously aware of. I think a lot of folks will get a kick out of this:
www.nohrsc.noaa.gov/nsa/js_animate.html?...thwest&ts=24&large=1
I wish that was in .GIF from so I could just have it display on this page! It is SNOTEL data combined with remote sensing via airplane flyovers to recreate basin-wide snow depth analysis, then animated for your viewing pleasure. If you go to the parent site you can see other years or other basins. Visualization of the La Nina year of 2007-2008 is fun and so is the 2008-2009 lowland snow storms.
www.nohrsc.noaa.gov/nsa/index.html?regio...nth=6&day=19&units=e
Addressing a comment Amar made and that a lot of other people notice I'm sure: with the exception that it is a pass which makes it climatologically unique, Snoqualmie pass is beginning to, and likely will slowly continue to, transition from the kinds of conditions that make snow a sure-thing with most winter systems to an area that only gets snow during favorable conditions. This is the difference between alpine and lowland systems around here, and that SNOTEL site is right at the transition elevation at this point and is very sensitive to minor fluctuations in temperature. It will be a fascinating site to watch in the decades to come because taken at face value it looks like Snoqualmie ski area could suffer the same fate as poor Mt. Pilchuck, but then it has cold eastern flow that protects what snow it does get. As a very brief summary, back when I was investigating SNOTEL data a lot more seriously the trends and research suggested that as our climate slowly begins to warm the trend will be towards a slowly rising regional snow line, but that is hydrologically balanced by an increase in percipitation (more snow at higher areas). The correlations were weak and my understanding is dated though, so take that statement with a grain of salt.
Finally, I'm curious Amar, do you work with this data professionally/academically or do you just have a keen personal interest? Most folks don't know of or throw out acronyms like ENSO, SST, and PDO
Please Log in or Create an account to join the conversation.
- Pete_H
- [Pete_H]
-
- Offline
- Junior Member
-
Less
More
- Posts: 140
- Thank you received: 0
19 Dec 2013 09:00 #211378
by Pete_H
I'd bring my fatties for a couple feet of fresh data.
Replied by Pete_H on topic Re: How unusual is the current low PNW snowpack?
What type of skis work best when skiing in graphs?
I'd bring my fatties for a couple feet of fresh data.
Please Log in or Create an account to join the conversation.
- flowing alpy
- [flowing alpy]
-
- Offline
- Platinum Member
-
Less
More
- Posts: 1272
- Thank you received: 0
19 Dec 2013 09:04 #211379
by flowing alpy
b
Replied by flowing alpy on topic Re: How unusual is the current low PNW snowpack?
rax skis due to the tight quarters.What type of skis work best when skiing in graphs?
b
Please Log in or Create an account to join the conversation.
- Charlie Hagedorn
- [trumpetsailor]
-
- Offline
- Elite Member
-

Less
More
- Posts: 913
- Thank you received: 1
19 Dec 2013 11:57 #211380
by Charlie Hagedorn
Very cool. I'm still thinking about how to best interpret your correlation plots. One thing I might suggest: set the red/green scale to span [-1,1]. The location of black as off-zero understates the apparent correlation. Do your tools permit an on-the-fly generation of a significance measure to go along with the plot? Which software are you using?
(Also, for the color-blind, there may be a superior color palette choice. I haven't thought about it in the context of this sort of plot).
Thanks for bringing more data analysis to the party.
Replied by Charlie Hagedorn on topic Re: How unusual is the current low PNW snowpack?
Amar's post made me want to make some graphs to take a look at the trend visually.
Very cool. I'm still thinking about how to best interpret your correlation plots. One thing I might suggest: set the red/green scale to span [-1,1]. The location of black as off-zero understates the apparent correlation. Do your tools permit an on-the-fly generation of a significance measure to go along with the plot? Which software are you using?
(Also, for the color-blind, there may be a superior color palette choice. I haven't thought about it in the context of this sort of plot).
Thanks for bringing more data analysis to the party
. Please Log in or Create an account to join the conversation.
- sprice
- [sprice]
-
- Offline
- Junior Member
-
Less
More
- Posts: 66
- Thank you received: 0
19 Dec 2013 18:31 #211385
by sprice
Replied by sprice on topic Re: How unusual is the current low PNW snowpack?
bscott,
You wouldn't by chance actually be a meteorologist?
You aren't suggesting that the pattern shown by n-1 and n won't result in n+1?
Shocking......
You may forget that color graphs tell the truth.
You wouldn't by chance actually be a meteorologist?
You aren't suggesting that the pattern shown by n-1 and n won't result in n+1?
Shocking......
You may forget that color graphs tell the truth.
Please Log in or Create an account to join the conversation.
- bscott
- [bscott]
-
- Offline
- New Member
-
Less
More
- Posts: 31
- Thank you received: 0
19 Dec 2013 20:36 #211389
by bscott
I disagree with Amar’s comment that I have exaggerated what climate modelers are currently saying.
A recent publication (scientifically peer reviewed) in Nature (October, 2013, 502, 183–187) attempts to clarify what the climate modelers are indeed saying. The article frames the climate change discussion in a manner more easily understood by the uninformed public. If carbon emissions remain at their current levels, the authors point out that climate models predict that large regions around the world will soon see temperature increases that have no recorded historical precedent. By 2047, more than half of the planet will experience average temperatures hotter than anything seen between 1860 and 2005. That is only 34 years! Seattle is one of the cities impacted. Eventually (shortly after 2047), the coldest year in Seattle is predicted to be hotter than the hottest year ever recorded in the last 150 years (1860-2005). If the models are correct, within the next 30 years, the climate change signal should quickly overwhelm the natural variability signal in our weather data.
The point I wanted to make is that our climate is changing, and fairly rapidly. What has seemed usual in the past may not be what we can expect in the future. Past performance does not guarantee future results. While I agree with Amar that the signal from climate change is still too small to detect in the current weather patterns, it is, never-the-less there. That signal should be increasingly more apparent in the coming years. I believe that within a few years we will begin to notice a very different regime of temperature and snowfall in the Cascades. That change could already be happening.
Replied by bscott on topic Re: How unusual is the current low PNW snowpack?
[/size]
Is that really what the climate modelers are saying? Not really, or at least that's a severe exaggeration of what most (scientifically peer-reviewed, published, etc.) climate modelers are saying. But I suspect you know that already, and are just being hyperbolic and alarmist (although some degree of alarm over anthropogenic climate change is probably warranted).
I disagree with Amar’s comment that I have exaggerated what climate modelers are currently saying.
A recent publication (scientifically peer reviewed) in Nature (October, 2013, 502, 183–187) attempts to clarify what the climate modelers are indeed saying. The article frames the climate change discussion in a manner more easily understood by the uninformed public. If carbon emissions remain at their current levels, the authors point out that climate models predict that large regions around the world will soon see temperature increases that have no recorded historical precedent. By 2047, more than half of the planet will experience average temperatures hotter than anything seen between 1860 and 2005. That is only 34 years! Seattle is one of the cities impacted. Eventually (shortly after 2047), the coldest year in Seattle is predicted to be hotter than the hottest year ever recorded in the last 150 years (1860-2005). If the models are correct, within the next 30 years, the climate change signal should quickly overwhelm the natural variability signal in our weather data.
The point I wanted to make is that our climate is changing, and fairly rapidly. What has seemed usual in the past may not be what we can expect in the future. Past performance does not guarantee future results. While I agree with Amar that the signal from climate change is still too small to detect in the current weather patterns, it is, never-the-less there. That signal should be increasingly more apparent in the coming years. I believe that within a few years we will begin to notice a very different regime of temperature and snowfall in the Cascades. That change could already be happening.
Please Log in or Create an account to join the conversation.
- Amar Andalkar
- [andalkar]
-
Topic Author
- Offline
- Premium Member
-
Less
More
- Posts: 635
- Thank you received: 0
19 Dec 2013 23:29 #211391
by Amar Andalkar
OK, I appreciate the explanation of your point of view on this issue. Perhaps I am hoping that point of view turns out to be an exaggeration of the actual degree of climate change which occurs over the rest of my lifetime, at least.
Actually, I do agree with your statement that "within a few years we will begin to notice a very different regime of temperature and snowfall in the Cascades", or at least fear that it will come true -- but not primarily due to climate change within the next 2 decades, but rather due to the Pacific Decadal Oscillaton shifting back towards its warm phase instead of the current cold phase we are in.
Which would mean a likely return to the bad old years of the late 1970s, 1980s, and early 1990s, when even the best years were barely above average, and most years were mediocre to well-below average (although even those years produced snowpacks far beyond any others in the lower 48 outside the Sierra). I was fortunate to start backcountry skiing in the Northwest during the summer before 1996-97, which turned out to be the first huge snow year in over 2 decades, and then enjoyed a number of huge to record-type years since then (1998-99, 2001-2, 2005-6, 2007-8, 2010-11, 2011-12), with only 2 far-below-normal years (2000-1 and 2004-5). A return even to the snowpack regime of the late 1970s to early 1990s period would be a major ongoing disappointment compared to recent years.
No professional or academic involvement in meteorology or atmospheric sciences, although self-taught over a decade ago to maybe an advanced undergrad or beginning grad-student level in that field (or at least the areas of it which interest me). I'm an experimental physicist by training and spent a number of years as research faculty at UW in that field, although as many of you know I'm taking a lengthy career break to ski mountaineer full-time and attempt to complete my Cascade volcanoes ski guidebook. Perhaps ironically given my frequent posts of snow-related data, I never liked data analysis that much, and preferred instead to spend as much lab time as possible designing, machining, and building various experiments, apparatus, ultra-high vacuum systems, diode-laser systems, etc.
The choice of using red and green in any plot definitely makes it hard for many of us to see it, I'm only minimally red-green color blind (the problem is worse for me when the red-green area is small, subtending a tiny angle in my field of vision) but always tend to notice that issue. Even the first plot of data points and lines is hard to see for me, trying to tell the red and green points apart with no other clue like differing data point markers for each site. But it's always hard to get those with normal color vision to use only red-green color-blind-safe colors when things look "fine" to them.
Replied by Amar Andalkar on topic Re: How unusual is the current low PNW snowpack?
Link to that Nature article (not free without institutional access): www.nature.com/nature/journal/v502/n7470/full/nature12540.htmlI disagree with Amar’s comment that I have exaggerated what climate modelers are currently saying.
A recent publication (scientifically peer reviewed) in Nature (October, 2013, 502, 183–187) attempts to clarify what the climate modelers are indeed saying.
. . .
The point I wanted to make is that our climate is changing, and fairly rapidly. What has seemed usual in the past may not be what we can expect in the future. Past performance does not guarantee future results. While I agree with Amar that the signal from climate change is still too small to detect in the current weather patterns, it is, never-the-less there. That signal should be increasingly more apparent in the coming years. I believe that within a few years we will begin to notice a very different regime of temperature and snowfall in the Cascades. That change could already be happening.
OK, I appreciate the explanation of your point of view on this issue. Perhaps I am hoping that point of view turns out to be an exaggeration of the actual degree of climate change which occurs over the rest of my lifetime, at least.
Actually, I do agree with your statement that "within a few years we will begin to notice a very different regime of temperature and snowfall in the Cascades", or at least fear that it will come true -- but not primarily due to climate change within the next 2 decades, but rather due to the Pacific Decadal Oscillaton shifting back towards its warm phase instead of the current cold phase we are in.
Which would mean a likely return to the bad old years of the late 1970s, 1980s, and early 1990s, when even the best years were barely above average, and most years were mediocre to well-below average (although even those years produced snowpacks far beyond any others in the lower 48 outside the Sierra). I was fortunate to start backcountry skiing in the Northwest during the summer before 1996-97, which turned out to be the first huge snow year in over 2 decades, and then enjoyed a number of huge to record-type years since then (1998-99, 2001-2, 2005-6, 2007-8, 2010-11, 2011-12), with only 2 far-below-normal years (2000-1 and 2004-5). A return even to the snowpack regime of the late 1970s to early 1990s period would be a major ongoing disappointment compared to recent years.
Finally, I'm curious Amar, do you work with this data professionally/academically or do you just have a keen personal interest? Most folks don't know of or throw out acronyms like ENSO, SST, and PDO
No professional or academic involvement in meteorology or atmospheric sciences, although self-taught over a decade ago to maybe an advanced undergrad or beginning grad-student level in that field (or at least the areas of it which interest me). I'm an experimental physicist by training and spent a number of years as research faculty at UW in that field, although as many of you know I'm taking a lengthy career break to ski mountaineer full-time and attempt to complete my Cascade volcanoes ski guidebook. Perhaps ironically given my frequent posts of snow-related data, I never liked data analysis that much, and preferred instead to spend as much lab time as possible designing, machining, and building various experiments, apparatus, ultra-high vacuum systems, diode-laser systems, etc.
(Also, for the color-blind, there may be a superior color palette choice. I haven't thought about it in the context of this sort of plot).
The choice of using red and green in any plot definitely makes it hard for many of us to see it, I'm only minimally red-green color blind (the problem is worse for me when the red-green area is small, subtending a tiny angle in my field of vision) but always tend to notice that issue. Even the first plot of data points and lines is hard to see for me, trying to tell the red and green points apart with no other clue like differing data point markers for each site. But it's always hard to get those with normal color vision to use only red-green color-blind-safe colors when things look "fine" to them.
Please Log in or Create an account to join the conversation.
- Bird Dog
- [Bird Dog]
-
- Offline
- Junior Member
-
Less
More
- Posts: 72
- Thank you received: 0
24 Dec 2013 14:18 #211453
by Bird Dog
Replied by Bird Dog on topic Re: How unusual is the current low PNW snowpack?
Below is a quote from the Forcast Discussion from NWS Seattle today.
.CLIMATE...THERE IS A CHANCE THAT THE REMAINDER OF THE MONTH WILL BE
DRY. THE PRECIPITATION TOTAL AT SEATTLE-TACOMA AIRPORT SO FAR FOR
THE MONTH OF DECEMBER IS 1.62 INCHES. THIS WOULD BE THE SECOND
DRIEST DECEMBER ON RECORD AT THE AIRPORT SURPASSED ONLY BY THE
RECORD 1.37 INCHES SET IN 1978. INCLUDING THE FEDERAL BUILDING
RECORDS WHICH GO BACK TO 1891 THIS WOULD BE THE FIFTH DRIEST
DECEMBER.
IT IS INTERESTING TO NOTE THAT THE RECORD WET SEPTEMBER WE HAD THIS
YEAR...6.17 INCHES...BROKE THE OLD SEPTEMBER RECORD SET IN 1978.
FELTON
Interesting.
Please Log in or Create an account to join the conversation.
- tele.skier
- [tele.skier]
-
- Offline
- Junior Member
-
Less
More
- Posts: 97
- Thank you received: 0
24 Dec 2013 14:46 #211457
by tele.skier
Replied by tele.skier on topic Re: How unusual is the current low PNW snowpack?
Recent less scientific research has shown the snowpack to SUCK....
Uller,.... a little help please??
Uller,.... a little help please??
Please Log in or Create an account to join the conversation.
- gorp
- [gorp]
-
- Offline
- New Member
-
Less
More
- Posts: 39
- Thank you received: 0
24 Dec 2013 16:02 #211458
by gorp
Replied by gorp on topic Re: How unusual is the current low PNW snowpack?
tragically, no one knows whether it will snow or not.
Please Log in or Create an account to join the conversation.