3/28 Mt. St. Helens
3/28/11
WA Cascades West Slopes South (Mt Rainier)
4663
9
Of course it wasn't all that surprising... but the marginal weather window that was forecast for Monday morning and afternoon was just that: marginal. Mt. St. Helens suffers or is blessed with not having a single mountain range between it and the big wide ocean. Thus even a on-shore flow with winds topping 20mph means that as moisture rises on the cascade front it produces puking snow on the volcano. I have to say too that telemetry on Helens is problematic as conditions vary wildly from the West to South side. Surprising was the amount of snow at Marble Mountain snopark at 2700 feet. chalk up 6-9 feet with a full foot of fresh. snow levels were below 2000 feet despite forecasts at 3500 feet and telemetry showing early temps approaching 40 degrees.
the snow was predictably heavy and sun affected on the south exposures despite heavy snow and very little sun (6-10 inches on Monday). again, snotel and forecasts did not show this much moisture at Helens but it was still there.
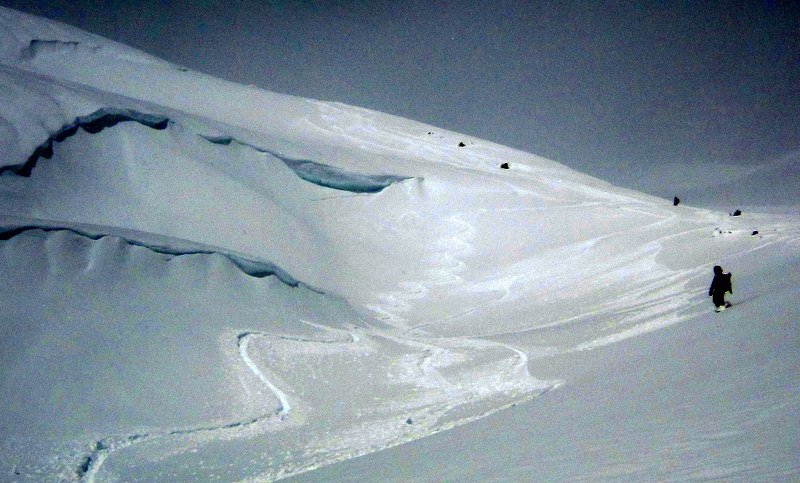
In the end we made it to 5600 feet easily and turned around in mostly whiteout conditions. Of concerns was flying over unseen cornices on the way down. the sun however did show up for about 5 minutes and my partner Chris and I busted down 2000 verts of worm flow goodness in nothing flat.
stability was good as far as anything big goes...but cornices were weaked by the sun and several small failures were seen. wet snow slides into terrain traps were also a fairly major concern. I like Helens however in that there are many many parallel ridge lines to skin up without much exposure. worse comes to worse the ridges offer safe retreat.
pictures to follow soon.
oh and btw....there was a ton of snow on the road, unplowed from 1500 feet up. Marble Mountain hadn't been plowed in several days of heavy snow.
the snow was predictably heavy and sun affected on the south exposures despite heavy snow and very little sun (6-10 inches on Monday). again, snotel and forecasts did not show this much moisture at Helens but it was still there.
In the end we made it to 5600 feet easily and turned around in mostly whiteout conditions. Of concerns was flying over unseen cornices on the way down. the sun however did show up for about 5 minutes and my partner Chris and I busted down 2000 verts of worm flow goodness in nothing flat.
stability was good as far as anything big goes...but cornices were weaked by the sun and several small failures were seen. wet snow slides into terrain traps were also a fairly major concern. I like Helens however in that there are many many parallel ridge lines to skin up without much exposure. worse comes to worse the ridges offer safe retreat.
pictures to follow soon.
oh and btw....there was a ton of snow on the road, unplowed from 1500 feet up. Marble Mountain hadn't been plowed in several days of heavy snow.
author=savegondor link=topic=20371.msg86510#msg86510 date=1301437009]
oh and btw....there was a ton of snow on the road, unplowed from 1500 feet up. Marble Mountain hadn't been plowed in several days of heavy snow.
I was there last Thursday and found the same poor road and parking lot conditions. Three low clearance cars were crammed in a small patch of plowed parking lot. The rest of the lot would have been too risky to park in and then get out. Makes you wonder why we pay for snow park permits.
JJS
What do you expect at double last years' rate?
http://blog.oregonlive.com/terryrichard/2011/03/winter_recreation_road_plowing.html
Do your snopark fees support a plan that keeps the park accessible, or a plan of plowing 'X' times/season?
Ask your legislator
http://blog.oregonlive.com/terryrichard/2011/03/winter_recreation_road_plowing.html
Do your snopark fees support a plan that keeps the park accessible, or a plan of plowing 'X' times/season?
Ask your legislator
After having way to many bad trips on Mt St Helens, my rule of thumb is 2-3 clear days after a storm. IMHO, corn is the best way to enjoy the mountain.
And I believe they pretty much stop plowing sometime in March.
And I believe they pretty much stop plowing sometime in March.
author=savegondor link=topic=20371.msg86510#msg86510 date=1301437009]
I have to say too that telemetry on Helens is problematic as conditions vary wildly from the West to South side. Surprising was the amount of snow at Marble Mountain snopark at 2700 feet. chalk up 6-9 feet with a full foot of fresh. snow levels were below 2000 feet despite forecasts at 3500 feet and telemetry showing early temps approaching 40 degrees.
the snow was predictably heavy and sun affected on the south exposures despite heavy snow and very little sun (6-10 inches on Monday). again, snotel and forecasts did not show this much moisture at Helens but it was still there.
Thanks for the report, snow conditions info is always appreciated. Your report spurred me to do some detective work, looking through the telemetry data. The telemetry is rarely ever "wrong" if you use it properly.
But I think you might have been looking at the wrong telemetry for skiing St Helens. Even though you say "snotel", it seems like you were only looking at the NWAC site and not at SNOTEL, because the snowfall and temperatures you found almost exactly match the June Lake SNOTEL data.
The NWAC site on Coldwater Ridge (8 miles NNW of the lava dome) is of no use for skiing, it has no correlation to conditions on the south side. You need to look at the SNOTEL sites which are actually located on the south side at June Lake (3440 ft, 4 miles SSE of the lava dome) and Swift Creek (4440 ft, 2.5 miles south of the lava dome). June Lake SNOTEL is just east of the Worm Flows route and only 800 ft higher than Marble Mtn Sno-Park, while Swift Creek SNOTEL is just west of the Worm Flows route higher up (the snowdepth sensor at this site has not been working for several weeks, but the snow-water and temps appear to be OK).
My Mount Saint Helens WebCams page shows all of this telemetry on a single page: http://www.skimountaineer.com/MtnWebCams/StHelens-MtnWebCams.html?size=small&telemetry=true
Compare the telemetry on the north and south sides, pasted below for the day of your trip and the previous 24 hours. Even at almost identical elevations, the temps on the north side are several degrees warmer, and precip is much less, by a huge factor. June Lake got over 2" of precip as shown in both the Snow Water and Year-To-Date Precip columns, while Spirit Lake got less than 0.8" and Coldwater Ridge only 0.2". The new snowfall at June Lake was 13", with about 4" at Spirit Lake and probably near zero at Coldwater Ridge. Temps are only 40+ °F at Coldwater Ridge, but not even close to that at June Lake.
So the conditions you found and report in your TR reflect what the June Lake SNOTEL shows.
June Lake SNOTEL, 3440 ft, 4 miles SSE Spirit Lake SNOTEL, 3520 ft, 4.5 miles N Coldwater Ridge NWAC, 3260 ft, 8 miles NNW
Snow Snow YTD Current Snow Snow YTD Current MM/DD Hour Temp RH Wind Wind Wind Hour Total
Date Time Water Depth Precip Temp Date Time Water Depth Precip Temp PST F % Avg Max Dir Prec. Prec.
(PST) (in) (in) (in) (F) (PST) (in) (in) (in) (F) 3260' 3260' 3260' 3260' 3260' 3260' 3260'
------------------------------------------------ ------------------------------------------------ -----------------------------------------------------
2011-03-27 0000 55.8 129.0 138.2 32.0 2011-03-27 0000 13.9 23.0 72.9 31.5 3 27 0 33 93 1 6 168 0 .01
2011-03-27 0100 55.8 129.0 138.2 32.2 2011-03-27 0100 13.9 23.0 73.0 31.6 3 27 100 32 94 2 8 166 0 .01
2011-03-27 0200 55.9 129.0 138.2 32.2 2011-03-27 0200 13.9 23.0 73.0 32.2 3 27 200 33 93 3 12 132 0 .01
2011-03-27 0300 55.9 129.0 138.3 32.2 2011-03-27 0300 14.0 23.0 72.9 32.2 3 27 300 33 92 5 15 155 0 .01
2011-03-27 0400 56.0 129.0 138.4 32.0 2011-03-27 0400 14.0 23.0 73.0 31.8 3 27 400 33 95 5 11 147 .01 .02
2011-03-27 0500 56.2 132.0 138.4 32.0 2011-03-27 0500 13.9 23.0 73.0 32.7 3 27 500 33 95 5 13 135 0 0
2011-03-27 0600 56.3 -99.9 138.5 32.2 2011-03-27 0600 14.0 23.0 72.6 32.9 3 27 600 33 95 7 18 123 0 0
2011-03-27 0700 56.3 133.0 138.7 32.7 2011-03-27 0700 13.9 23.0 73.0 33.1 3 27 700 34 95 6 13 119 0 0
2011-03-27 0800 56.5 134.0 138.8 33.6 2011-03-27 0800 14.0 23.0 73.0 32.5 3 27 800 35 93 8 17 156 0 0
2011-03-27 0900 56.5 134.0 138.8 34.0 2011-03-27 0900 14.0 22.0 73.0 32.7 3 27 900 36 90 8 17 150 0 0
2011-03-27 1000 56.6 135.0 138.9 35.8 2011-03-27 1000 14.1 23.0 72.9 33.6 3 27 1000 38 83 8 19 155 0 0
2011-03-27 1100 56.7 135.0 139.0 34.7 2011-03-27 1100 14.2 22.0 72.9 34.7 3 27 1100 42 74 8 16 138 0 0
2011-03-27 1200 56.8 136.0 139.1 34.7 2011-03-27 1200 14.2 22.0 72.8 34.2 3 27 1200 38 83 8 18 136 0 0
2011-03-27 1300 56.9 136.0 139.2 35.2 2011-03-27 1300 14.4 22.0 72.9 34.9 3 27 1300 38 89 7 14 148 0 0
2011-03-27 1400 57.0 136.0 139.2 34.7 2011-03-27 1400 14.5 23.0 72.9 35.2 3 27 1400 41 80 5 13 143 0 0
2011-03-27 1500 57.1 138.0 139.4 34.3 2011-03-27 1500 14.5 23.0 72.7 35.2 3 27 1500 39 86 3 8 172 0 0
2011-03-27 1600 57.1 138.0 139.5 33.8 2011-03-27 1600 14.3 23.0 72.4 35.2 3 27 1600 41 79 3 10 183 0 0
2011-03-27 1700 57.3 138.0 139.6 34.3 2011-03-27 1700 14.5 23.0 72.8 33.3 3 27 1700 35 92 0 4 167 .06 .06
2011-03-27 1800 57.5 141.0 139.7 33.6 2011-03-27 1800 14.6 24.0 73.0 33.7 3 27 1800 36 90 0 2 54 .01 .07
2011-03-27 1900 57.6 142.0 139.8 32.9 2011-03-27 1900 14.6 24.0 73.1 33.1 3 27 1900 35 92 -0 0 270 .03 .1
2011-03-27 2000 57.6 142.0 139.9 32.4 2011-03-27 2000 14.7 26.0 73.3 32.9 3 27 2000 34 94 0 4 288 .05 .15
2011-03-27 2100 57.6 141.0 139.9 32.5 2011-03-27 2100 14.7 25.0 73.3 32.2 3 27 2100 34 95 2 10 294 .03 .18
2011-03-27 2200 57.7 141.0 139.9 32.2 2011-03-27 2200 14.7 26.0 73.3 32.2 3 27 2200 34 95 0 3 301 0 .18
2011-03-27 2300 57.7 141.0 139.9 32.0 2011-03-27 2300 14.8 27.0 73.3 32.4 3 27 2300 33 95 1 6 286 0 .18
2011-03-28 0000 57.7 141.0 139.9 31.8 2011-03-28 0000 14.7 26.0 73.4 31.8 3 28 0 33 94 0 2 328 0 .18
2011-03-28 0100 57.7 141.0 140.0 31.8 2011-03-28 0100 14.8 27.0 73.3 31.6 3 28 100 33 94 -0 0 333 0 .18
2011-03-28 0200 57.7 141.0 140.0 31.8 2011-03-28 0200 14.7 27.0 73.4 31.3 3 28 200 32 93 -0 0 2 0 .18
2011-03-28 0300 57.7 141.0 139.9 31.6 2011-03-28 0300 14.7 27.0 73.4 31.5 3 28 300 33 95 0 0 310 0 .18
2011-03-28 0400 57.7 141.0 140.0 31.8 2011-03-28 0400 14.7 26.0 73.4 30.9 3 28 400 32 94 -0 0 2 0 .18
2011-03-28 0500 57.8 140.0 140.0 31.5 2011-03-28 0500 14.7 26.0 73.4 30.2 3 28 500 32 94 -0 0 16 0 0
2011-03-28 0600 57.8 141.0 140.0 31.5 2011-03-28 0600 14.7 27.0 73.4 28.4 3 28 600 33 94 0 0 74 0 0
2011-03-28 0700 57.8 141.0 139.9 32.2 2011-03-28 0700 14.7 26.0 73.4 29.8 3 28 700 34 93 0 1 54 0 0
2011-03-28 0800 57.8 141.0 140.0 33.6 2011-03-28 0800 14.7 26.0 73.4 37.2 3 28 800 39 80 0 1 137 0 0
2011-03-28 0900 57.8 141.0 140.2 34.7 2011-03-28 0900 14.8 26.0 73.2 34.7 3 28 900 40 78 0 2 152 0 0
2011-03-28 1000 57.9 140.0 140.2 36.0 2011-03-28 1000 14.7 25.0 72.8 38.1 3 28 1000 42 74 0 4 144 0 0
2011-03-28 1100 57.9 140.0 140.2 34.7 2011-03-28 1100 14.7 25.0 72.6 35.4 3 28 1100 43 76 3 9 151 0 0
2011-03-28 1200 57.9 140.0 140.2 35.4 2011-03-28 1200 14.7 24.0 72.3 39.0 3 28 1200 45 71 5 13 171 0 0
2011-03-28 1300 57.9 140.0 140.2 35.6 2011-03-28 1300 14.6 23.0 72.2 40.1 3 28 1300 47 68 5 10 176 0 0
2011-03-28 1400 57.9 140.0 140.2 35.1 2011-03-28 1400 14.6 23.0 72.1 37.8 3 28 1400 47 68 5 10 181 0 0
2011-03-28 1500 57.9 139.0 140.3 36.1 2011-03-28 1500 14.6 23.0 72.3 36.3 3 28 1500 44 67 6 12 170 0 0
2011-03-28 1600 57.9 139.0 140.2 34.9 2011-03-28 1600 14.6 23.0 72.4 36.9 3 28 1600 41 76 4 11 174 0 0
2011-03-28 1700 57.9 139.0 140.2 35.1 2011-03-28 1700 14.6 23.0 72.7 35.8 3 28 1700 40 76 4 13 173 0 0
2011-03-28 1800 57.9 138.0 140.2 34.7 2011-03-28 1800 14.7 24.0 72.9 35.1 3 28 1800 38 84 6 13 170 0 0
2011-03-28 1900 57.9 138.0 140.3 34.5 2011-03-28 1900 14.7 23.0 73.1 35.1 3 28 1900 38 89 6 13 166 0 0
2011-03-28 2000 58.0 138.0 140.3 34.3 2011-03-28 2000 14.7 23.0 73.1 36.1 3 28 2000 37 93 4 11 167 .01 .01
2011-03-28 2100 58.1 138.0 140.3 34.0 2011-03-28 2100 14.7 23.0 73.2 36.1 3 28 2100 36 92 4 10 165 0 .01
2011-03-28 2200 58.2 139.0 140.4 34.0 2011-03-28 2200 14.7 23.0 73.3 34.9 3 28 2200 36 92 2 11 170 .01 .02
2011-03-28 2300 58.2 139.0 140.4 34.0 2011-03-28 2300 14.8 23.0 73.4 35.1 3 28 2300 36 91 5 14 135 0 .02
[/tt][/size]
So, the obvious question is [i]why[/i] is there such an extreme difference between the north and south sides of Mt St Helens? Why are the temps slightly colder on the south, and the precip and snowfall MUCH greater??
Because of its position well west of the crest and totally isolated from other mountains, Mt St Helens provides a textbook demonstration of many basic meteorological concepts. In this case, adiabatic heating and rain shadowing. As moist air during a storm with southerly winds is forced up the south side of the volcano, it becomes saturated (dew point = temperature, humidity = 100%) and cools at a certain rate, the moist adiabatic lapse rate (MALR) of about 3 °F per 1000 ft. Precip falls continuously during this time. As the air crosses the summit (crater rim) and begins descending, it warms at the same rate at first. But this immediately makes the air unsaturated (dew point < temperature, humidity < 100%), so the precip stops, and the air then begins warming at a much different and greater rate, the dry adiabatic lapse rate (DALR) of about 5.5 °F per 1000 ft. Therefore, by the time it reaches Spirit Lake the air is slightly warmer than it was at June Lake, and it continues warming as it heads to Coldwater Ridge.
So during stormy periods (which typically have S or SW winds on St Helens), the temps are colder on the south side at a given elevation than on the north, and the precip is much greater, with snowfall enhanced by a huge factor. That's why there is 140" of snowdepth now at June Lake, but only 23" at the same elevation at Spirit Lake.
All of the major Cascade volcanoes have similar north-south variation, but the effect is most pronounced and extreme on St Helens, along with Baker, Rainier, Adams, Hood, and Shasta -- they're the most prominent and isolated of the volcanoes relative to their surrounding terrain. So it's important to use telemetry sites which actually match the conditions where one is headed to ski, as in some cases sites only a few miles away are in completely different microclimates with little correlation in temperature or snowfall.
I love Amar - 48 rows of data, three subgroups, 6 columns in each subgroup:
Amar...
So, the obvious question is why is there such an extreme difference between the north and south sides of Mt St Helens? Why are the temps slightly colder on the south, and the precip and snowfall MUCH greater??
My question obviously, is why is the question so obvious? I know, I know..."If you have to ask...", Keep it up, Amar! Oh, and keep dumbing it down for those like me.
Amar, being a weather nerd myself you gave me exactly what I wanted. any books on the subject you could recommend? The difference between sites on the mountain with similar elevations is amazing!
author=Amar Andalkar link=topic=20371.msg86542#msg86542 date=1301457268]
Because of its position well west of the crest and totally isolated from other mountains, Mt St Helens provides a textbook demonstration of many basic meteorological concepts. In this case, adiabatic heating and rain shadowing. As moist air during a storm with southerly winds is forced up the south side of the volcano, it becomes saturated (dew point = temperature, humidity = 100%) and cools at a certain rate, the moist adiabatic lapse rate (MALR) of about 3 °F per 1000 ft. Precip falls continuously during this time. As the air crosses the summit (crater rim) and begins descending, it warms at the same rate at first. But this immediately makes the air unsaturated (dew point < temperature, humidity < 100%), so the precip stops, and the air then begins warming at a much different and greater rate, the dry adiabatic lapse rate (DALR) of about 5.5 °F per 1000 ft. Therefore, by the time it reaches Spirit Lake the air is slightly warmer than it was at June Lake, and it continues warming as it heads to Coldwater Ridge.
???
Off to the library.
Very cool example of the phenomena you describe and outside of the norm in the cascades, in which the lee slopes get less precip, but because of cold air pooling and the continental influence, the snow levels are typically lower in mid winter as well. In contrast an isolated summit like st helens gets less precip AND higher SL on the lee.
So does the distinction between the dry adabatic lapse rate and wet adabatic lapse rate explain why we can have snow levels of 3k but it be 55 degrees in the city in the spring, when based on the WALR the SL should be like 7k? Or that something else altogether?
So does the distinction between the dry adabatic lapse rate and wet adabatic lapse rate explain why we can have snow levels of 3k but it be 55 degrees in the city in the spring, when based on the WALR the SL should be like 7k? Or that something else altogether?
Andrew,
To a large extent, the air temp in Seattle (and generally on land immediately downwind of a large expanse of ocean) is set by the ocean surface temps plus whatever radiative heating occurs. This results in the generally mild maritime climate we have (mild winters, mild summers), as the ocean has a lot of thermal inertia and doesn't exhibit large temperature swings with the seasons. Above the boundary layer (first few thousand feet of atmosphere that "feels" the immediate effects of the surface conditions due to turbulent mixing), though, you can bring in significantly colder air from farther north due to the larger scale circulations that does not have a temperature set by the moist (or dry) adiabatic lapse rate starting from the surface temperature (the large scale circulations will move the boundary layer air, too, but it will be slowly adjusting to the surface temperature below it). In fact, the only places you're ever likely to see temperatures that look like the moist adiabatic lapse rate from surface on up is in the middle of a thunderstorm... if it's not saturated (i.e. not in a cloud), the lapse rate won't be moist adiabatic. All this stuff is really at the mercy of the larger scale general circulation, but the local orographic (terrain influenced) effects will tend to lower the snow level due to things like cold pooling, accelerated flow over the mountains lowering the dynamic pressure and temps, and the evaporative cooling that comes from enhanced precipitation, as well.
Andy
grad student, Dept. of Atmos. Sci., UW Seattle
Reply to this TR
Please login first: